Numerical Summaries of Data
1/31
There's no tags or description
Looks like no tags are added yet.
Name | Mastery | Learn | Test | Matching | Spaced |
|---|
No study sessions yet.
32 Terms
Descriptive Statistics def
tools that are used to organize and summarize data numerically
measures of central tendency def
used to represent “central” or “typical values in a data set”
three most common measures of central tendency
mean, median, and mode
mean def
the arithmetic average of a set of data values
Mean forumla
X1+ X2+…Xn/n
mean example
actually do it love
advantage of the mean (3)
it is easy to compute
it is a unique descriptive
it is the most representative measure of center because it takes every score value into account
Disadvantage of the mean
because it takes every score value into account, the mean is sensitive to extreme scores and outliers
outlier def
a data value that is “far away” from the majority of other values in a data set
Median def
the value that divides a dataset into two equal parts such that the same number of scores in the dataset fall above and below this value
Steps to finding a median
arrange all data values in ascending order from least to greatest
given an ODD number of data values, the median is the exact middle value in the ordered list
Given an EVEN number of data values, the median is the average of the middle 2 values in the ordered list
Median EX
do ittttt
Advantage of the Median
Because the median only looks at vlaues in the middle of a dataset, it is less sensitive to extreme scores/outliers than the mean
Disadvantage of the Median
Because it only looks at values in the middle of a dataset, the median is not as representative a measure as the mean
Mode def
the score value that occurs most frequently in a dataset
Mode example
lol do it gurl
if two scores have the same frequency
bimodal
if more than 2 scores have the same greatest frequency
multimodal
advantage of mode
it is the only measure of central tendency appropriate for use with qualitative data
disadvantage of mode
it tends to be less informative than the mean or median when dealing with quantitive data
symmetric distribution def
a distribution of data where the left half of its graph is a mirror image of the right half, and vice versa
Bell shaped distribution shape

positively skewed distribution def
a distribution that is not symmetric because it has a long tail to the right
score values in positively skewed distributions
the majority of score values fall on the low end of the score scale and the outliers extend the tail to the right
how do mean, median, and mode interact in a pos skewed distribution
mode < median < mean
Negatively asked distributions def
a distribution that is not symmetric because its graph extends further to the left
negatively skewed distributions score values
majority of score values fall on the high end and a small number of extreme scores trail the tails to the left
neg skewed distribution image
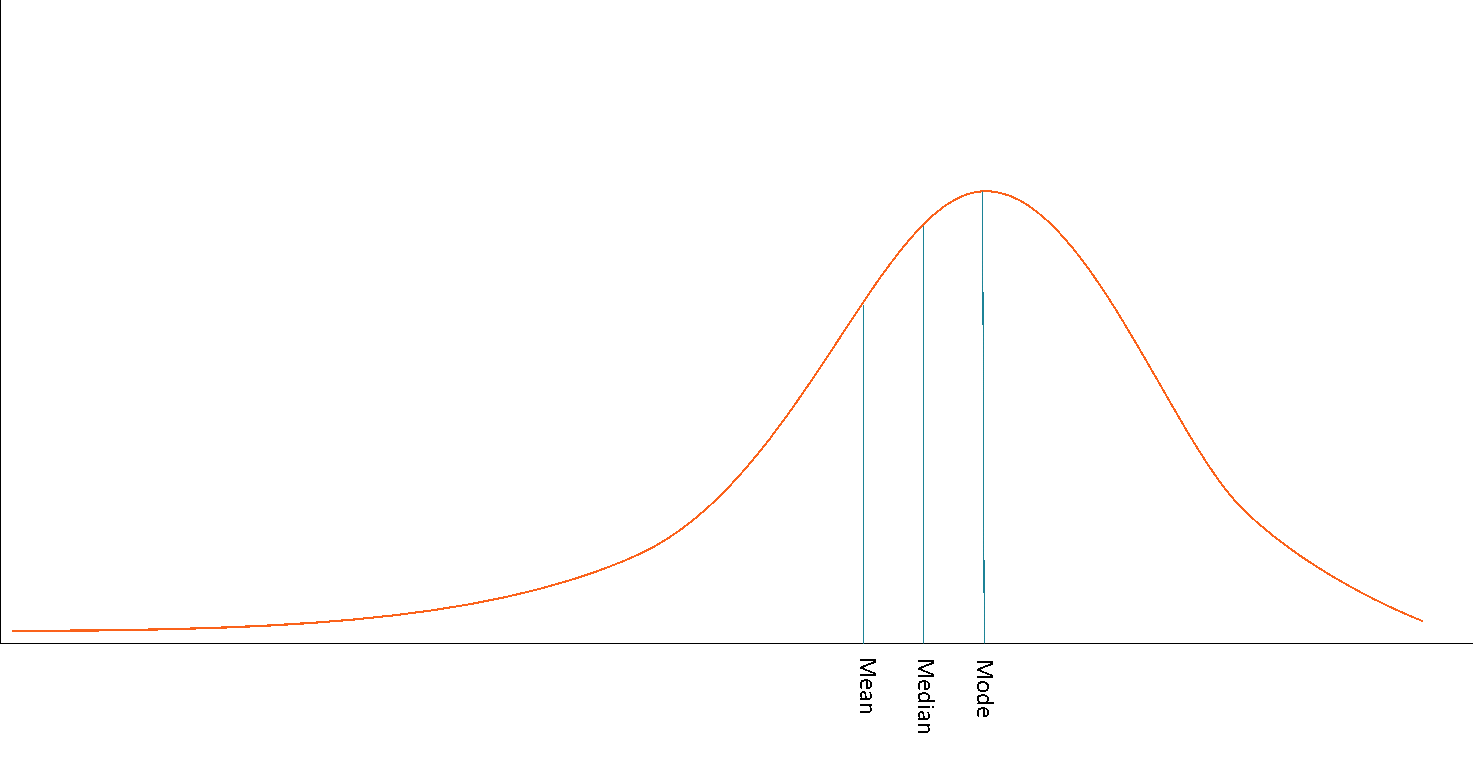
negatively skewed distribution mean, median and mode
mean < median < mode