Kin 483-Ch.8: The T-Test & Chi Square: Comparing Means From 2 Data Sets
1/15
There's no tags or description
Looks like no tags are added yet.
Name | Mastery | Learn | Test | Matching | Spaced | Call with Kai |
|---|
No analytics yet
Send a link to your students to track their progress
16 Terms
Inferential Statistics
Inferential: take a sample from a larger population and make a generalization about the population from it
researchers gather data on a sample and then desire to generalize to a population.
ex: local news:
“There they are again! The most terrifying five words in television.”
“According to a NEW study…”
Population: parameter
Sample: statistics
Variable Classification
Independent Variables: related to the dependent variable often used as a predictor
Dependent Variables: the variable you are trying to predict (criterion variable
Example: We want to predict the number of pull ups the class can do based on body weight
independent variable = body weight
dependent variable = # of pull ups
3 Types of Hypotheses
Research Hypothesis
Null Hypothesis
Alternative Hypothesis
*Statistical hypotheses
Research Hypothesis
educated guess of what will happen
Ex: “Imagery is better for performance than no imagery”
Null Hypothesis
statement that there is no relationship between two variables
Ex: “There is no difference in performance when using different mental strategies”
Often the opposite of the research hypothesis

Alternative Hypothesis
statement that there is a relationship; opposite of the null—what is believed if the null hypothesis is rejected
Ex: “The mean for group 1 and group 2 are not equal”
Reflects what is stated in the research hypothesis

Hypothesis Testing: General Process
Research hypothesis of relationship
Statistical null hypothesis
Alternative hypothesis
Obtain data
Make decision based on probability
Hypothesis Testing: Setting the Alpha Level
Before you can reject or accept a hypothesis you must select a probability level (alpha level)
Alpha Level: the probability of obtaining the statistic by chance
Typical alpha levels:
p=0.05
p=0.01
Hypothesis Testing: Type 1 Error
probability of making an incorrect conclusion
When the null hypothesis is true but it’s incorrectly rejected
Possible causes of error:
measurement error
lack of random sample
investigator bias
Hypothesis Testing: Type 2 Error
concluding no relationship between variables in a population when there truly is a relationship
When a hypothesis not true but is incorrectly accepted
possible causes of error:
measurement error
lack of power (participants)
treatment application wrong
Statistical Tests
Help us to determine associations or differences between groups;
are groups different from one another?
3 Types—Determined by # and nature of IV and DV:
Chi-Square
t-Test for Two Independent Groups
Dependent t-test for Paired Groups
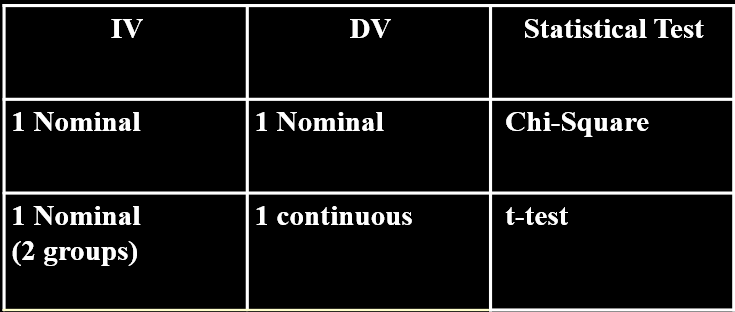
What Analysis Do I Use?
Chi-Square:
Independent Variable: 1 nominal
Dependent Variable: 1 nominal
T-Test:
Independent Variable: 1 nominal (2 groups)
Dependent Variable: 1 continuous
T-Test Assumptions
Normal Distribution from the sample
Samples are randomly selected
Samples have equal variance
Data must be interval or ratio (parametric)
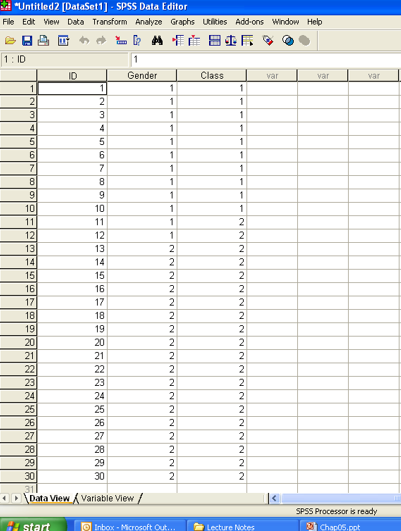
Chi Square Example
“Gender Nominal data.xls”
We want to find out if males and females enroll in aerobic dance and weight training classes equally
Purpose of the Chi Square statistic – determine if there is an association between levels of one or more nominally scaled variables
Steps:
Import data
Analyze—> Descriptive Statistics —> Crosstabs
Rows: Class ; Columns: Gender
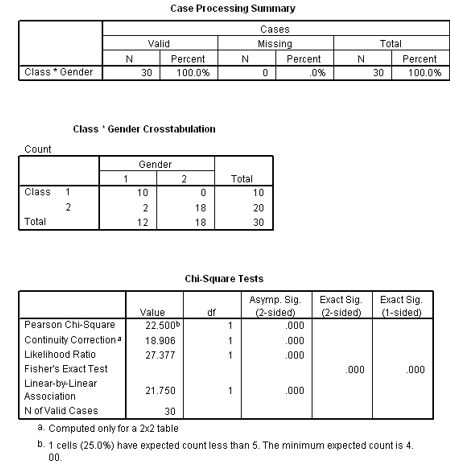
Click Chi Square—> Continue—> OK
Analysis:
Middle Box = general summary (Class Gender Crosstabulation)
Df=degrees of freedom
Asymp.sig = significance
Compare p-value with alpha level
in this case p< alpha
alpha: 0.05
p: 0.00
If p < alpha, reject the null hypothesis
if p > alpha, accept the null hypothesis
TLDR: there are gender differences in enrollment in these classes
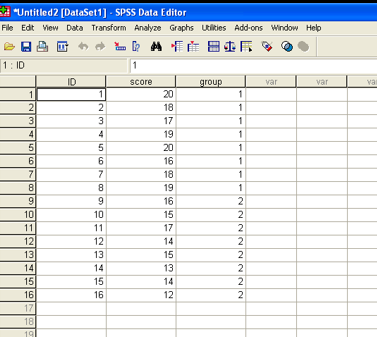
T-Test Example
“Ch. 5 Volleyball continuous data.xls”
We want to find out if there are serving accuracy differences between a junior varsity and varsity volleyball team
Purpose of the t-Test for 2 independent samples – examine the difference in 1 continuous variable between 2 (only 2) independent groups (not related)
Steps:
Import Data
Analyze—> Compare Means —> Independent Samples T Test
Test Variable: Score
Define Groups: Group 1=1 (JV =1) , Group 2 = 2 (Varsity = 2 )
Continue —> Define Groups —OK
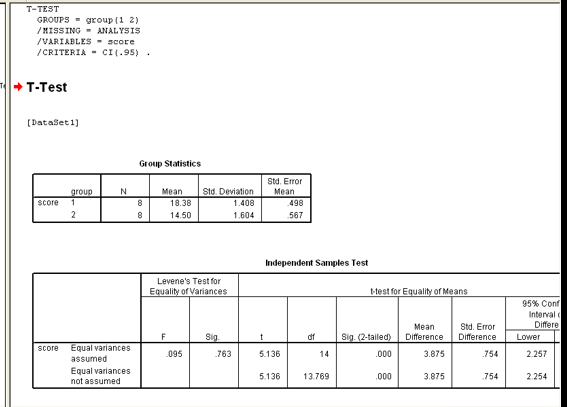
Analysis:
Sig = p value
Large: = 0.763
If p-value > 0.05, then Accept the null hypothesis (do not address the alternative)
If p-value < 0.05, then Reject the null hypothesis
Varsity is better than JV
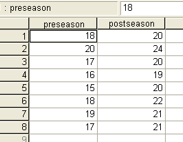
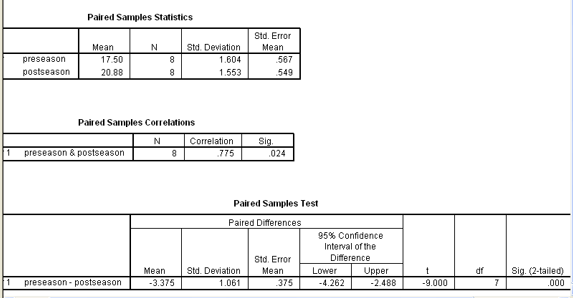
T-Test for Paired Groups Example
“Jump data.xls”
We want to find out if a jump training regimen is effective for basketball payers so we compare performance at the beginning and end of the season
Purpose of the t-Test for paired groups – compare 2 related groups on 1 dependent variable; comparing siblings, comparing a team at the beginning and end of the season
Steps:
Import Data
Analyze—>compare means—> paired samples T-test
Paired Variables: preseason and postseason
OK
Analysis:
strong correlation due to high significance (0.024)
Sig (2-tailed) = p-value
If p-value is < alpha, reject the null —- there is a significance