RP11 - Production of a dilution series of a glucose solution and use of colorimetric techniques to produce a calibration curve with which to identify the concentration of glucose in an unknown ‘urine’ sample.
1/4
There's no tags or description
Looks like no tags are added yet.
Name | Mastery | Learn | Test | Matching | Spaced | Call with Kai |
|---|
No analytics yet
Send a link to your students to track their progress
5 Terms
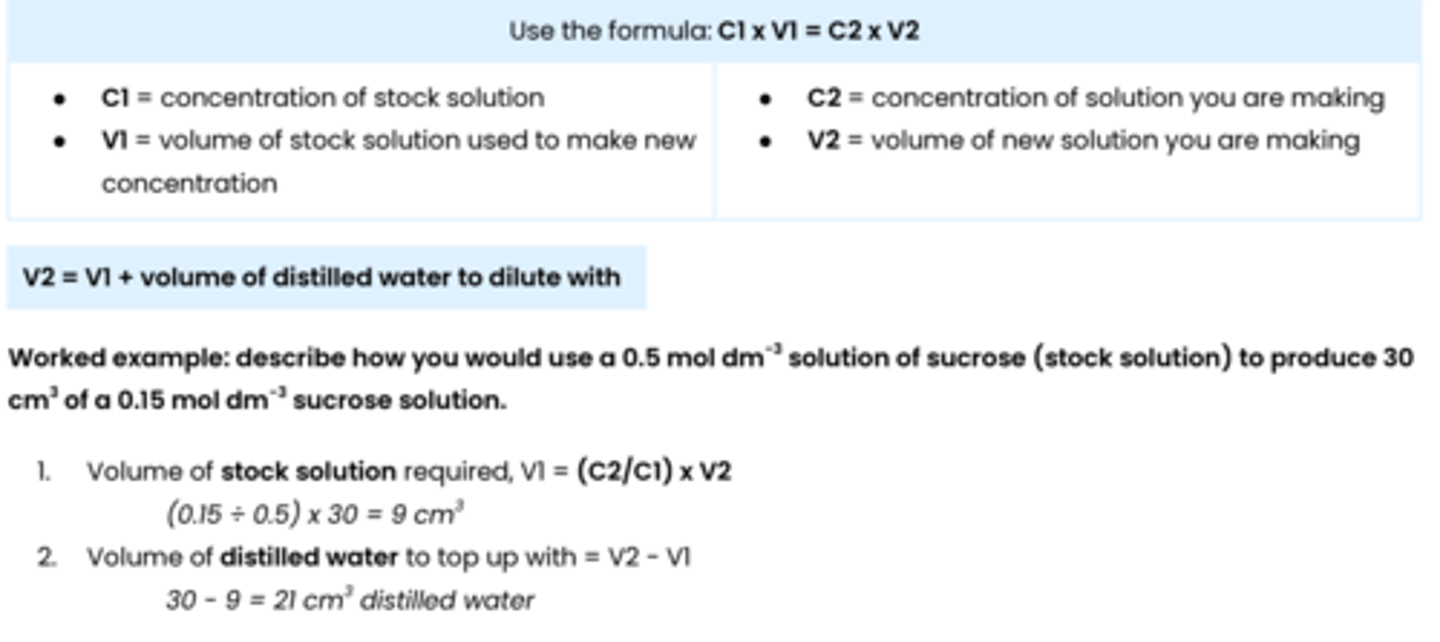
describe how to calculate dilutions
C1 X V1 = C2 X V2
V2 = V1 + volume of distilled water added to dilute

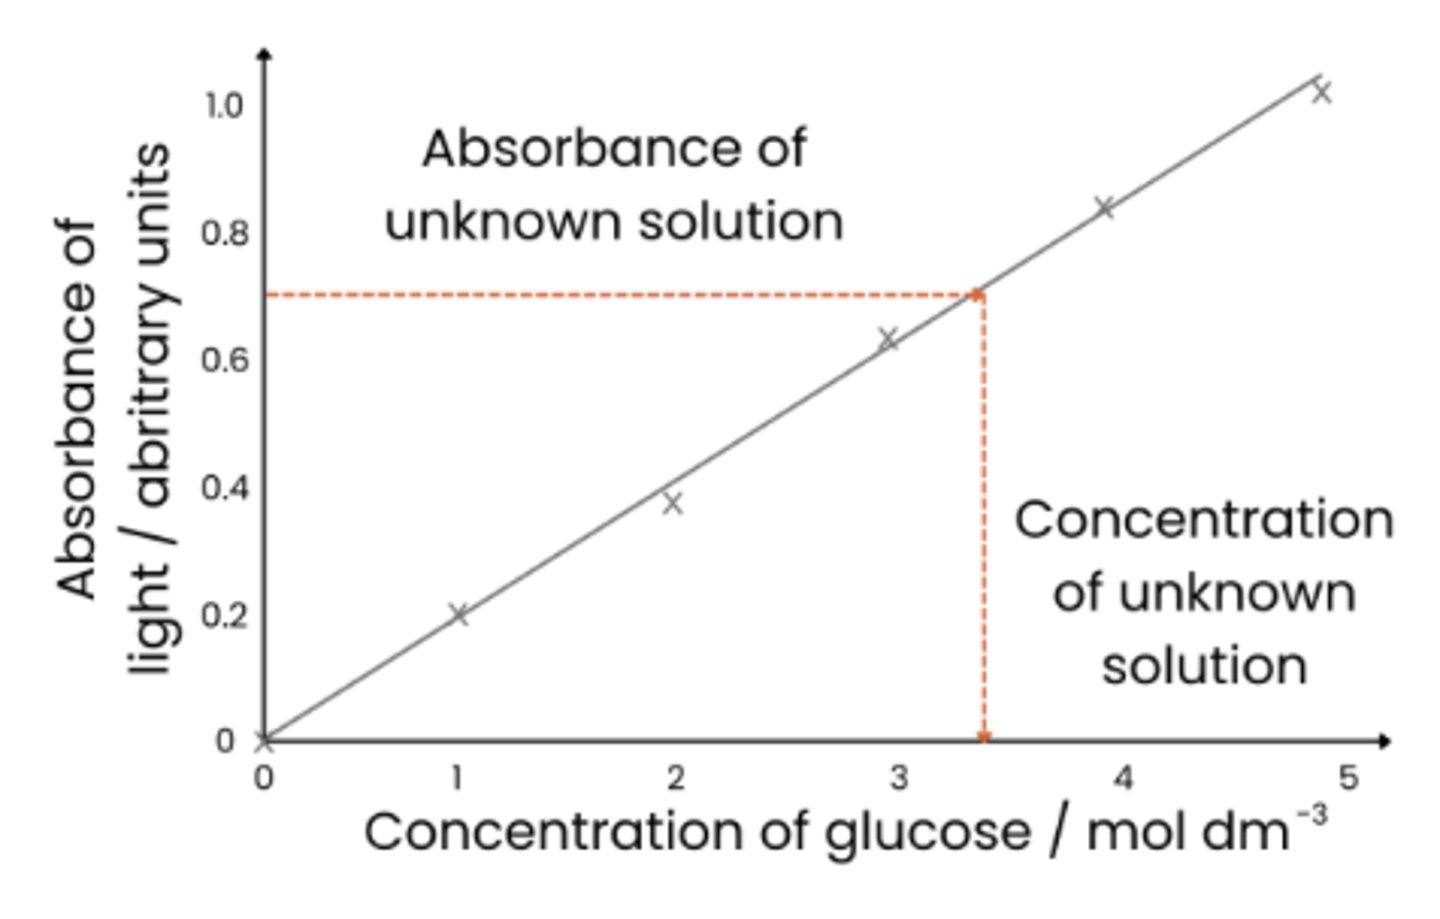
Describe how a calibration curve could be produced for glucose
1. Use distilled water and a glucose solution of known concentration to produce a dilution series (of glucose solutions of known concentrations)
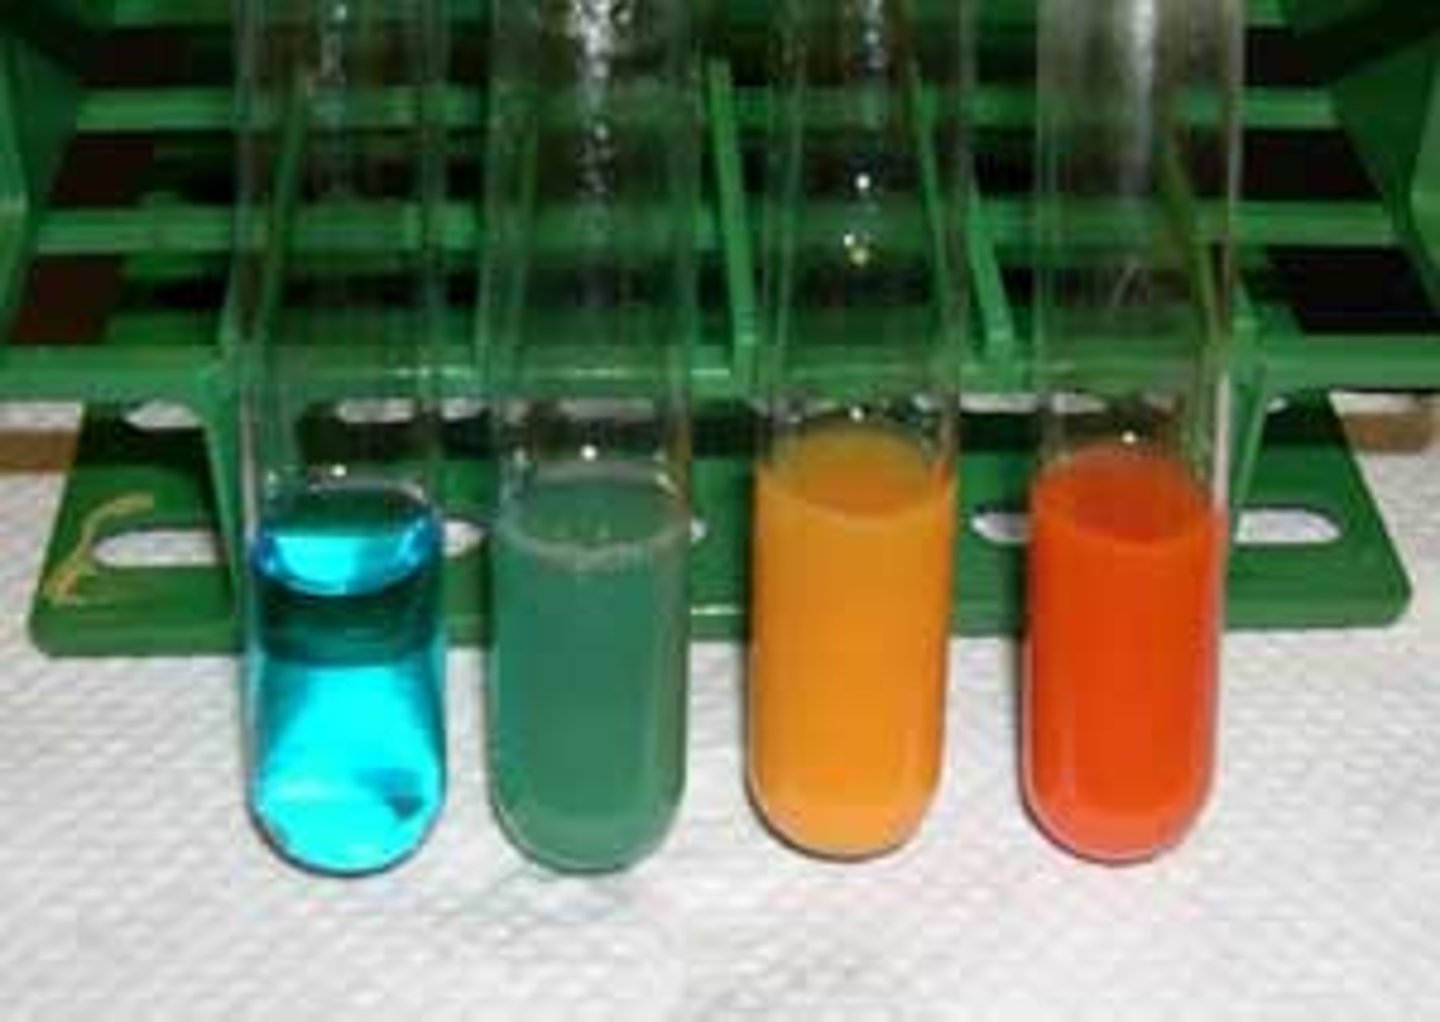
2. Heat a set volume of each solution with a set volume of Benedict's solution
3. Measure absorbance (of light) of each solution using a colorimeter
4. Plot a graph of absorbance (y axis) against concentration of glucose solution (x axis) and draw a line / curve of best fit

Describe how the concentration of glucose in an unknown 'urine' sample can be identified using a calibration curve
1. Perform Benedict's test on sample using same volumes of solutions used in producing calibration curve
2. Measure absorbance using a colorimeter
3. Absorbance value for 'urine' sample read off calibration curve to find associated glucose concentration

control variables
● Volume of sample used
● Volume of Benedict's solution
● Temperature of water bath
● Time samples were heated for in water bath
Explain why a high blood glucose concentration can cause glucose to be present in the urine of a diabetic person.
● Not all glucose reabsorbed at proximal convoluted tubule
● As glucose carrier / cotransporter proteins are saturated /
working at maximum rate
