Session 2: Descriptive Epidemiology
1/62
There's no tags or description
Looks like no tags are added yet.
Name | Mastery | Learn | Test | Matching | Spaced |
|---|
No study sessions yet.
63 Terms
Epidemiology
The study of the distribution and determinants of health-related events in specified populations, and the application of this study to control health problems
What does descriptive epidemiology tell us?
- What is the problem/frequency
- Who is affected
- Where is affected
- When does it occur
What does analytical epidemiology tell us?
Why it occurs in this specific population
Why is descriptive epidemiology important?
1. Evidence based medicine
2. Research - understanding
3. Clinicians = reports, audits, exams
Why is epidemiology important, specifically to qualifying doctors?
- Writing reports = Special Selected Components (SSCs)
- Audits (compulsory part of foundation training)
- Postgraduate exams
Types of data
Categorical (discrete) and continuous
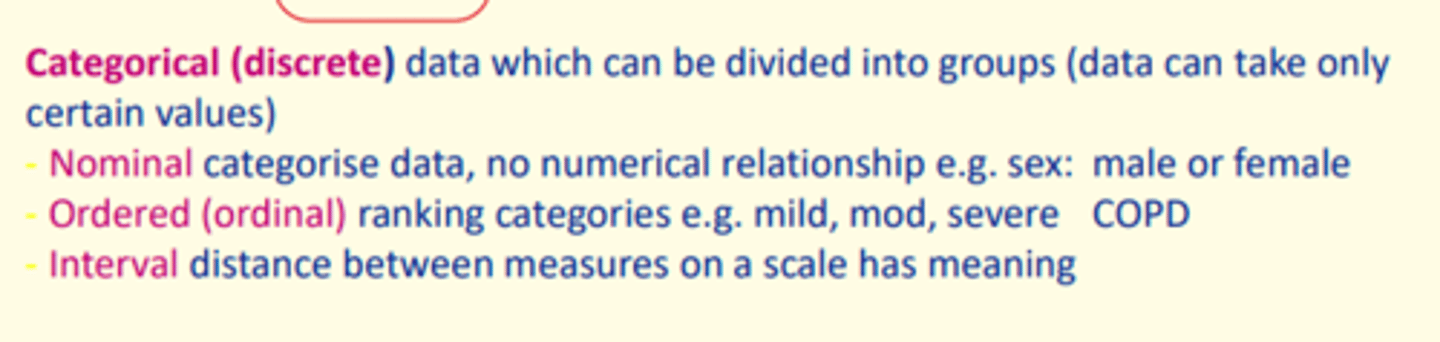
Categorical (discrete) data, with examples of this data
Data which can be divided into groups
Nominal e.g., male/female
Ordinal e.g., mild, moderate, severe
Interval e.g., distance between measures has meaning
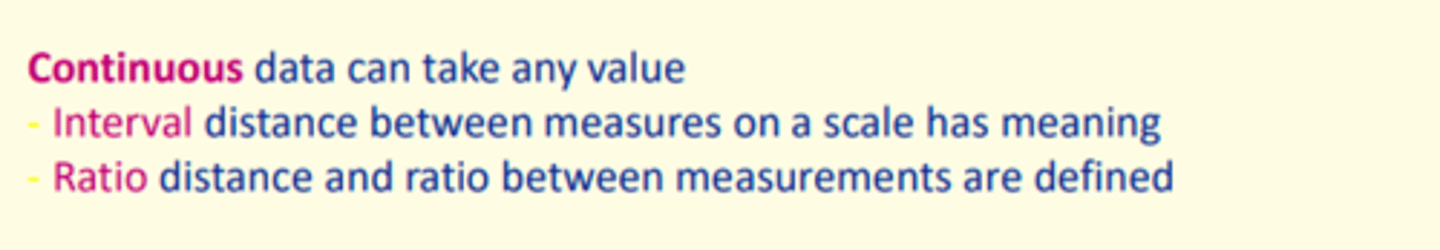
Continuous data, with examples
Continuous data can take on any value
Interval e.g., distance between measures on scale
Ratio e.g., distance/ratio between measurements defined
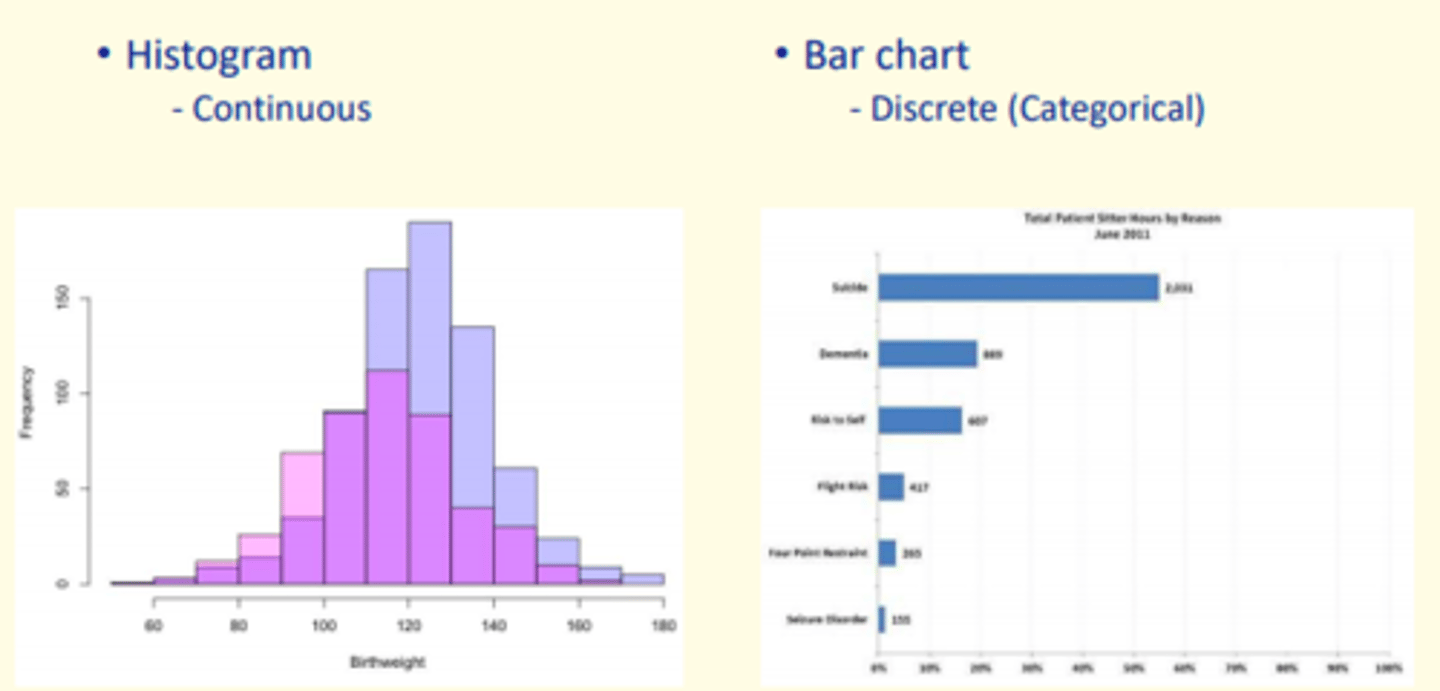
Example of a frequency distribution of continuous data
Histogram

Example of a frequency distribution of discrete (categorical) data
Bar chart
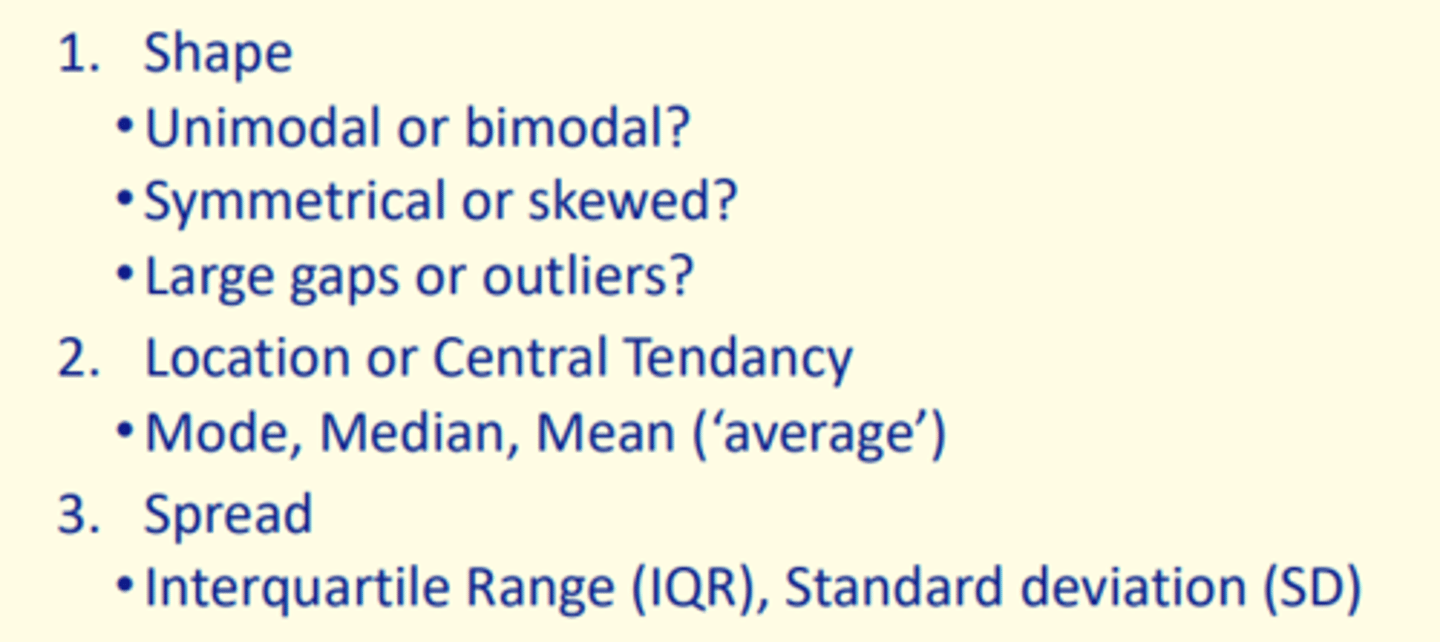
Three factors which summarise a frequency distribution
1) Shape
2) Location or central tendency
3) Spread
What shape is found in this histogram?
Unimodal
Skewed to the left
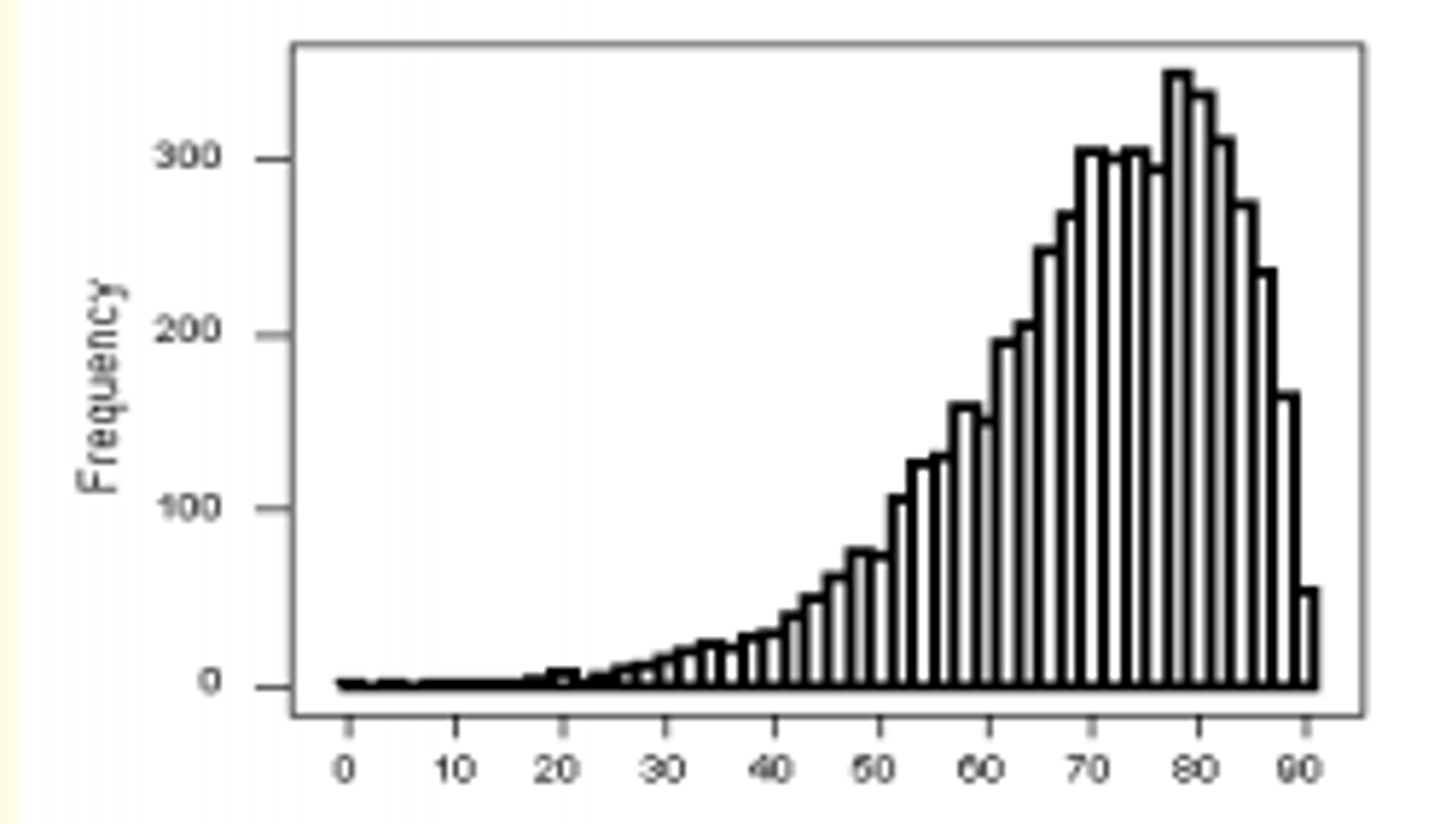
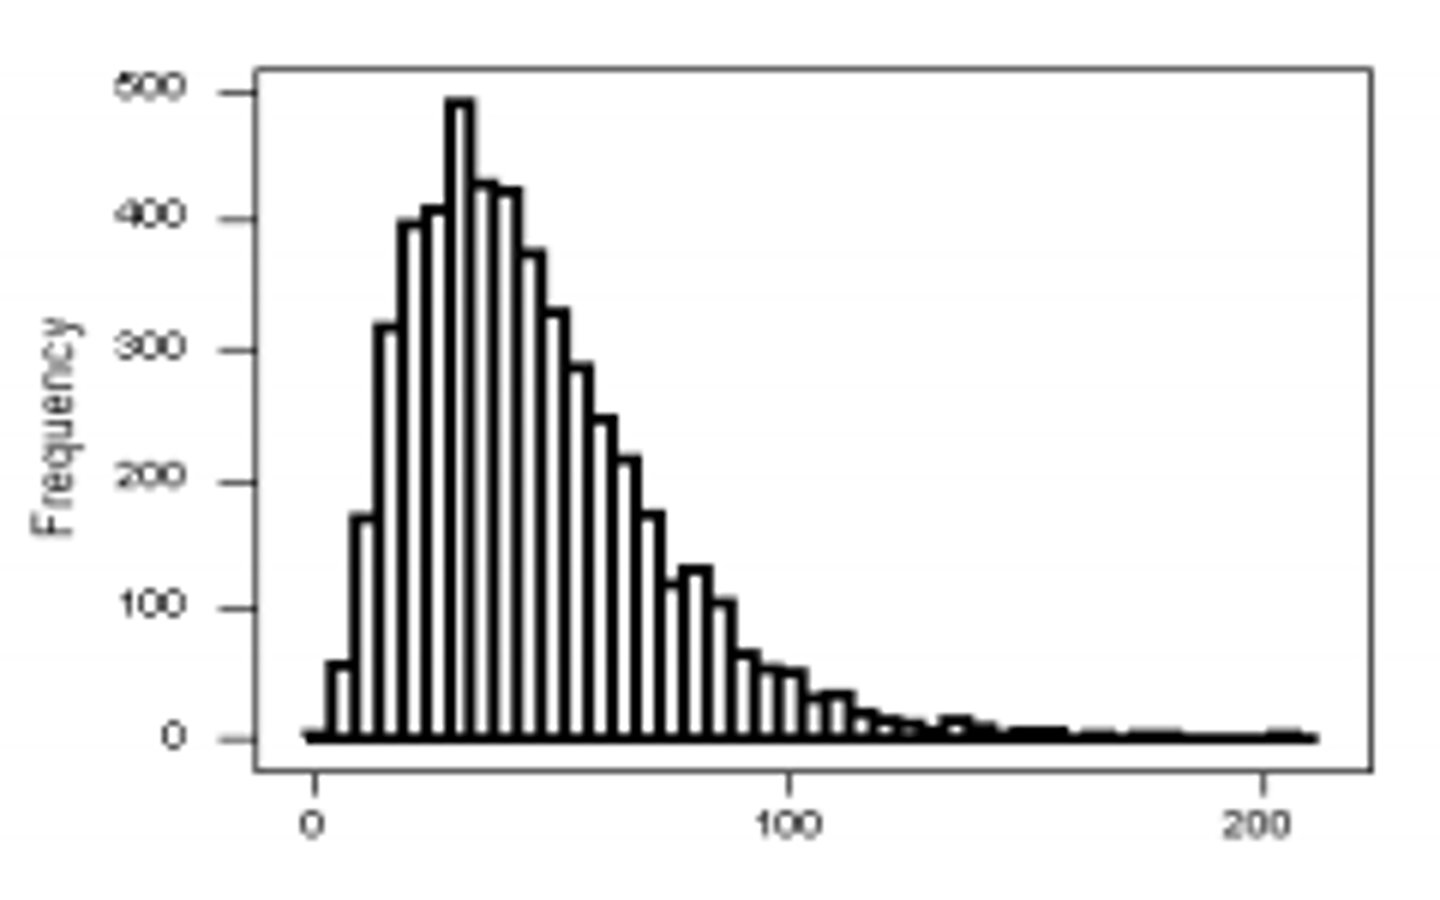
What shape is found in this histogram?
Unimodal
Skewed to the right

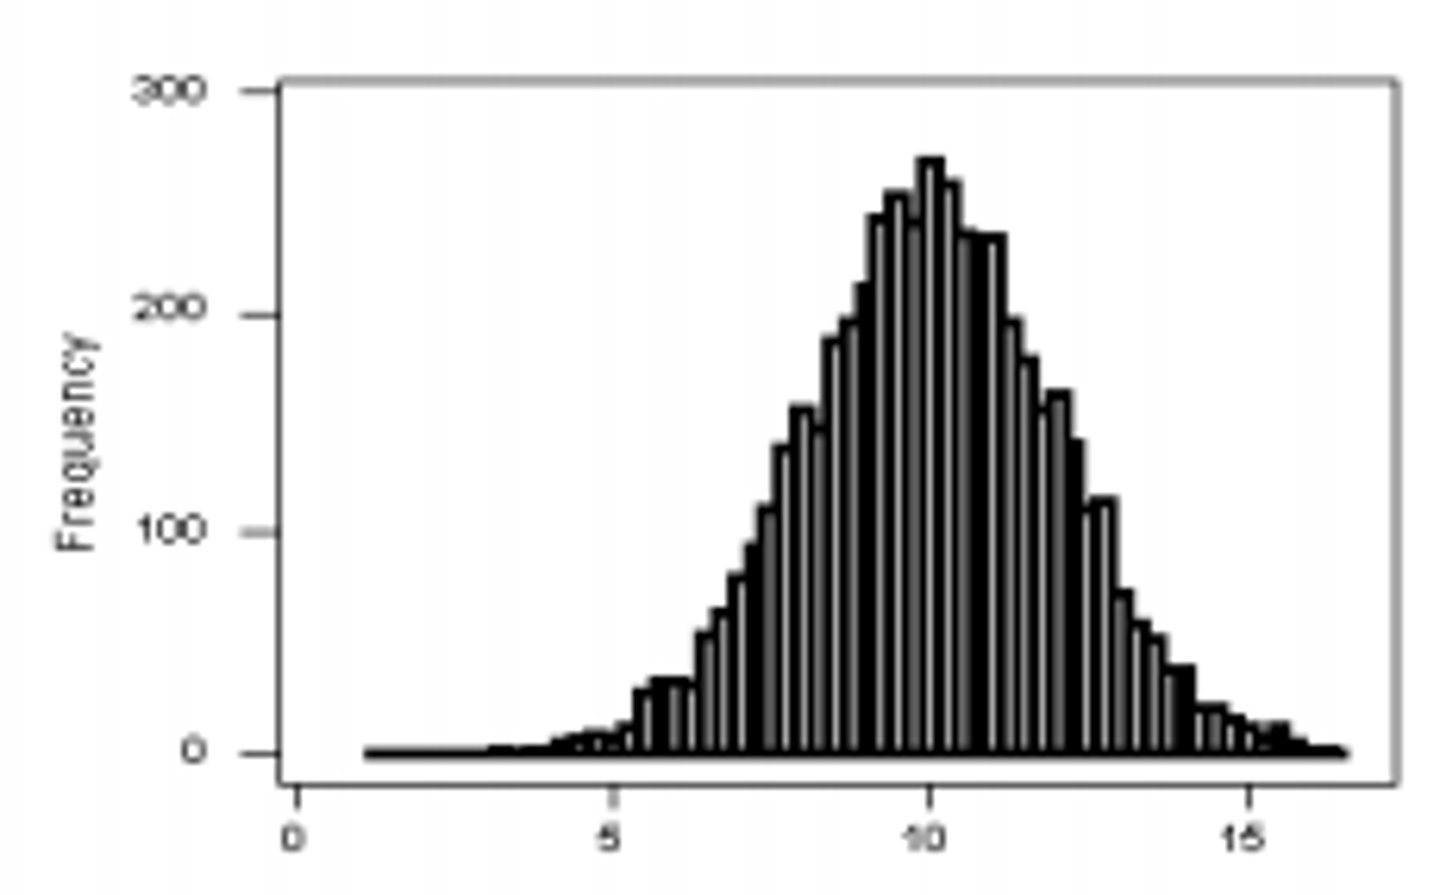
What shape is found in this histogram?
Unimodal: symmetrical
Normal distribution

Normal distribution
Symmetrical bell-shaped curve
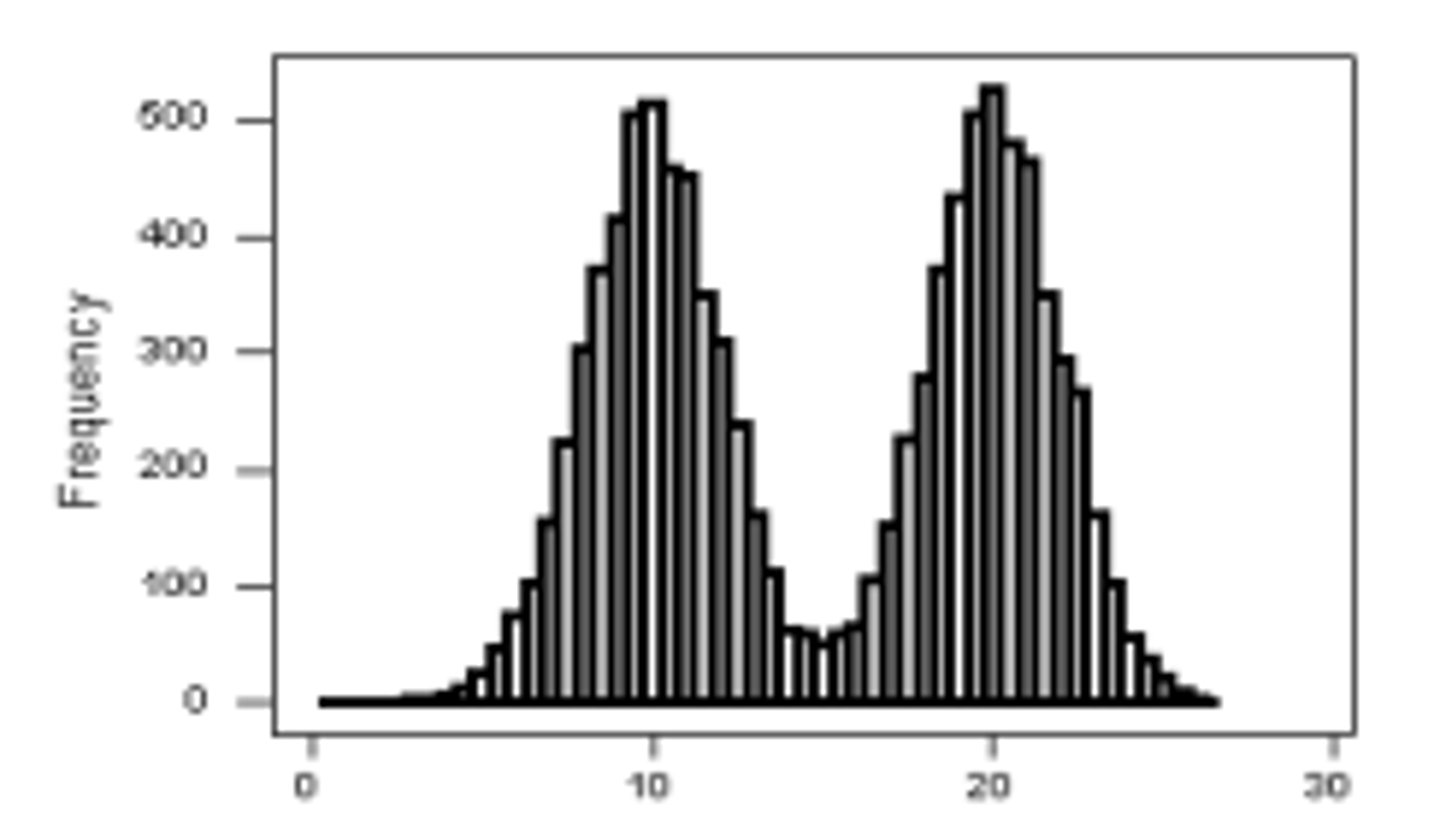
What shape is found in this histogram?
Bimodal: symmetrical
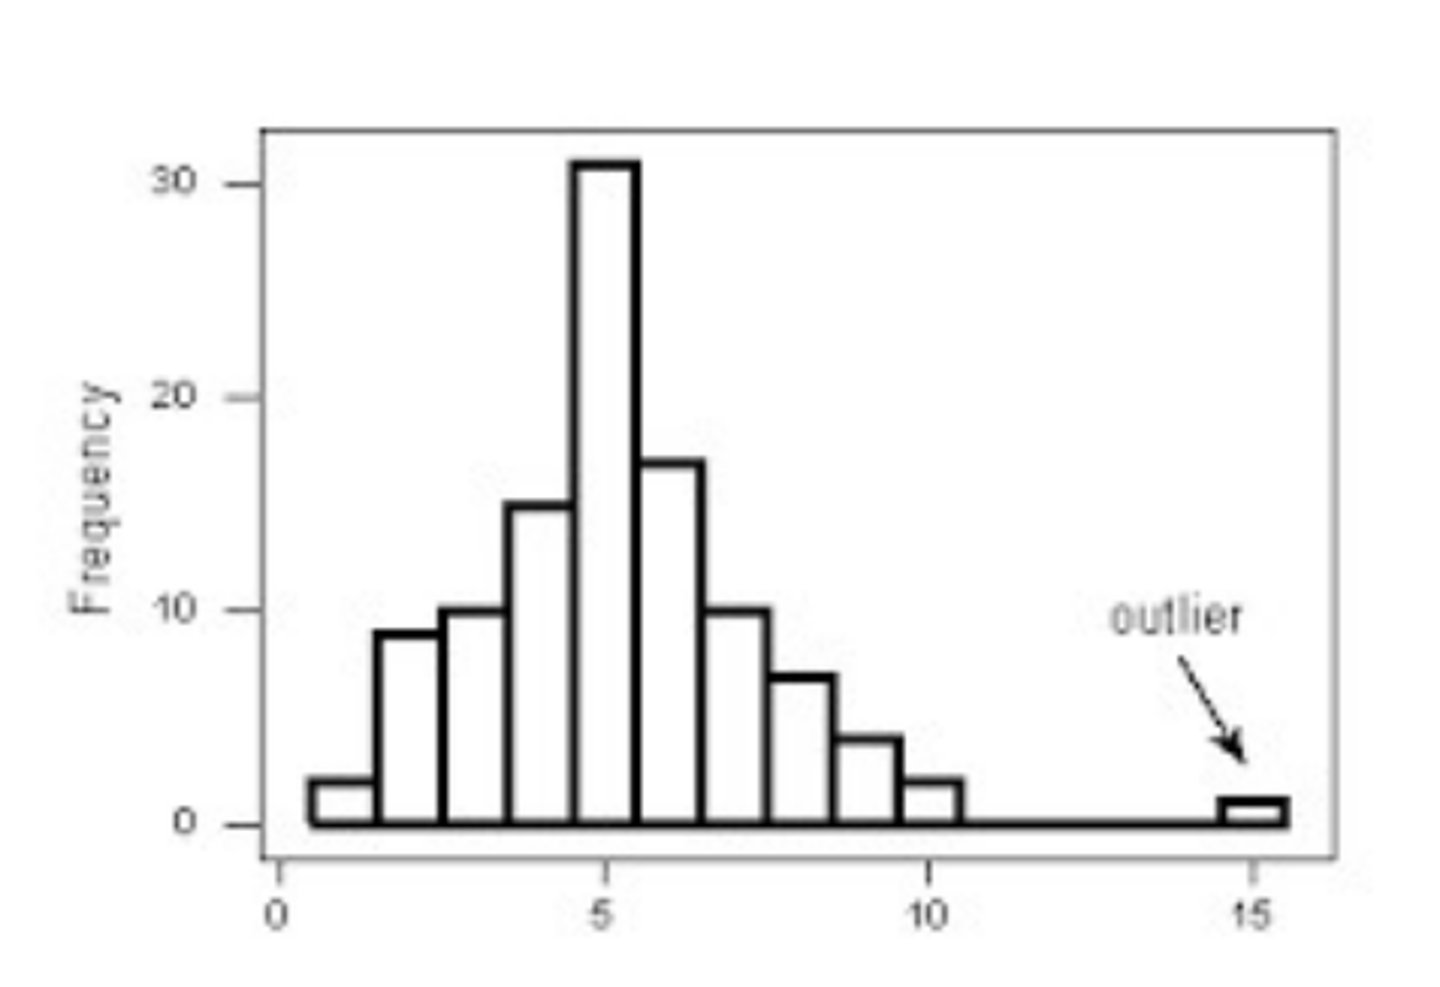
Causes of outliers
• Data entry errors
• Measurement errors
• Experimental errors
• Intentional
• Data processing errors
• Sampling errors
• Natural
Location or central tendency
Tell us about the focal point or central point of the data.
This includes the mean, median, and mode.
Mode
Value or group of values which occur most often
Median
Middle value after arranged in order of size (ascending order)
Mean
Arithmetic average of observations
Relationship of mean to median in a symmetrical distribution...
Mean ≈ Median
Relationship of mean to median in a skewed distribution (right)
Mean > median
Relationship of mean to median in a skewed distribution (left)
Mean < median

What is the mode of this frequency distribution
The most common score which was 66 (highest frequency)
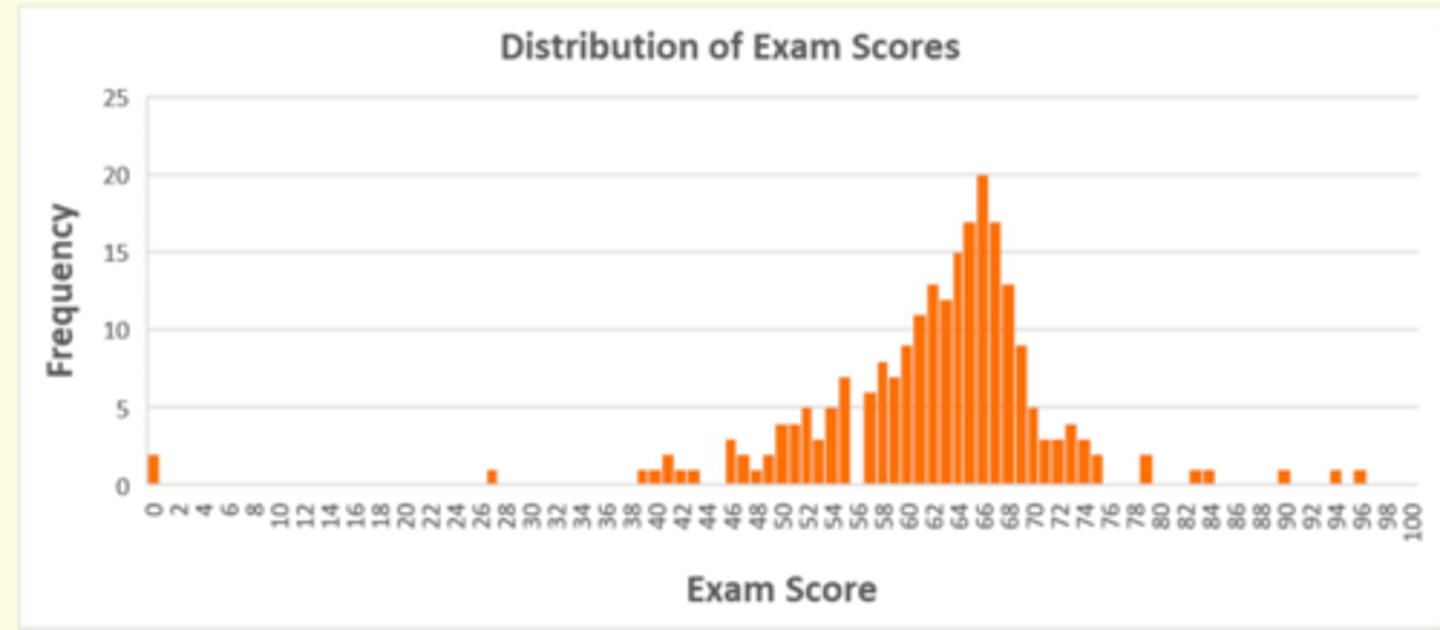
What is the median of this frequency distribution
Median = [Total number of participants + 1] / 2
n = 229
[(229 + 1)]/2 = 115th value = 64
![<p>Median = [Total number of participants + 1] / 2</p><p>n = 229</p><p>[(229 + 1)]/2 = 115th value = 64</p>](https://knowt-user-attachments.s3.amazonaws.com/4df72d03-5f68-4529-a890-bf17a8132335.png)
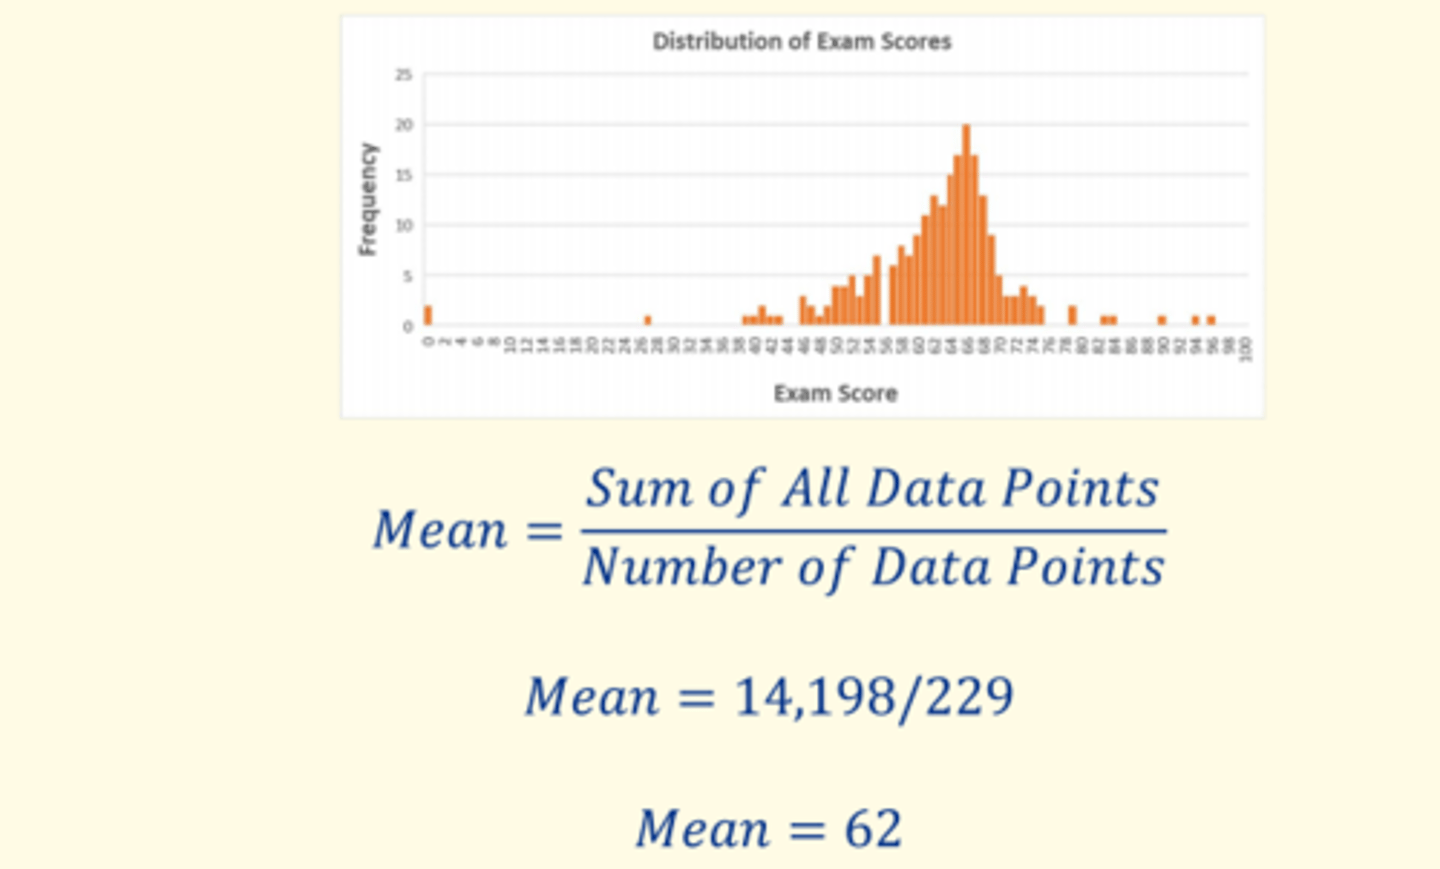
What is the mean of this frequency distribution
Mean = sum of all data points / number of data points
Mean = 14, 198 / 229 = 62
Two ways of assessing the spread of data in a frequency distribution
1) Range = difference between highest and lowest value
2) Interquartile range = difference between first and third quartile

Type of plot used to examine the spread of a frequency distribution
Box and Whisker plot
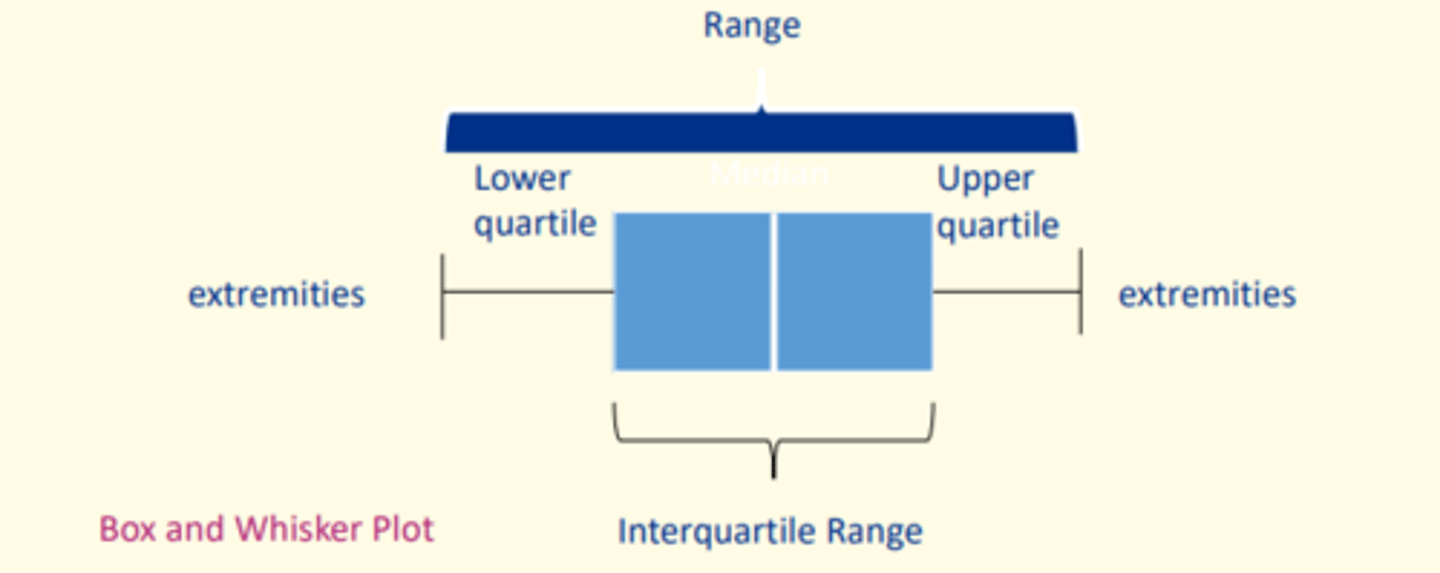
How to calculate the interquartile range
IQR = Q3 - Q1

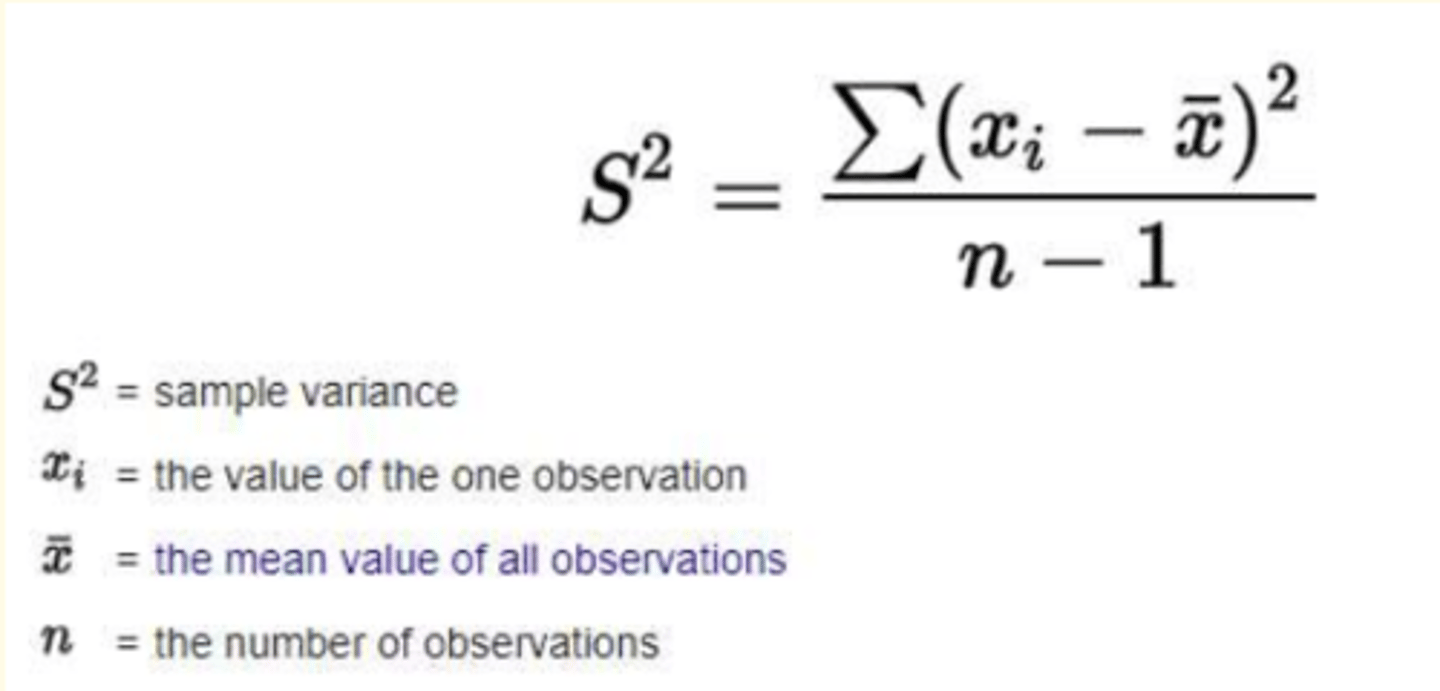
How to calculate variance (s^2) of a data set and what it means...
Variance is a measure of the variation shown by a set of observations, defined by the following formula
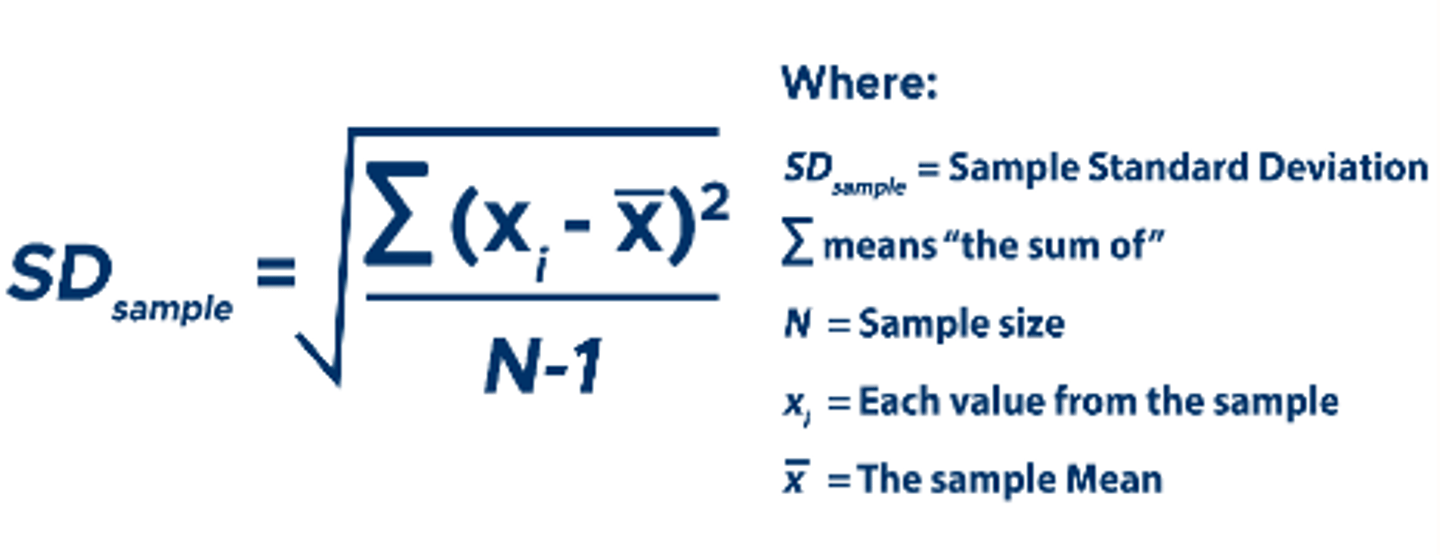
Standard deviation (s) formula and what it means...
Standard deviation (s) is a summary of how widely dispersed the values are around the mean, defined by the following formula
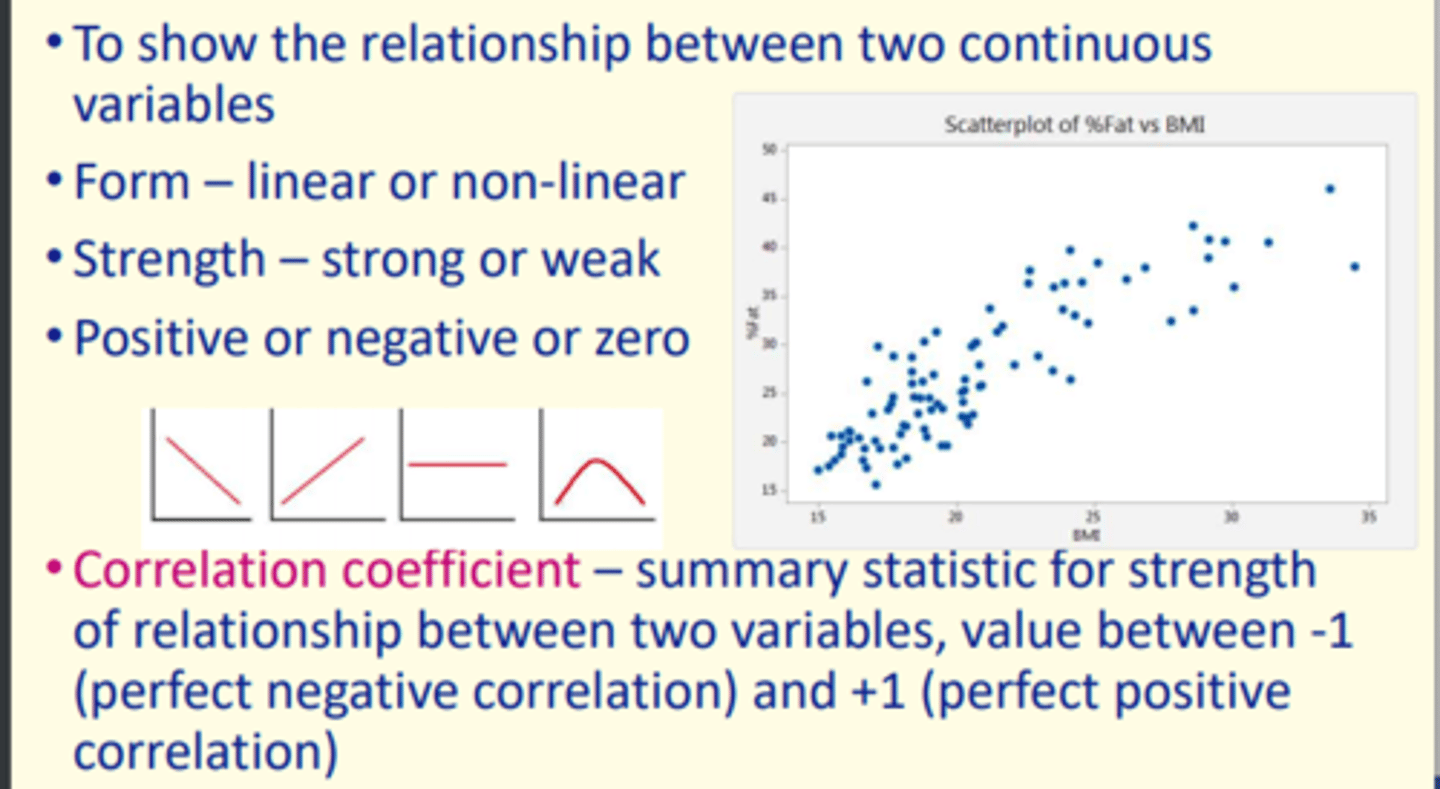
Why are scatter plots useful?
1) Show relationship between two continuous variables
2) Form = linear or non-linear
3) Strength = strong or weak
4) Positive or negative correlation (or zero)
Categorical data - examples of how it can be presented and what it shows
How it can be presented
Frequency table
Bar chart
Pie chart
What it shows
Percentages
Modal (most frequent)
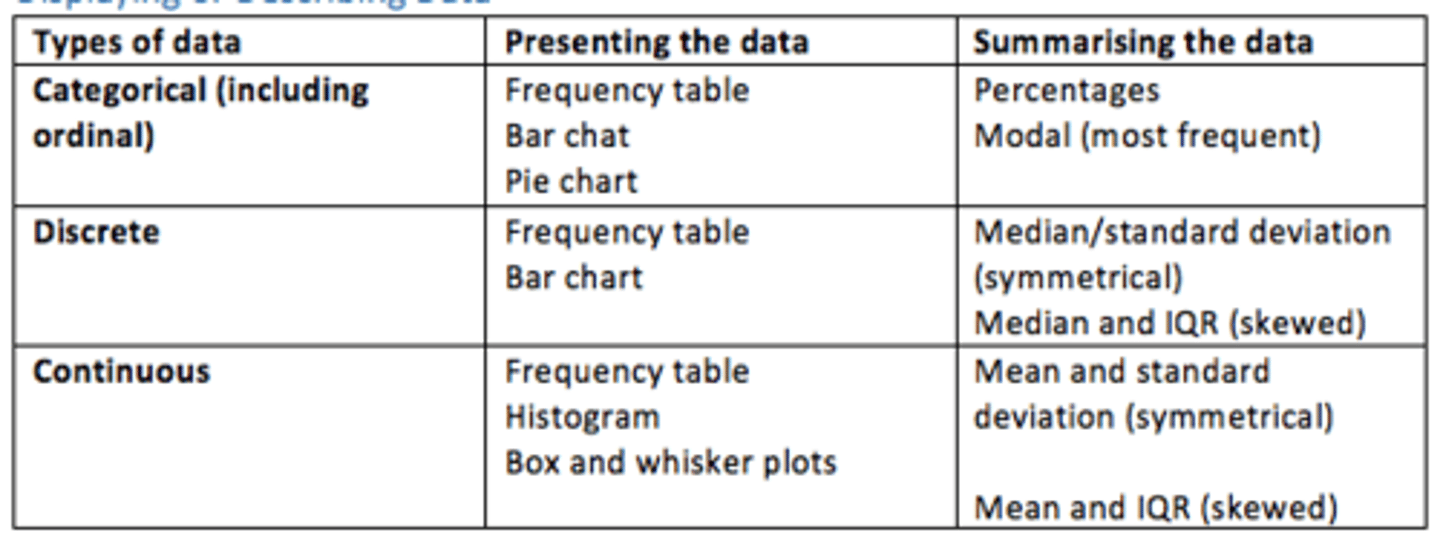
Discrete data - examples of how it can be presented and what it shows
How it can be presented
Frequency table
Bar chart
What it shows
Median, SD (symmetrical)
Median and IQR (skewed)

Continuous data - examples of how it can be presented and what it shows
How it can be presented
Frequency table
Histogram
Box and whisker plot
What it shows
Mean and SD (symmetrical)
Mean and IQR (skewed)

Categorical data - examples of how it can be presented and what it shows
How it can be presented
Frequency table
Bar chart
Pie chart
What it shows
Percentages
Modal

Some examples of measures of frequency
Ratio = division of two unrelated numbers
Proportion = division of two related numbers
Rate = measure of frequency of occurrence 'per unit time'
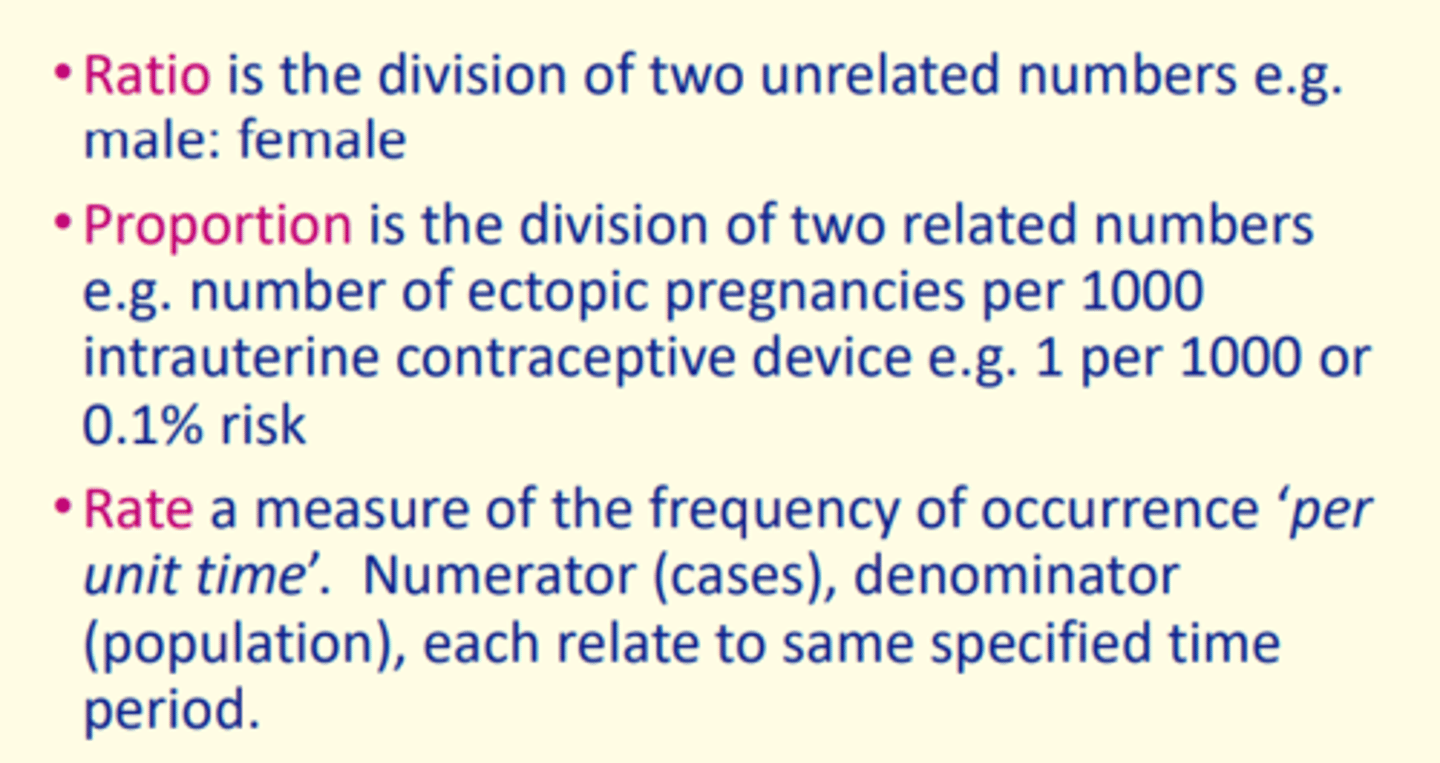
Ratio
Division of two unrelated numbers
Proportion
Division of two related numbers
Rate
Measure of frequency of occurrence 'per unit time'
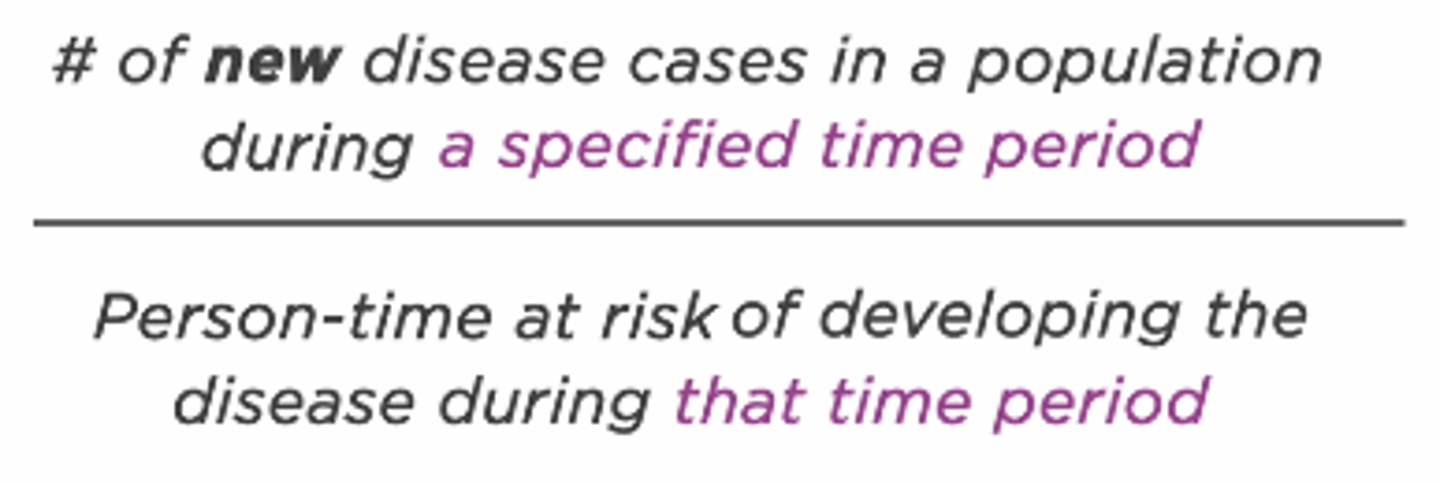
What is incidence?
The number of new events e.g., new cases of disease in defined population within specific period of time
What is prevalence?
The number of cases of disease in a given population at a designated time
Incidence rate
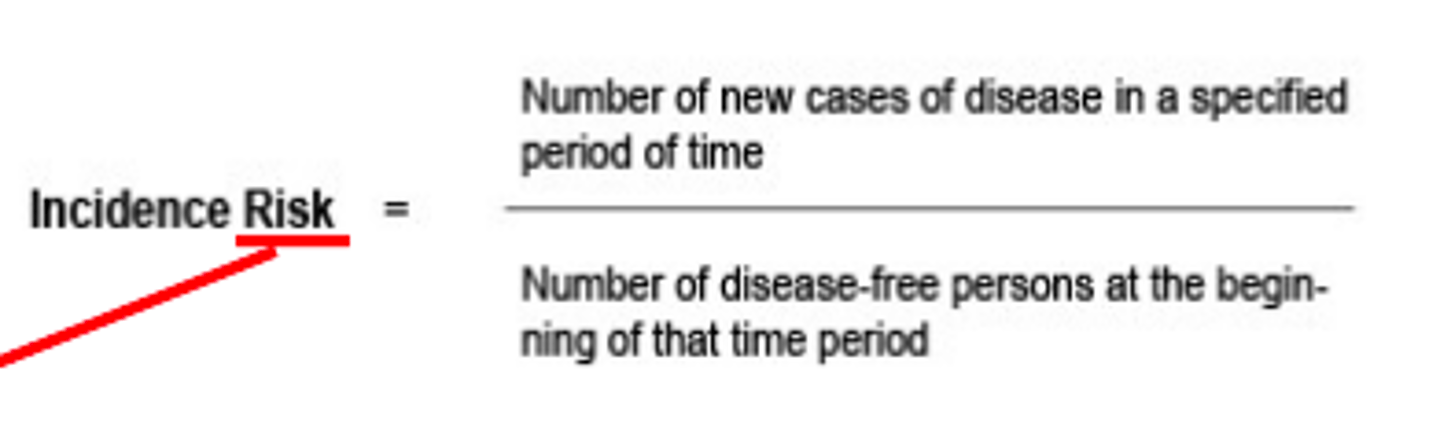
Incidence risk
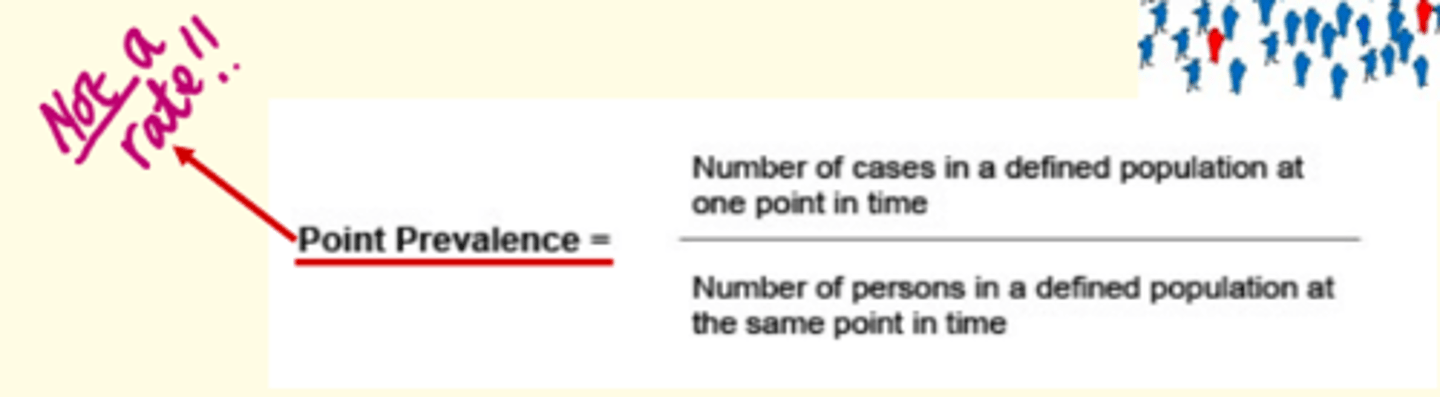
Point prevalence
Point prevalence is a variation which represents the number of persons who were a case at any time during a specified (short) period as a proportion of the total number of persons in that population
Why might the prevalence of a condition change over time?
1) Chance
2) Ascertainment
3) Demography
4) Treatment effects
5) True changes in prevalence
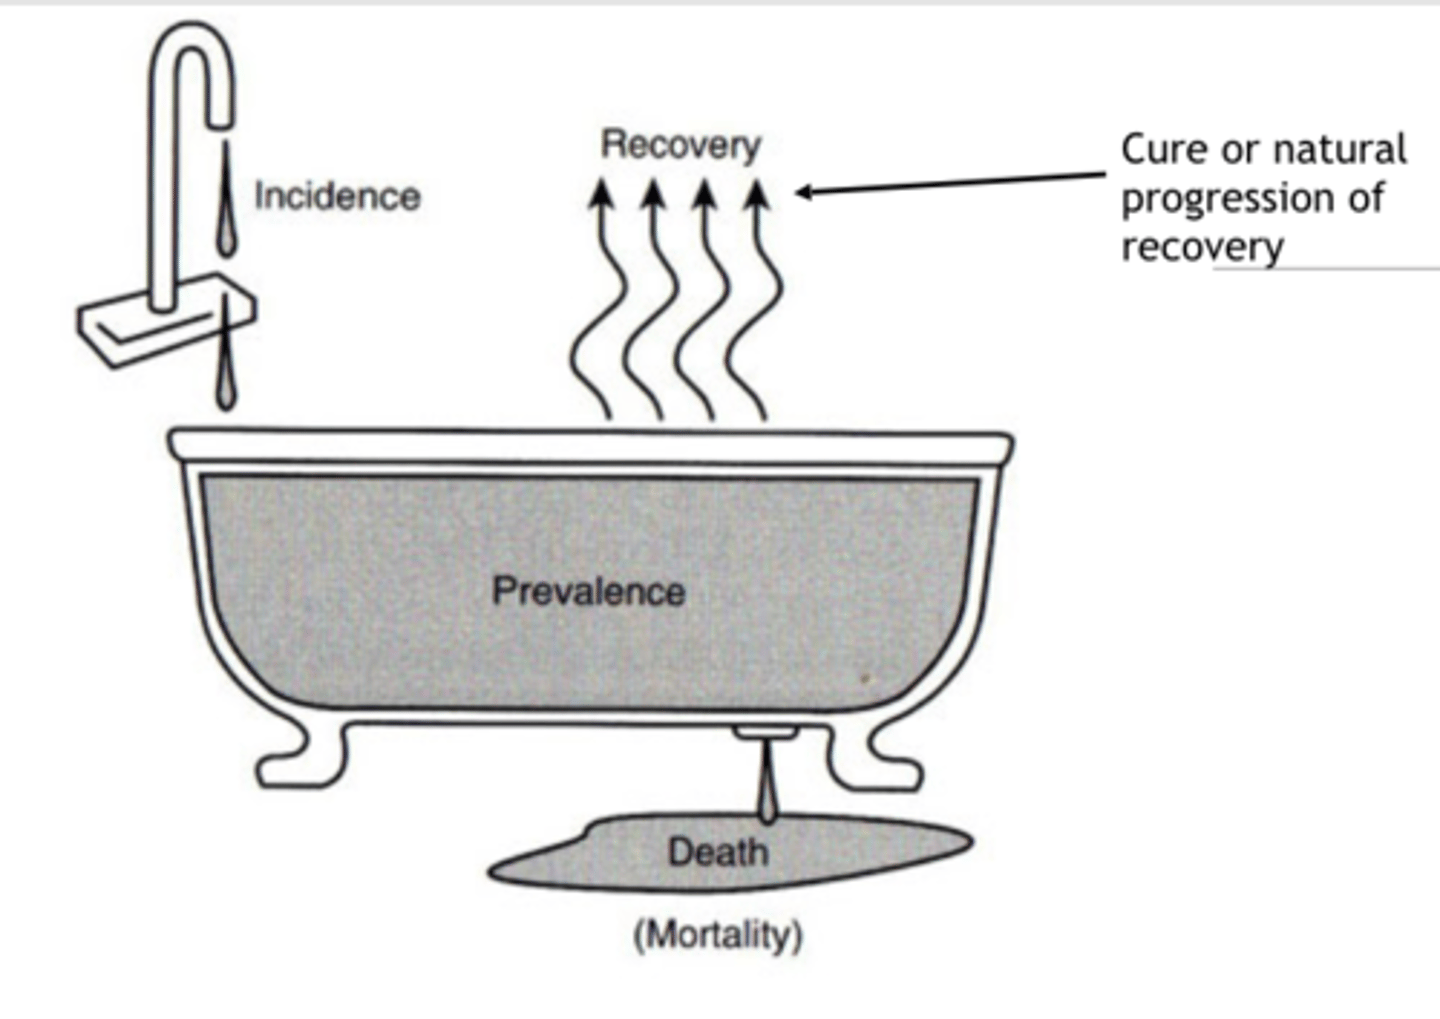
Epidemiologist's Bathtub
Relationship between incidence, prevalence, and mortality
Prevalence = (incidence rate) x (average duration of disease)
Incidence = prevalence / duration
Duration = prevalence / incidence
Mortality rate is an example of an ___ rate
Incidence
Three measures of mortality
1) Infant Mortality Rate (IMR)
2) Crude Death Rate (CDR)
3) Age-Specific Death Rate (ASDR)

Infant Mortality Rate (IMR)
A figure that describes the number of babies that die within the first year of their lives in a given population.
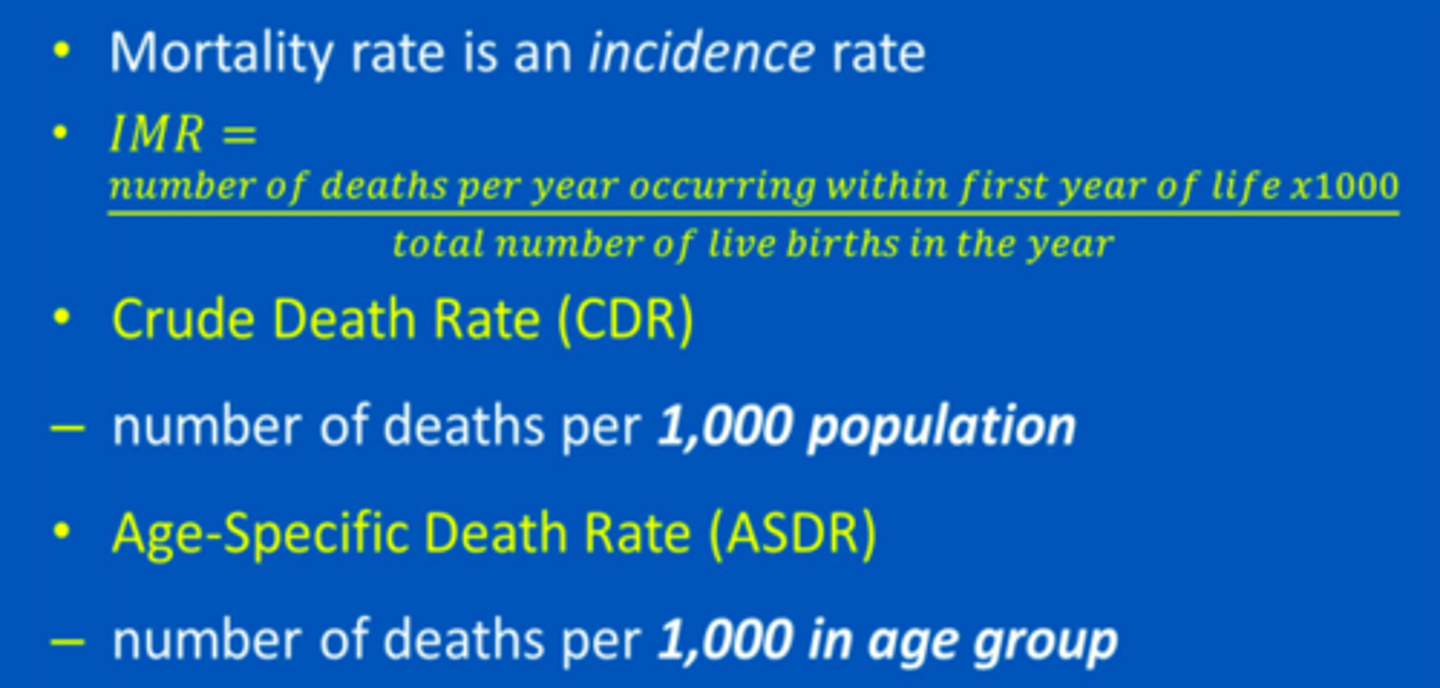
Crude Death Rate (CDR)
The total number of deaths in a year for every 1,000 people alive in the society.

Age-Specific Death Rate (ASDR)
The number of deaths to persons in a specific age group per 1,000 persons in that age group

Risk
Probability or likelihood of an outcome
Association
Correlation between exposure and outcome
The strength of an association between a putative Risk Factor and an outcome can be measured in terms of...
- Relative risk (RR)
- Odds ratio (OR)
- Attributable risk (AR)
- Population attributable risk (PAR)
- PAR%
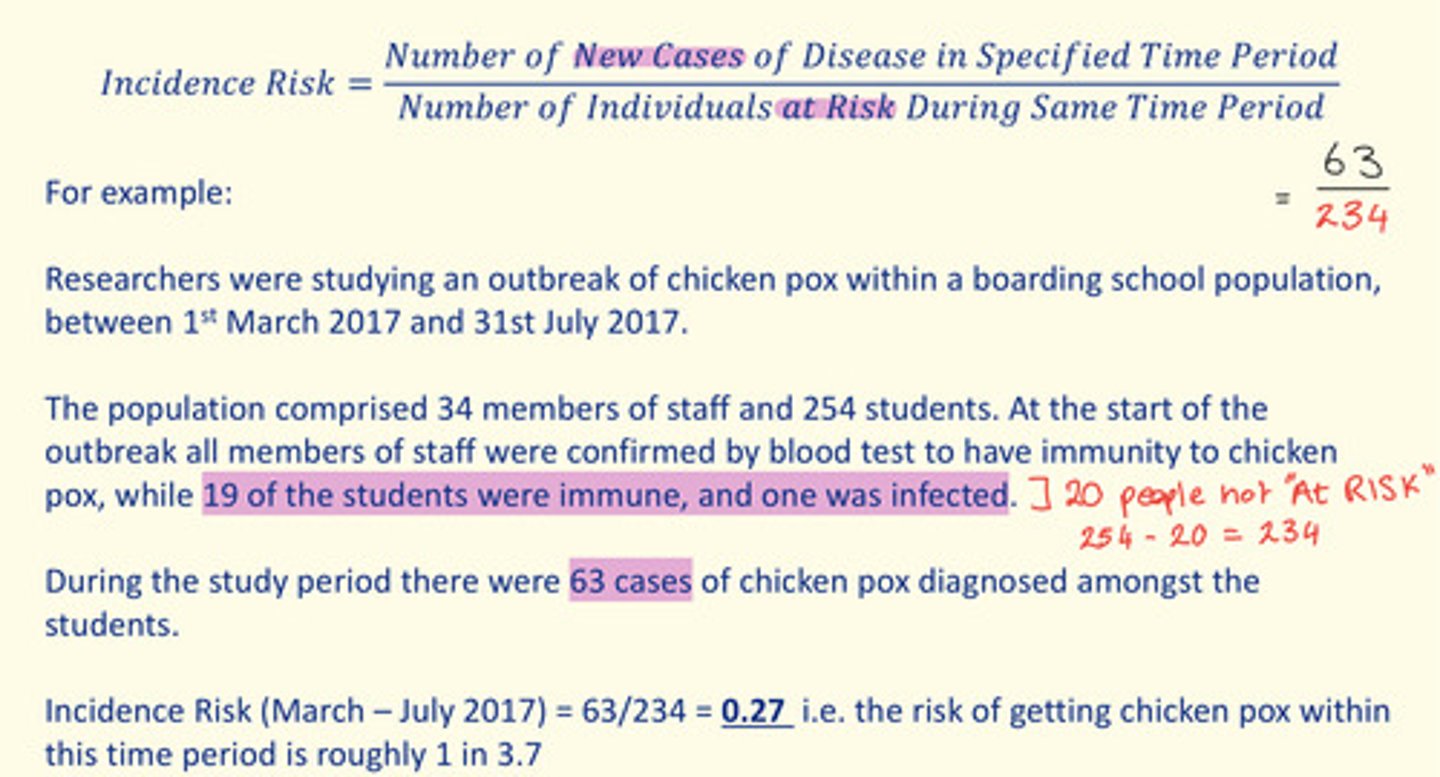
Measures of Absolute Risk
Incidence Risk (IR) =
number of new cases of disease in specified time period / number of individuals at risk during same time period
Measures of Relative Risk
Risk Ratio (RR) =
A comparison of the risk of some health-related event such as disease or death in two groups.
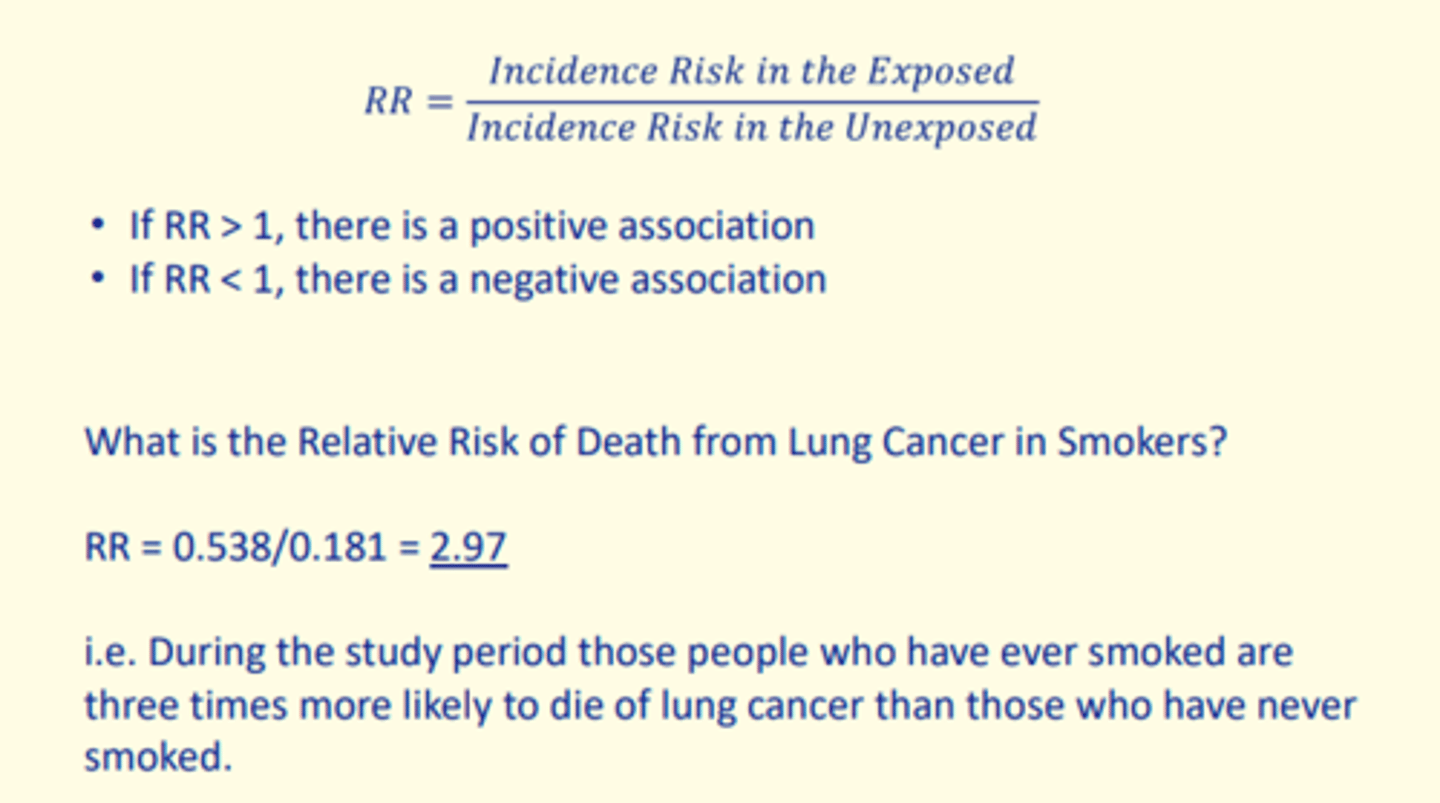
Risk ratio (RR) > 1
Positive association
Risk ratio (RR) < 1
Negative association
Epidemiology is the science which informs ___ ___
Public health
Incidence is defined as...
Measure of new cases or events in a population within specified time
Prevalence is defined as...
Measure of the burden of disease in a specified population at a particular time (this is not a rate!)