Chi-squared Analysis
1/6
There's no tags or description
Looks like no tags are added yet.
Name | Mastery | Learn | Test | Matching | Spaced |
|---|
No study sessions yet.
7 Terms
What is contingency table
Examines the question of whether 2 categories of classification are independent of each other
If they are independent, what frequency would we expect in each of the cells
What is a chi-squared test
evaluates relationships between two nominal or ordinal variables (similar to a correlation analysis)
Compares tallies/counts of categorical responses between 2 (or more) independent groups
Can only be used on actual numbers and NOT %%, proportions, or means
Significant results tells you the data is “contingent” on the category in the margin
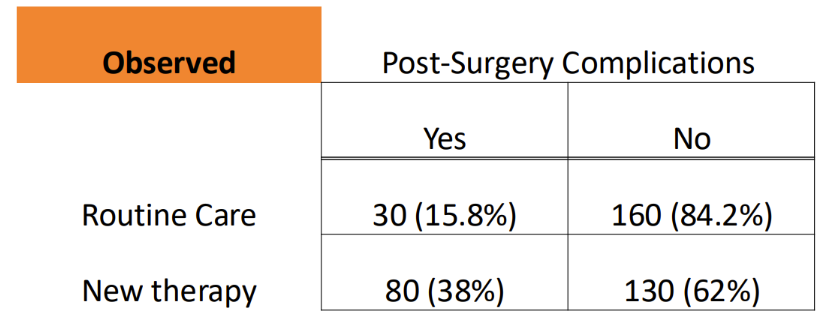
Looks at how different the observed frequencies are from the expected frequencies (p-value)
What is a Fisher exact test
Alternative Chi-square test to use when there are few counts
If the frequencies/counts are less than 5
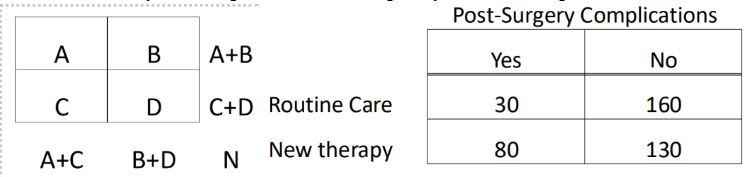
How do you calculate the expected frequencies of a contingency table
If the null is true (expected) =
You add the total of the column, and divide it by the total collected sample => to get the expected frequencies
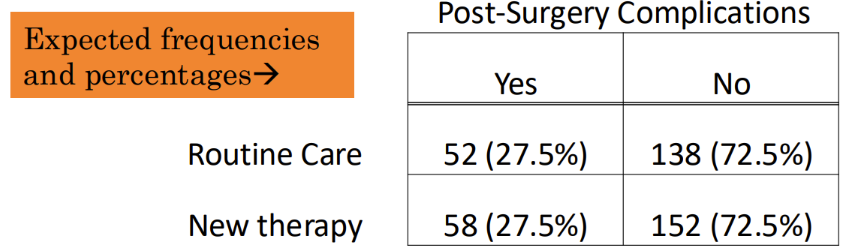
110/400 = 27.5%
(160+130)/400 = 72.5%
If the null is true, we expect 27.5% (110/400 patients – 400 patients total from both groups) of the routine and new therapy group patients.
190*(0.275) = 52 patients with complications from routine care
190 = 30+160 (row of routine care)
210*(0.275) = 58 patients with complications from new therapy
210 = 80+30 (row of new therapy)
How does Chi-squared compare the observed frequencies to the expected frequencies
Compare Chi-squared statistic to a critical value to determine the p-value (will NOT be given a p-value when calculating it by hand – only a critical value)
Significant p-value = difference is NOT due to chance
X^2 > critical value => SIGNIFICANT DIFFERENCE
P < 0.05
therefore
Reject the null
* doesn’t tell you HOW strong the relationship is, only that there is one
X^2 < critical value => no significant difference
P > 0.05
Therefore
Fail to reject the null
How is Chi-squared interpreted for statistical significance
Null = there is no relationship between variable A (studying) and variable B (passing)
Alternative = there is a relationship between variable A and variable B
CORRELATION DOES NOT imply causation
X^2 > critical value => SIGNIFICANT DIFFERENCE
P < 0.05
therefore
Reject the null
* doesn’t tell you HOW strong the relationship is, only that there is one
X^2 < critical value => no significant difference
P > 0.05
Therefore
Fail to reject the null
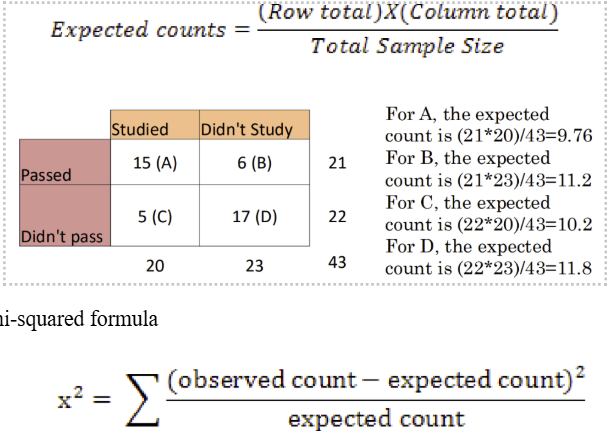
How do you calculate Chi-squared by hand?
Steps:
Calculate expected counts (the frequency/number of subjects in given category if there was NO relationship between variables)
Use the Chi-squared formula
For each cell (A-D), calculate the difference between expected and observed
Square it
Divide by expected count for the given cell (A-D)
Add all the values (A-D) together and get the Chi-square statistic
Compare Chi-squared to the critical value