Chapter 1 - Key Science Skills
1/117
Earn XP
Description and Tags
Chapter 1B-1G
Name | Mastery | Learn | Test | Matching | Spaced |
|---|
No study sessions yet.
118 Terms
What is a controlled experiment?
establishes a cause-and-effect relationship by testing how the independent variable (IV) affects the dependent variable (DV).
Extraneous variables
Extraneous variables are additional factors that can affect the measured data. For example, in a study about whether studying more leads to higher grades, extraneous variables could include natural intelligence, your teacher, or sleep.
What are qualitative and quantitative data, and how are they used together?
Qualitative data includes descriptive, written observations, while quantitative data consists of numerical values. When combined, they create a mixed-method design, allowing for both numerical and written forms of research in one study.
Quantitative data
Quantitative data consists of numerical values.
Mixed-method design
is an experiment that incorporates both numerical data and written commentary.
Case studies
are detailed studies that do not include experimentation and often have very small sample sizes. A weakness is that their findings cannot be generalized.
What are observational studies (fieldwork)?
involve observing people in their natural environment. A strength is that the data may be more accurate, but a weakness is that assumptions can easily be made.
Correlation studies
involve observing the relationship between two variables to determine if they are related.
Literature review
involves using secondary data to gather research for comparison before conducting primary data investigations.
Modeling/simulation
involves using a small or large prototype to understand and investigate an object or concept.
Product, process, or system development
It involves designing and developing something using technological applications.
Classification and identification
involve organizing things into similar sets based on shared characteristics.
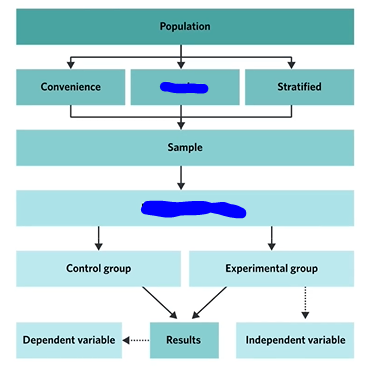
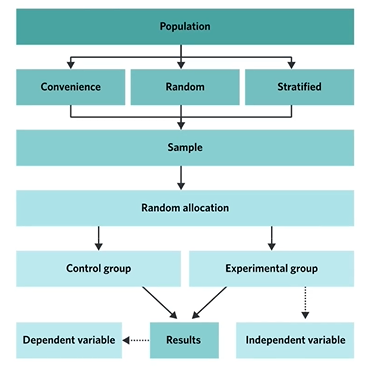
Population
the group that is the focus of study and which the sample is drawn from
Sample
a subset of the research population who participate in a study
Convenience Sampling
Increasing sample size advantage and disadvantage
It increases accuracy but also affects time and cost.
Can experiments have more than one control group
Controlled variables
things that are controlled and kept the same in an experiment.
The Hawthorne Effect/The Placebo Effect
The placebo effect is improvement due to belief in a treatment, and the Hawthorne effect is behavior change from being observed.
What is the one thing that should be different between the experimental and controlled group?
The IV
What forms can extraneous variables take? Name 5.
Non standardised instructions
individual participant differences
Order effects
Experimenter effects
Placebo Effects
What is the description, advantage, and limitation of a between-subjects design (random allocation)?
Description: Every member of the sample is randomly allocated to either the control or experimental group.
Advantage: Cost and time efficient.
Limitation: There may be individual participant differences.
What is the description, advantage, and limitation of a between-subjects design (paired allocation)?
Description: Each member of the sample is paired based on a particular characteristic, and one member of each pair is randomly allocated to the control and the other to the experimental group.
Advantage: Few individual participant differences between the groups.
Limitation: Time-consuming, as a pre-test is involved.
What is the description, advantage, and limitation of a within-subjects design?
Description: Each member of the sample is involved in both the control and experimental conditions.
Advantage: No participant differences.
Limitation: Order effects.
Confounding variables
are external factors that interfere with the relationship between the independent and dependent variables.
Personal Errors
Mainly a individual error of the researcher, for instance an experimenter effect
Random Errors
like an extraneous variables, something we didn’t control for and are unpredictable
Systematic Errors
as in the case of confounding variables they are errors in measurements that are all consistently shifted from the true value (predictable)
How to overcome random errors
by repeating the measurements
How to overcome systematic errors
adjust the measurer to the correct use
How to overcome personal errors
dependent on specific error
What does a random error affect in the experiment?
the precision of the data (how close to each other the data is)
What does a systematic error affect in the experiment?
the accuracy of the results (how close to the true value the results are)
What does a personal error affect in the experiment?
dependent on specific error
Difference between extraneous and confounding variables
Extraneous variables can affect the dependent variable, while confounding variables specifically influence both the independent and dependent variables. All confounding variables are extraneous, but not all extraneous variables are confounding.
How to prevent extraneous variables from occurring?
Controlled variables
Look at experimental design
Look at procedures used
What is the experimental design: Independent Groups?
Participants are randomly allocated to either the control or experimental group, and each participant experiences only one condition.
What is the experimental design: Matched Participants?
Participants are paired based on similar characteristics, and one from each pair is placed in the control group and the other in the experimental group.
What is the experimental design: Repeated measures?
The same participants take part in both the control and experimental conditions, experiencing all levels of the independent variable.
Single blind study and how does it control extraneous variables
participants don't know which treatment they are receiving, but researchers do. This method controls extraneous variables like an participants expectations.
Double blind study
neither the participants nor the researchers know. These studies help minimize biases from both sides.
Order effects
Order effects is an extraneous variable and occurs when the sequence of tasks or conditions in an experiment influences the results. This can include practice effects (better performance later) or fatigue effects (worse performance later). t
How to avoid the confounding variable of order effects?
Counterbalancing is a method used to control for order effect by varying the order of conditions across participants.
Situational variable
an external factor in an experiment that can affect participants' behavior, such as the environment, time of day, or equipment used.
True or False: Extraneous variables are controlled by control variables
True
Primary Data
Data that is sourced first hand
Secondary Data
Data that is sourced through someone else’s research
Advantages of Primary data
More specific and detailed
Can inform future research
It will be current data as you are finding it for your own purpose
Disadvantages of Primary Data
Advantages of Secondary Data
Cheap and easy
Qualitative
Data that is descriptive (Why did this happen?)
Qantatitative
Data in numerical and categorical form (How much or how many?)
Disadvantages of Qualitative Data
Hard to compare and scale
Disadvantages of Quantitative Data
Doesn’t tell the whole story
Subjective Data
Data that relies on assumptions or personal experience, dependent on the participant eg. mood
Objective Data
Data that can be directly observed or measured, eg. speed, score
Subjective Data Advantages
Cannot collect it any other way
Gives us insight to what makes us human
Subjective Data Disadvantages
How do we compare between two people
How do we trust their answer
Advantages of Objective Data
Can see it
Can compare it
Disadvantages of Objective Data
Why did it happen
Can’t see the extraneous variable
Descriptive Statistics
Mathematical calculations that describe, organise and summarise data (DOS).
Descriptive statistics include
Mean, mode and median
Range and standard deviation —> how far spread the scores are from the mean
Presentation of data: frequency distribution tables, bar graphs, line graphs, percentages, etc
What is a benefit of descriptive data?
Allows us to compare and make observations between other data
Mean
average score, find by adding all scores and dividing by number of pieces of data
Median
a middle score
Mode
the most frequent score within the data
What are the three measures of central tendency?
Mean
Mode
Median
Range
difference between highest and lowest scores in distribution
Standard deviation
on average, how far each score lies from the mean, how much variability there is in the distribution of the data
Frequency distribution table
a table of data that can be presented in a different way like a bar graph, histogram, plot graph, etc
Histogram vs Bar graph
The bar graph is the graphical representation of categorical data, bar graph’s bar’s don’t touch each other. A histogram is the graphical representation of quantitative data, the bars do touch each other.
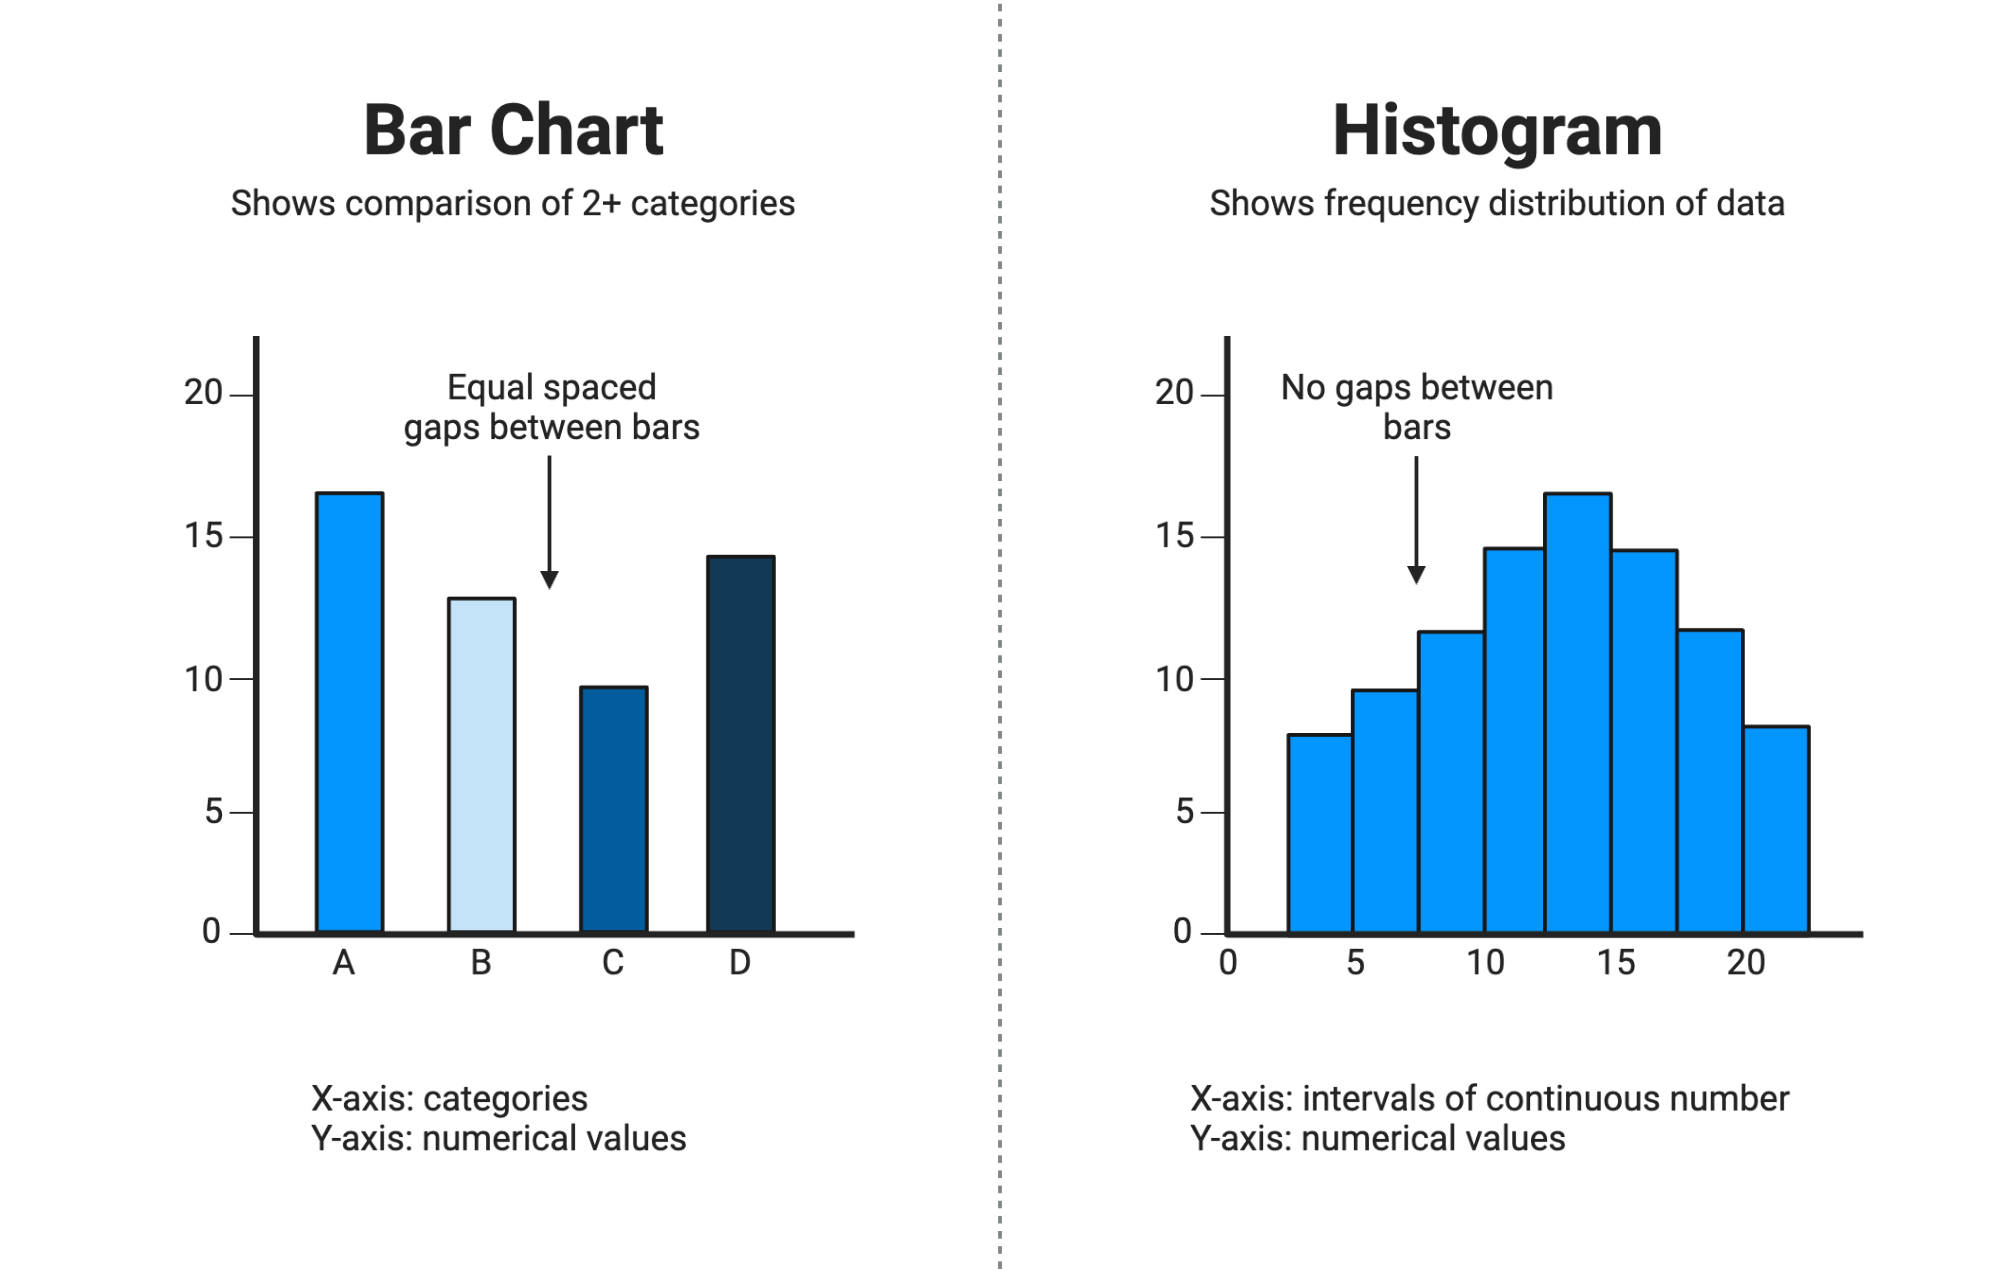
Discrete data vs continous data
Discrete data represents exact figures you can count, such as the numbers of students in a class. In contrast, continuous data often includes measurable values representing a range of information, such as the extent of the difference between the shortest and tallest student in a class.
Does x axis represent IV or DV?
IV
Central tendency
is a way to describe the typical or middle value of a dataset, using measures like mean, median, and mode.
Uncertainty
the lack of exact knowledge relating to smth being measured due to potential sources of variation in knowledge
Why don’t we want human judgements to impact data?
since it could be wrong if not backed up with data
Inferential statistics
mathematical calculations used to make inferences, judgements and conclusions from data (IJC)
Examples of inferential statistics
T-tests
Chi-squared tests
P-values