All elasticities 1.2.3
1/67
There's no tags or description
Looks like no tags are added yet.
Name | Mastery | Learn | Test | Matching | Spaced | Call with Kai |
|---|
No analytics yet
Send a link to your students to track their progress
68 Terms
Definition of PED
Measures the responsiveness of quantity demanded given a change in price
Formula for percentage change
New - original/original x 100
Formula for PED
Percentage change in QD/ percentage change in price
Why is PED usually negative?
Due to law of demand (as P increases, QD decreases)
Can ignore minus sign after calculating value
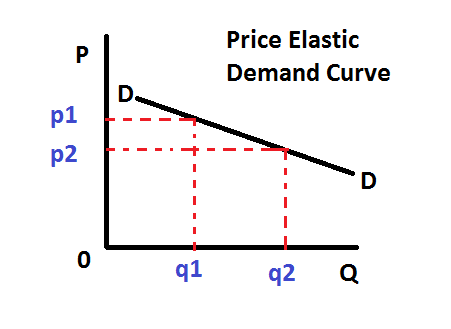
When PED>1 - CURVE IS SHALLOW
Demand is relatively price elastic
This means that there is a greater proportion of change in QD than in price
E.g. price might fall by 5% but QD might rise by 15%
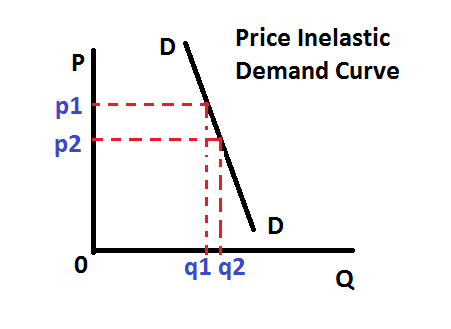
When PED<1 - CURVE IS STEEP
Demand is relatively price inelastic
When price changes, QD will also change but proportionately less
E.g. price might fall by 5% but QD will only rise by 1%
Price elastic
When consumers are highly responsive to changes
A small change in price leads to a big change in QD
E.g. luxury goods/ goods with lots of substitutes
Price inelastic
Consumers are less responsive to price changes (insensitive)
Changes in price have little effect on QD
E.g. necessities or goods with few substitutes
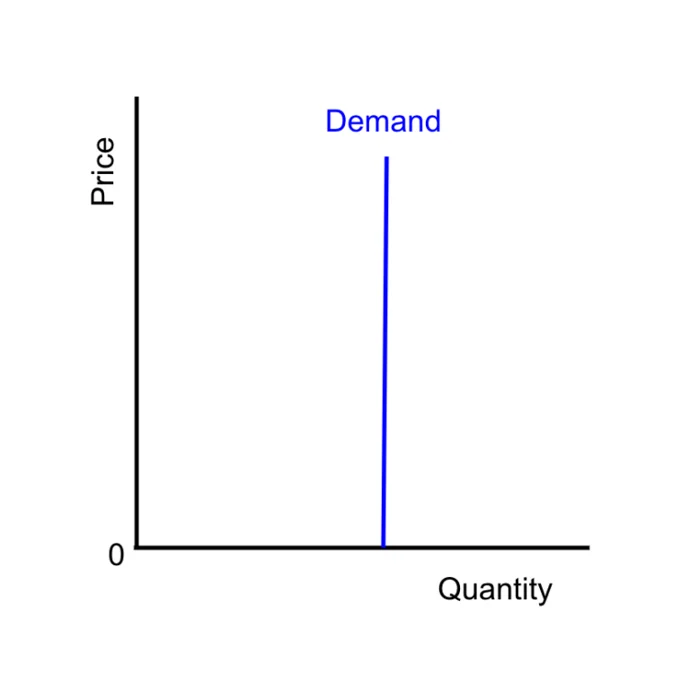
PED = 0
Demand is perfectly price inelastic
Regardless of a price change, QD won’t change at all
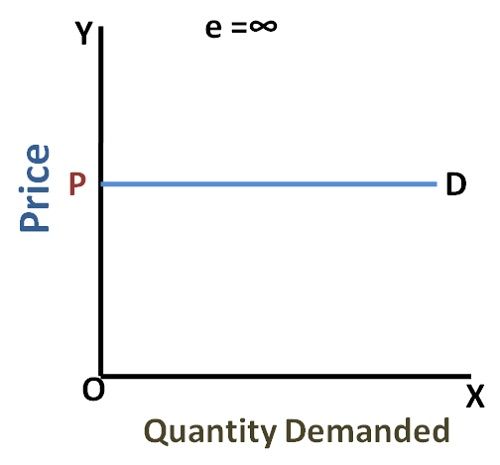
PED is infinite ∞ (rare)
Demand is perfectly price elastic
A small change in price results in an all-or-nothing response in demand (consumers are extremely sensitive to price changes)
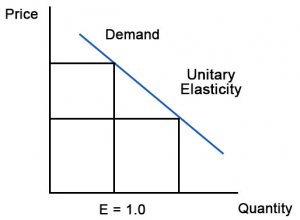
PED = 1
Demand is unit price elastic
Percentage change in quantity demanded is exactly equal to percentage change in price - proportional relationship
E.g. A 10% increase in price leads to a 10% decrease in quantity demanded
How to determine if a good is elastic or inelastic - SPLAT
Substitutes (number of)
Percentage of income
Luxury/ necessity
Addictive/ habitual
Time period
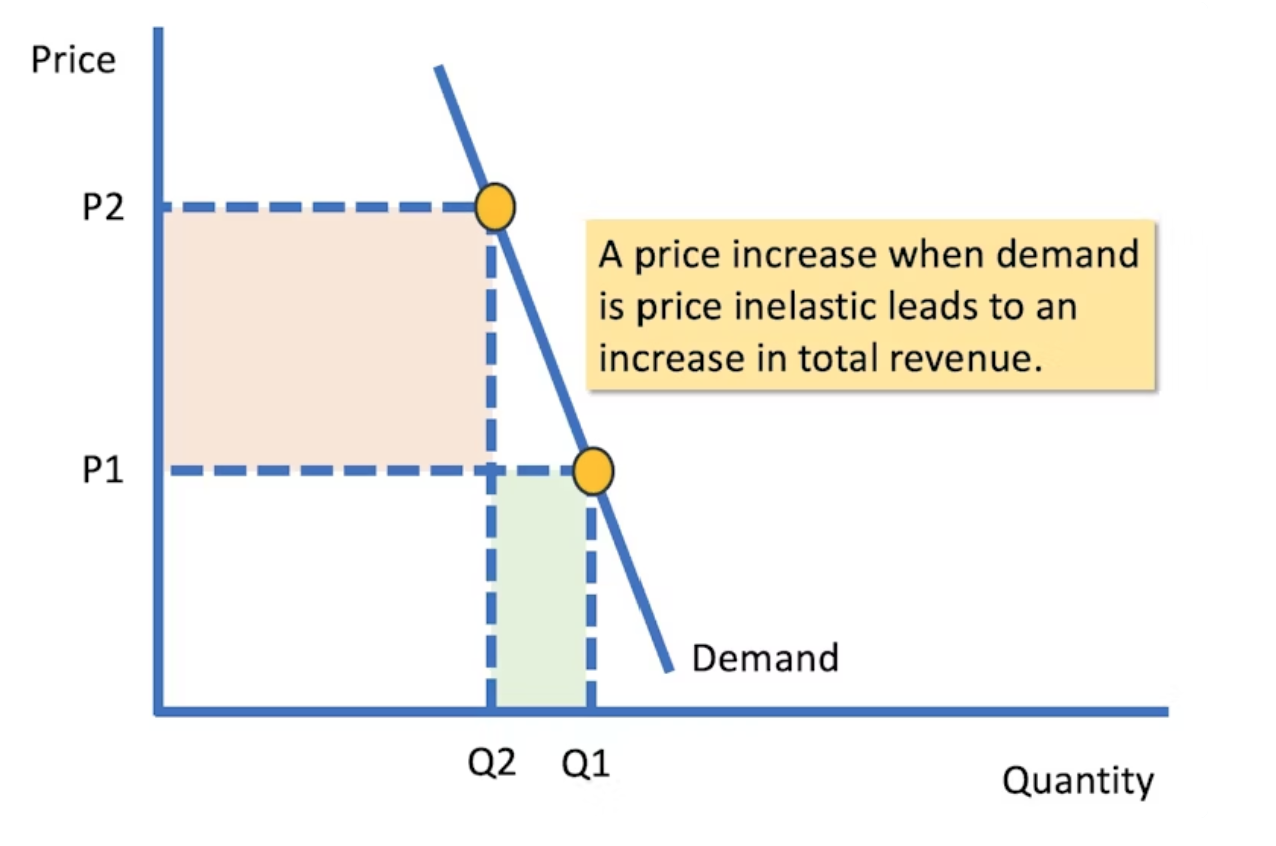
When PED<1 and P increases, what is the relationship between total rev + PED
A rise in price will lead to an increase in total rev e.g. PED = -0.3
Consumers are less responsive to a change in price as they have a lot of consumer surplus - QD may not change massively but the increase in P increases total rev
When PED<1 and P decreases, what is the relationship between total rev + PED?
A decreased in price will lead to a decrease in total rev because QD may not change massively but the decrease in P decreases total rev
When PED>1 and P increases, what is the relationship between total rev + PED
An increase in price will lead to a fall in total rev
QD will drop off massively as you are selling a lot less at a slightly higher price
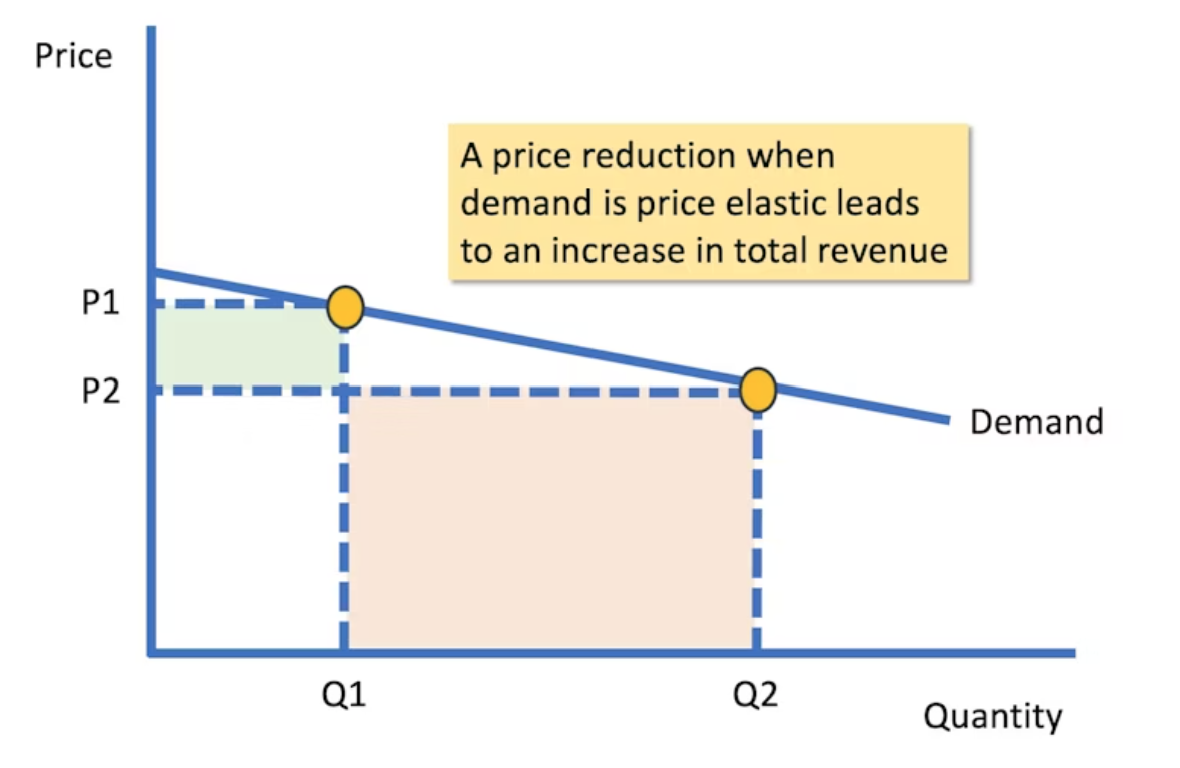
When PED>1 and P decreases, what is the relationship between total rev + PED
A fall in price will lead to an increase in total rev e.g. PED = -2.5
QD will increase massively due to decrease in P so total rev will increase
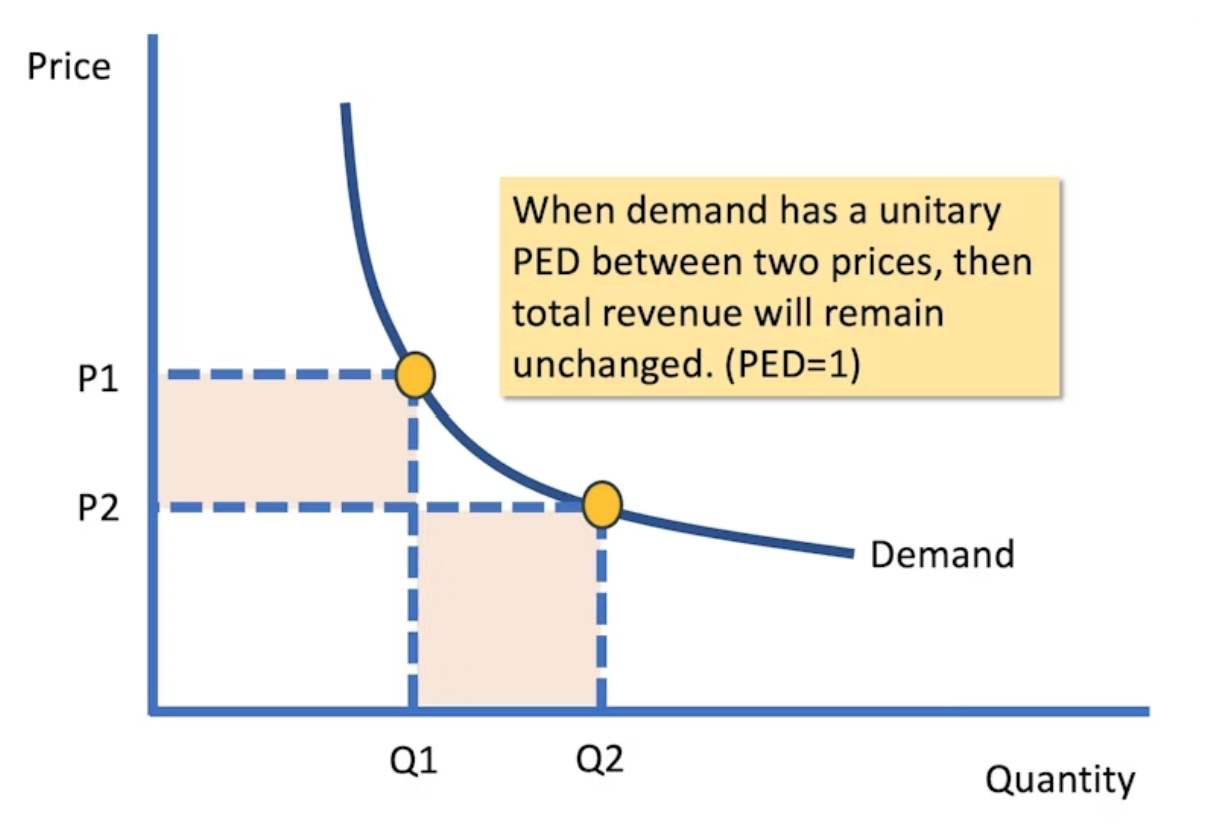
When PED = 1 - What is the relationship between total rev + PED
Total revenue remains unchanged as price changes, indicating unitary elasticity.
YED definition
Measures the responsiveness of QD given a change in income
YED formula
Percentage change in QD / percentage change in income
Percentage difference
New - original / original x 100
Positive value of YED is a..
Normal good - proportionate relationship between income + demand, so as income rises, so does demand
Negative value of YED is a..
Inferior good - inverse relationship between income + demand, so if income rises, demand falls
Can you ignore the sign after you determine value?
Yes - once you know if good is normal or luxury
YED>1 - for a normal good - SHALLOW CURVE
Demand is income elastic - normal luxury
If incomes increase, QD for this good will rise proportionately more than the increase in income
If your income rises, you would buy more luxury goods
YED<1 - for a normal good - STEEP CURVE
Demand is income inelastic - normal necessity
If income increases, QD for this good will rise but proportionately less than the increase in income
E.g. Even when your income increases, you are still buying roughly the same amount (you were already buying it before your increase of income)
YED>1 - for an inferior good - SHALLOW CURVE
Demand is income elastic
YED<1 - for an inferior good - STEEP CURVE
Demand is income inelastic
YED = 0
Demand is perfectly income inelastic
There is no relationship between income and QD
If curve is downwards sloping then..
Inferior good - negative relationship between income + demand
If curve is upwards sloping then..
Normal good - positive relationship between income + demand
INCOME INELASTIC - STEEPNESS OF CURVE?
STEEP
INCOME ELASTIC - STEEPNESS OF CURVE
SHALLOW
What are the factors influencing elasticities of demand for YED?
Proportion of income spent - e.g. goods that take up a small proportion of income (toothpaste) tend to have low YED as demand is less sensitive to income changes
Economic conditions - boom: demand for luxury goods rises, recession = demand for inferior goods rises
Long-run - consumers might have to adjust their lifestyle - leading to higher YED for certain goods
Short-run - consumers may not immediately change their spending habits after an income change
Definition of XED
Measures the responsiveness of QD of a good/service, given a change in price of another
Formula of XED
Percentage change of QD (of good a) / percentage change in price (of good b)
Percentage change formula
New - original / original x 100
Positive value means
The two goods are substitutes
Negative value means
The two goods are complementary
Can you ignore the sign?
Yes - once you have determined whether the two goods are substitutes or complements
XED>1
Demand between the goods is price elastic (strongly related)
When price of A changes, the QD of B changes proportionately more than the change in price of A
XED<1
Demand between the goods is price inelastic (weakly related)
As the price of A changes, QD of B will also change but proportionately less than the change in price of A
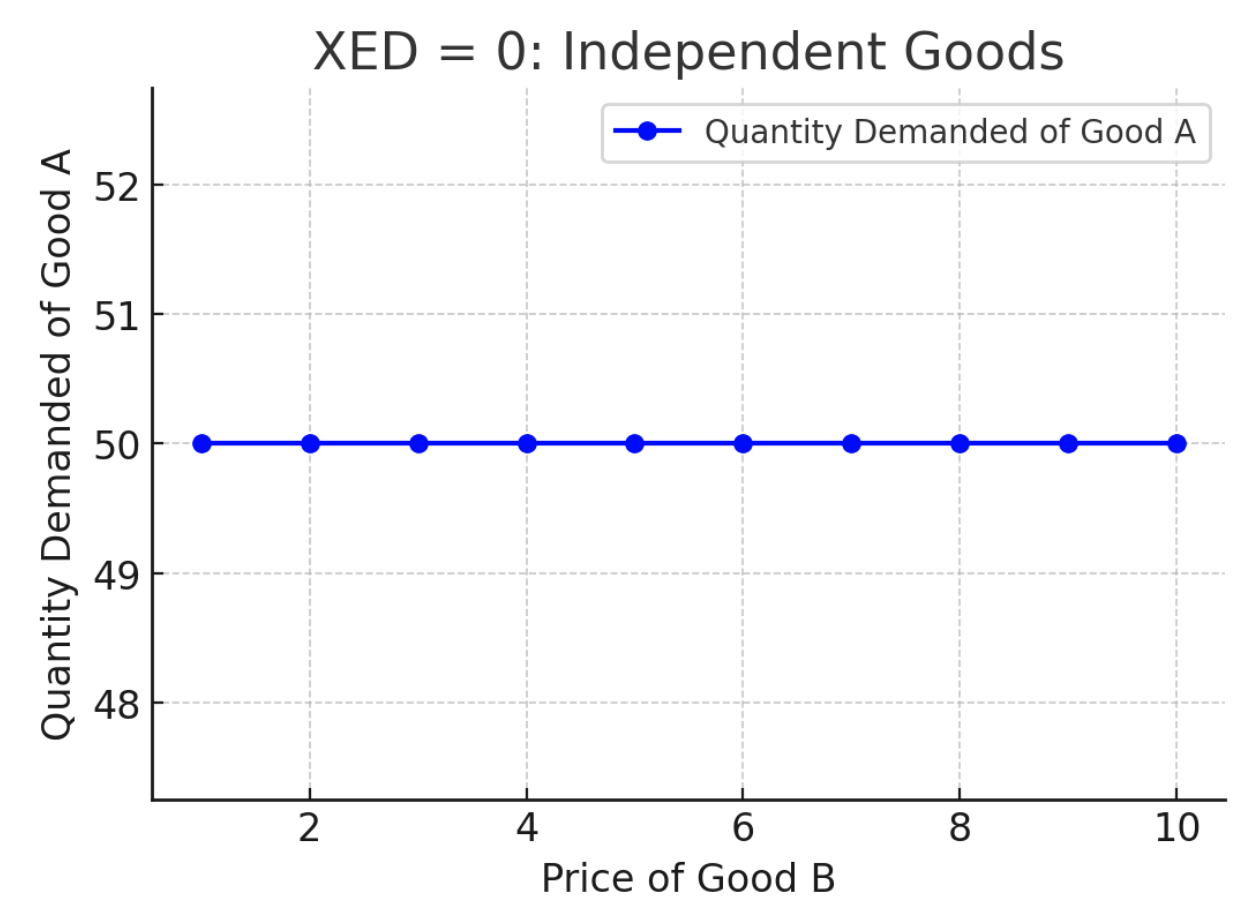
XED = 0
Demand between the goods is perfectly price inelastic (no relationship)
E.g. coffee and snorkelling gear - if price of coffee changes, there will be no effect on QD of snorkelling gear
CLOSELY RELATED COMPLEMENTS - STEEPNESS OF GRAPH
SHALLOW DEMAND CURVE
WEAKLY RELATED COMPLEMENTS - STEEPNESS OF GRAPH
STEEP DEMAND CURVE
Axis when drawing graph
Y axis = price of A
X axis - QD of B
STRONGLY RELATED SUBSTITUTE - STEEPNESS OF GRAPH
SHALLOW DEMAND CURVE
WEAKLY RELATED SUBSITIUTE - STEEPNESS OF CURVE
STEEP DEMAND CURVE
Demand curves for complementary - up or downwards sloping?
DOWNWARDS SLOPING
Demand curves for substitutes - up or downwards sloping?
UPWARDS SLOPING
Factors affecting XED?
Closeness of substitutes/complements - stronger relationships = higher elasticity
Branding + loyalty - strong brand preference lowers XED (even for close subs) - meaning that even if the price of a competing product changes, loyal customers may not switch
Define PES
Measures the responsiveness of quantity supplied following a change in price
Is PES always positive or negative?
Always both positive or negative because price and supply are directly proportional
A shift in demand or a change in price causes what?
A movement along the supply curve - contraction/expansion
PES formula?
Percentage change in quantity supplied divided by percentage change in price

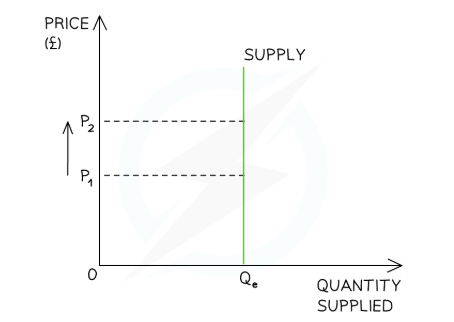
PES = 0
Perfectly price inelastic
Quantity supplied is completely unresponsive to a change in price
E.g. fixed number of seats in a theatre
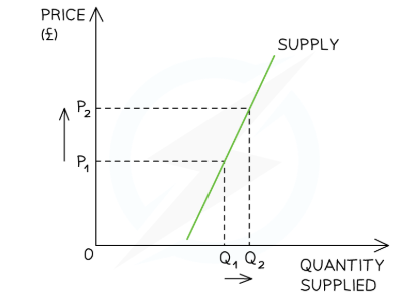
PES<1
Relatively price inelastic
Quantity supplied changes by a smaller % than price e.g. if PES=0.3 then supply has changed proportionately only 30% as much as price
e.g. agricultural products
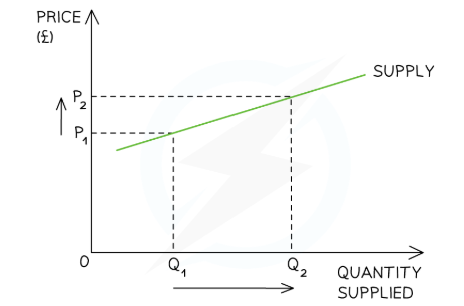
PES>1
Relatively price elastic
Quantity supplied changes by a greater % than the change in price
e.g. t-shirts
PES = 1
Unit-elastic supply
Quantity supplied changes by the same % as the change in price
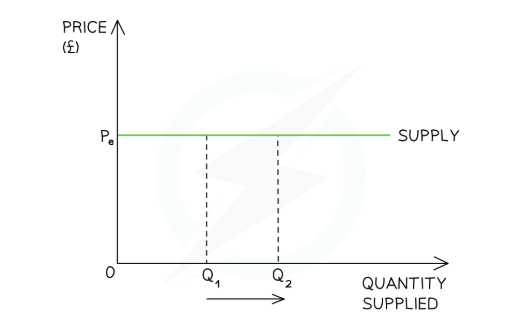
PES = ∞
Perfectly price elastic
QS is 0 with any % change in price, however QS is unlimited at a given price
Very theoretical scenario
Supply curve is horizontal
What determines supply elasticity?
Possibility of factor substitution - ability to switch labour + capital
Availability of spare production capacity
Stock levels
Time frame
Artificial limits on supply
What factors determine elastic supply?
easy to switch factors of production e.g. low skills, untechnical
spare capacity
high stock levels - easy to supply more (likely to be non-perishable goods - e.g. canned food)
long time period
What factors determine inelastic supply?
difficult to switch factors of production e.g. high skill, highly technical
working at full capacity
low/no stock levels
short time period
artificial limits e.g. quotas - fishing quotas
What is capacity?
How much can be produced
What is spare capacity?
How much of a given capacity isn’t being utilised
Effect of artificial limits on supply
Tends to make supply more inelastic:
Quotas/price controls - limits quantity of product that can be produced - even if price rises, producers cannot increase supply
Monopoly behaviour - Deliberately restricting production + output to keep prices high - this makes supply inelastic
Resource scarcity - If a product relies on a scarce resource (e.g. rare minerals), supply can’t increase significantly - making it inelastic.
Effects of stock levels on supply
High stock levels: If a producer has large inventories or surplus stock - supply is more elastic - they can quickly release additional goods into the market when prices rise without waiting to ramp up production.
Low or no stock levels: When stock levels are low, supply becomes inelastic - producers must first manufacture or acquire more goods before responding to price changes. This delay makes it harder to increase supply quickly.
Why is PES - in the short-run typically inelastic?
At least one factor of production is fixed - is a limiting factor (e.g. factory size, land, capital)
Supply is less elastic as firms cannot quickly adjust their production capacity
E.g. If demand for Lego increases suddenly, the company can hire more workers or run extra shifts, but it cannot immediately build new factories, limiting its ability to increase supply
Therefore, short-run usually = inelastic as firms face production constraints
Why is PES - in the long-run typically elastic?
All factors of production are variable - firms can adjust everything (expand factories, buy more machines, etc)
Supply is more elastic because firms can fully adapt to changes in market conditions
E.g. Over time, Lego can build a new factory, increasing its production capacity to meet higher demand
Therefore, long-run usually = more elastic as firms have time to expand capacity + enter/exit the market