Statistics
1/44
There's no tags or description
Looks like no tags are added yet.
Name | Mastery | Learn | Test | Matching | Spaced | Call with Kai |
|---|
No analytics yet
Send a link to your students to track their progress
45 Terms
Simple Random Sample (SRS)
A sampling method where each member of the population has an equal chance of being selected.
Stratified Sample
A sampling method where the population is divided into subgroups (strata) and a random sample is taken from each strata.
Cluster Sample
A sampling method where the population is divided into clusters, and entire clusters are randomly selected.
Systematic Sample
A sampling method where members are selected at regular intervals from an ordered list.
Bias
A systematic error that overrepresents or underrepresents a segment of the population.
Observational Study
Research that involves observing subjects without manipulation to determine associations.
Experiment
Research that involves manipulating variables to determine causation.
Explanatory Variable
The variable that is manipulated or altered to observe its effect on the response variable.
Response Variable
The variable that is measured to assess the effect of changes in the explanatory variable.
Confounding Variable
A hidden variable that may relate to both the explanatory and response variables, potentially misleading results.
Blocking
A technique used in experiments to group similar subjects together to reduce variability.
Placebo
A substance with no therapeutic effect used as a control in testing new drugs.
Single-blind Study
An experiment where the subjects do not know whether they are receiving the treatment or a placebo.
Double-blind Study
An experiment where both the subjects and the experimenters do not know who is receiving the treatment or placebo.
Percentile
A measure that indicates the value below which a percentage of observations fall.
Law of Large Numbers
The principle that as the sample size increases, the sample mean will tend to get closer to the population mean.
Binomial Distribution
A probability distribution of a number of successes in a fixed number of independent trials.
Geometric Distribution
A probability distribution of the number of trials until the first success occurs.
Poisson Distribution
A probability distribution that expresses the probability of a given number of events occurring in a fixed interval of time or space.
Exponential Distribution
A probability distribution that describes the time between events in a Poisson point process.
Probability Notation
Mathematical symbols used to express probabilities in a concise manner.
Expected Value
The long-term average or mean of a random variable over many trials.
Standard Deviation
A statistic that measures the dispersion or variability of a set of data points from their mean.
Categorical variable
Discrete Quantitative Variable
A quantitative variable that can take on a countable number of values.
Continuous Quantitative Variable
A quantitative variable that can take on an infinite number of values within a given range.
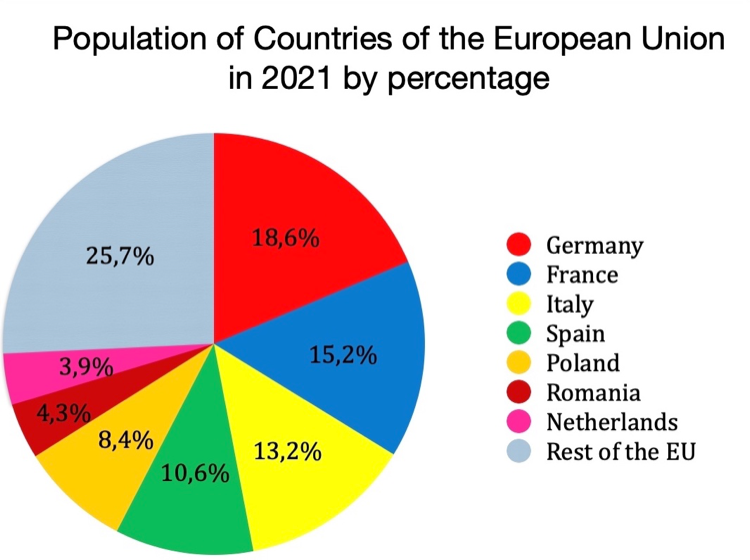
Pie Chart
A circular statistical graphic divided into slices to illustrate numerical proportions.
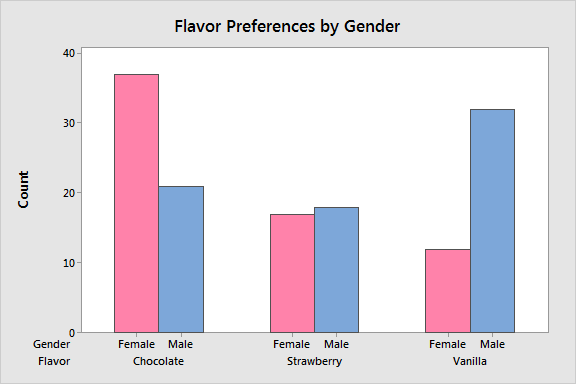
Bar Graph
A graph that represents categorical data with rectangular bars with lengths proportional to the values they represent.
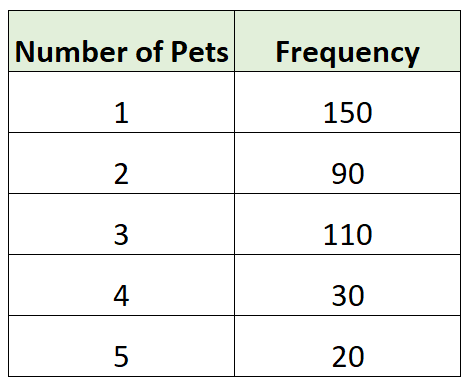
Frequency Table
A table that displays the number of occurrences of each value in a dataset.
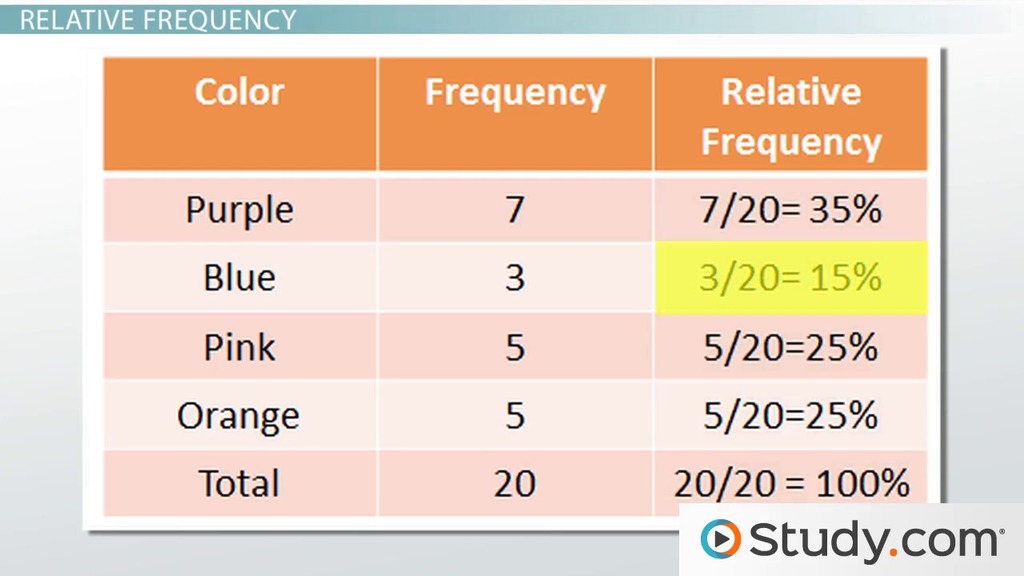
Relative Frequency Table
A table showing the proportion of the total counts that fall into each category.
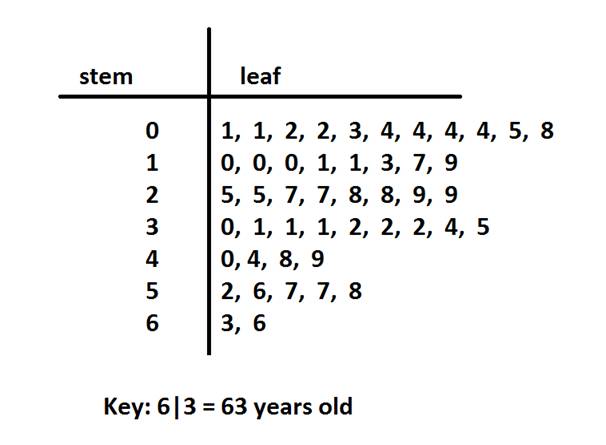
Stem-and-Leaf Plot
A method of displaying quantitative data in a graphical format similar to a histogram.
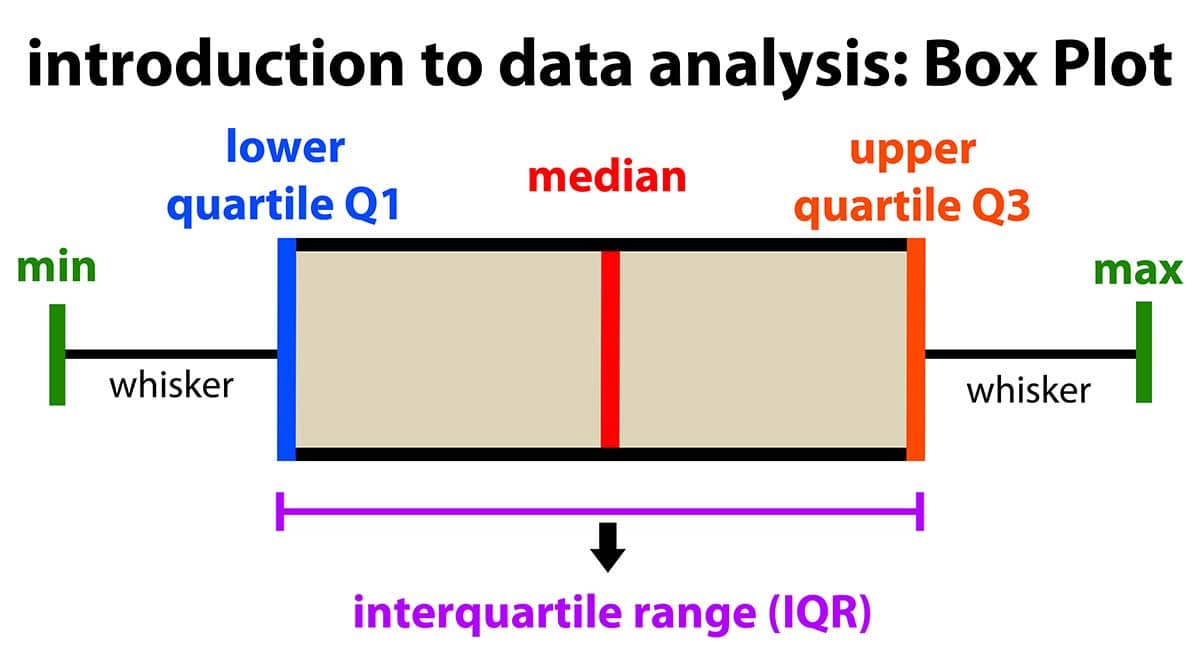
Box-and-Whisker Plot
A standardized way of displaying the distribution of data based on خمسة-number summary.
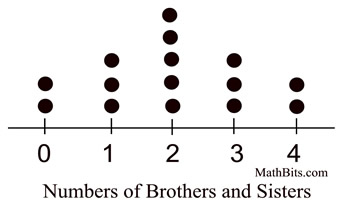
Dot Plot
A simple display of data points by placing a dot above a number line for each data point.
Histogram
A graphical representation of the distribution of numerical data using bars.
Unimodal
A distribution with a single peak or mode.
Bimodal
A distribution with two distinct peaks or modes.
Uniform
A distribution where all outcomes are equally likely.
Right Skew
A distribution that has a longer tail on the right side.
Left Skew
A distribution that has a longer tail on the left side.
Symmetric
A distribution that is identical on both sides of the center point.
Mean
The average of a set of values, calculated by summing them and dividing by the count.
Median
The middle value of a dataset when it is ordered from least to greatest.
Range
The difference between the highest and lowest values in a dataset.
Interquartile Range (IQR)
The difference between the third quartile (Q3) and the first quartile (Q1) in a dataset.
Oddities
Unusual data points or patterns in a dataset that do not conform to expected behaviors.