Psychological Statistics Exam 3
1/83
There's no tags or description
Looks like no tags are added yet.
Name | Mastery | Learn | Test | Matching | Spaced | Call with Kai |
|---|
No analytics yet
Send a link to your students to track their progress
84 Terms
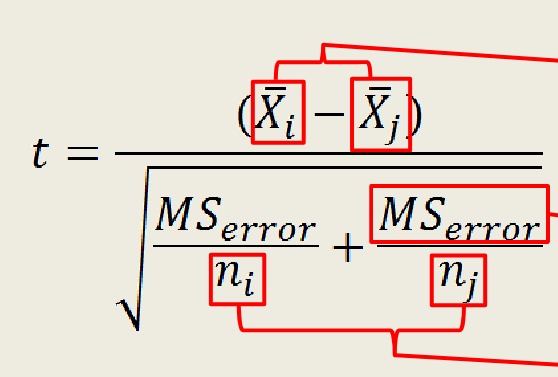
independent samples t-test
analyze experiments and other studies where there are two sets of data from two separate groups of participants (a between-subjects study)
paired samples test
analyze two sets of data from the same group of participants (a within-subjects or repeated measures design) or from participants linked in some way (a matched-subjects design)
familywise alpha level
the likelihood of making at least one Type 1 error among a set of tests
ANOVA (Analysis of Variance)
is a statistical method used to determine if there are statistically significant differences between the means of three or more independent (unrelated) groups. It helps in identifying whether any of the group means are different from each other when the independent variable is categorical and the dependent variable is continuous.
One-Way ANOVA
Compare the means of two or more groups (from a single independent variable) on a single dependent variable. If there’s a significant difference between the means of different levels of your IV, that suggest that your IV is having an effect on your DV
ex: test anxiety in PSY201 by year in school
Repeated-Measures ANOVA
Compare two or more instances of the same dependent variable
ex: change in average scores across 4 exams in a single class
Factorial ANOVA
Compare the means of a single dependent variable for two or more groups determined by two or more independent variables simultaneously
ex: test anxiety in PSY201 by year in school and major
Mixed Model ANOVA
Like repeated-measures with an independent variable added
ex: change in average scores across four PSY201 exams, compared by major
The Assumption of Normality
Populations from which we draw our samples are normally distributed
The Assumption of Homogeneous Variable
Groups within our samples will all have the same variable, the idea of rarely coming across a variance of 0, but that no matter what dataset the variance is most likely the same
The Assumption of Independent Observations
Groups within our sample are independent
Treatment Variability
The portion of total variability associated with the differences between group means
Error Variability
The portion of total variability associated with the differences between individual scores within a single group
Sums of Squares (SS)
Score deviations from the mean, short for “Sum of Squared Deviations from the Mean”, calculated for groups, error, and the total (plus others)
Mean Squares (MS)
Sums of Squares divided by their associated degrees of freedom
Grand Mean
The mean of all scores across all groups in the study
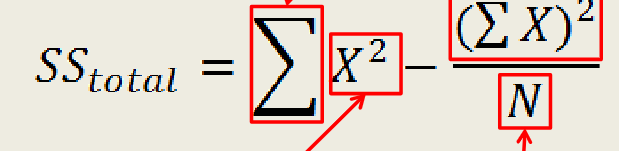
Sum of Squares Total (SStotal)
The sum of squared deviations of individual scores from the grand mean (All the variability in our data)
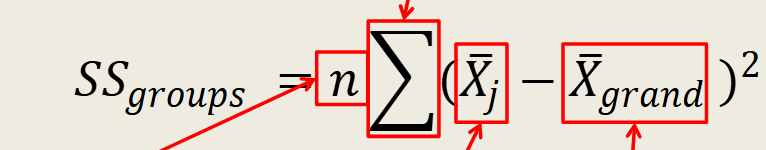
Sum of Squares Groups (SSgroups)
The sum of squared deviations of group means from the grand mean, multiplied by the number of scores in that group (All the variability associated specifically with our independent variable)
Sum of Squares Error (SSerror)
The sum of squared deviations of a group’s scores from its individual mean
SStotal-SSgroups=SSerror
All the variability in our data that is not the result of our independent variable
Mean Squares Groups (MSgroups)
SSgroups divided by the degrees of freedom between groups
Group Degrees of Freedom (Group df)
number of groups -1
Mean Squares Error (MSerror)
SSerror divided by error degrees of freedom
The F-statistic
helps determine if there are statistically significant differences among the group means in a dataset.
The ratio of meaningful variability to non-meaningful variability
F = MSgroup/MSerror
Why is ANOVA more complex than t-tests?
-Not limited to two levels of the IV or measurements
-Separates meaningful variability (associated with our IV)
-From variability we can’t account for (time of day, personal decisions, mood, etc.)
What is an omnibus test?
a statistical test used to determine if there are any significant differences between multiple groups or conditions, without specifying which particular groups are different from each other.
What is a between-subjects ANOVA?
a statistical method used to compare means among two or more independent groups, where different subjects are assigned to each group. (three or more levels)
Total Variance
the variance for the entire data set, ANOVA uses variance instead of standard deviation. Th higher the______, the more scores vary from the grand mean
The goal of ANOVA
-break down the total variance in order to understand where these differences come from
-How much of participants’ scores seem to be driven by which group they are in (that is, what level of the independent variable they are assigned to), and how much they seem to be due to all the other unnamed factors that could influence their scores?
Think of a single score in our dataset as being constructed from 3 pieces:
1) the grand mean
2) some adjustment for what group you are in
3) some additional adjustment for all the other things that could influence your score
between group variance
how much of the variability in individual scores is due to the group they are in, focuses upon how far apart the group means are from each other
within group variance
how much of the variability in scores shows up as differences from participant to participant within each condition, amount of spread of scores within each group
If all 3 group means were identical…
they would all be the same as the grand mean, and the between group variance would be exactly 0
What causes individual scores from the same group to differ from one another?
Unsystematic Differences:
1) Individual Differences: personality, preferences, attitudes, and beliefs
2) Temporary States: health, mood, alertness, and stress
3) Experimental Error: inconsistencies in how the treatment was applied or how the DV was measured
Unsystematic Differences
countless forces that might influence a person’s score besides the effect of the group that they are in, do not apply consistently to each participant either within or across groups
What are the sources of Between Group Variance?
1) Treatment Effects: systematic differences caused by the treatment of independent variable, effect of being a member of that group
2) Unsystematic Differences

what does this stand for?
“weights” the deviation score to account for group size, # of scores in a specific group

what does this stand for?
Everything to the right, there’s gonna be multiple scores, so you add them all together

what does this stand for?
scores squared for SStotal formula (square each individual score then add them all up)
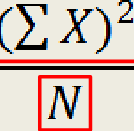
what does this stand for?
the squared sum of scores (add the individual scores up, and then square the total), over the number of scores in the whole dataset
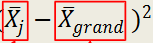
what does this stand for?
the mean of a specific group minus the grand mean
What is Fisher’s Least Significant Difference (LSD) Test?
a post-hoc statistical analysis used after an ANOVA to determine which specific means are significantly different from each other. It allows for pairwise comparisons between group means while controlling for Type I error rate. If the absolute difference in means between any two groups exceeds the LSD value, those means are considered significantly different.
error term/Residuals
allow us to interpret whether our differences between groups are likely just due to these unsystematic differences, or whether they are largely due in part to a real treatment effect
Characteristics of F Distribution
-Not symmetrical, positively skewed with a long-tail trailing off to the right where the higher F-values are
-Almost always positive
-Will be 0 if all of the group means are identical
The Null Hypothesis for a Three-Group Study:
all three population means are the same
H0: u1=u2=u3
the alternative hypothesis for a three group study:
the means for at least one pair of populations is greater than zero
K
refers to the number of levels of the independent variable
Between-Subjects ANOVA
One DV measured once across multiple levels of an IV (one-way) or combination of IVs (factorial)
Within-Subjects/Repeated-Measures ANOVA
One DV measured multiple times, especially good for measuring change over time
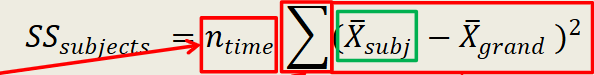
SSsubjects
Deviation of means for each participant from the grand mean, weighted by the number of time points
SStime
Deviation of means for each time point from the grand mean, weighted by the number of participants in that time point
Subject Means
average of a single participant’s scores across all time points
Time Means
average of all participants’ scores for a given day
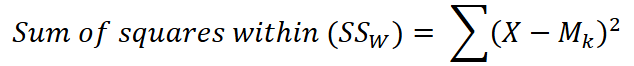
Sum of Squares Within (SSw)
the deviations of each observation from the mean of the group it comes from, how far each score is from its group mean
Sum of Squares Between (SSb)
we multiply each group by its sample size nk in order to represent this “effect of being in this group” one time for each observation in that group
Post Hoc Tests
statistical analyses conducted after an ANOVA to determine which specific group means are different from one another. These tests control for Type I error by adjusting for the number of comparisons made, using methods such as Tukey's HSD or Games-Howell. This approach ensures that while multiple comparisons are evaluated, the overall risk of falsely identifying significant differences remains minimized.
Eta-squared (η²)
a measure of effect size used in the context of ANOVA. It indicates the proportion of total variance in the DV that can be attributed to the IV(s). The value of η² ranges from 0 to 1, where 0 indicates that the IV doesn’t explain any variance, while a value of 1 indicates that all variance is explained by the IV.
- η² = 0.01 is considered a small effect
- η² = 0.06 represents a medium effect
- η² = 0.14 and above is viewed as a large effect
Partial Eta-squared (η²)
a measure of effect size specifically tailored for use in factorial designs. isolates the effect of a specific IV while controlling for other variables in the analysis. This is particularly useful in complex designs where multiple factors are present. Values can vary from 0 to 1, with similar interpretations for small (0.01), medium (0.06), and large (0.14) effects. By focusing on the contribution of a particular factor to the variance explained, it allows researchers to draw more nuanced conclusions about the significance and impact of their experimental manipulations
Omega-squared (ω2)
a measure of effect size used in the context of ANOVA to estimate the proportion of variance in the dependent variable that provides a less biased estimate, particularly in large samples. The value of ω2 can range from 0 to 1, with higher values indicating a larger effect size. This measure is particularly useful in meta-analyses and when evaluating the practical significance of results, providing a more accurate depiction of the impact of the independent variable(s) on the dependent variable.
Planned Contrasts
sometimes called a priori tests, a subset of all possible tests, they require less correction of the alpha level, must be set up ahead of time before you do any data analysis at all
How to Remove Unsystematic Differences:
1) We break the total variance into between group variance and within group variance
2) We break within group variance into between subjects variance and error variance
Between Subjects Variance
come from the consistent individual differences, from “subject” to “subject”
Error Variance
the remaining variability due to unsystematic differences that are left after cutting the individual differences away
Between Subjects Sums of Squares
summing the squared deviations between the Mp (participant mean) and the grand mean
Sphericity Assumption
it focuses on the assumption that the variances from each difference score are equal. It is specifically for the repeated measures ANOVA
Large, Non-Significant Results
Means are far apart, but scores range all over the place. big numerical difference, but not necessarily meaningful
Small, Significant Results
Means closer together, but scores clustered tightly around those means. Small numerical difference, but possibly meaningful
Effect Size
Measures “distance” between the two means in terms of standard deviation
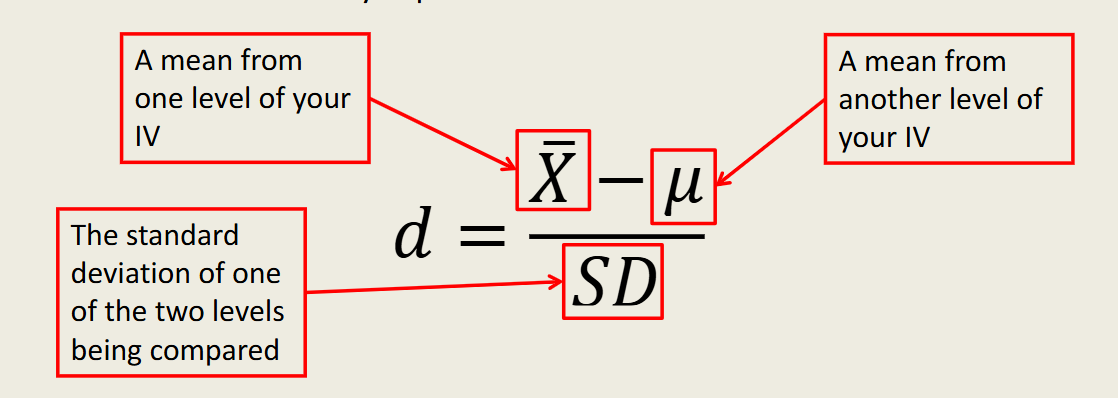
Cohens’ d
a measure of effect size that expresses the difference between two group means in terms of standard deviations. It is calculated by taking the difference between the two means and dividing it by the standard deviation. provides a standardized measure of the effect size, making it easier to interpret the magnitude of the difference regardless of the sample size. Typically, a Cohen's d of 0.2 is considered a 'small' effect, 0.5 a 'medium' effect, and 0.8 a 'large' effect.
Large Effect Size suggests
the factor in question contributes a lot to the thing you’re studying
Small Effect Size
suggests the factor in question contributes something, but not the whole story
Confidence Intervals
Estimate of sampling accuracy, how close are we getting to an estimated parameter, Arbitrary number, set as an expression of probability
a 95% confidence interval is
that the parameter will be captured in sampling 95 times out of 100
ex: 95%CI=[3,7] means that there’s a 95% chance that the population mean falls between 3 and 7
Power
Our capacity to detect a significant effect
A study with low power is one in which
given your data, the chances of committing Type II error are high, most likely too low of a sample
Type II Error
a statistical test fails to reject a false null hypothesis. In simpler terms, it’s the error made when a test concludes that there is no effect or difference, when, in reality, there is one
Greenhouse-Geisser Correction
preemptively corrects for any lack of sphericity. adjusts the degrees of freedom of the F-statistic to account for the degree of violation of the sphericity assumption.
Between Subjects Factorial ANOVA
Test the effects of two independent variables (sometimes called factors), where all scores are independent and unconnected to any scores in other conditions
conditions
in the case of a factorial ANOVA, the combinations of the different levels of the two or more IVs create conditions
ex: when the 2 IVs are type of food and amount of food, with 2 levels in each (beef vs. cereal, low vs high), there are 4 different conditions (low amount of beef, etc.)
Factorial Notation
a shortcut for Factorial ANOVA to know how many levels and IVs there are
ex: The current study utilized a 2(type of food: beef vs. cereal) x 2(amount of food: low vs. high) factorial design
Main Effect
the overall effect of that independent variable on the dependent variable, specifically the relationship between one of those IVs and the DV that is unconnected and not dependent on the other IV
How do you know the number of possible main effects in a factorial design?
it is exactly equal to the number of IVs in the study
marginal means
the means of a specific level regardless of the other variable, if the ____of one IV are close, it suggests there’s no main effect
interaction
how the two (or more) independent variables work together to create an effect on the dependent variable that cannot be explained by studying each IV separately
How do you know an Interaction is present?
the lines are not parallel on a line graph, when there are 2 independent variables, there is only one interaction possible