W3: Classification: Decision Tree and Performance Evaluation
1/29
There's no tags or description
Looks like no tags are added yet.
Name | Mastery | Learn | Test | Matching | Spaced |
|---|
No study sessions yet.
30 Terms
Classification
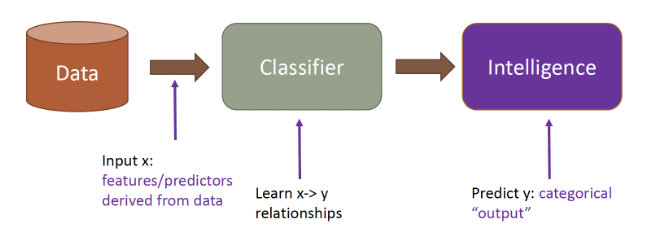
supervised learning technique in machine learning and statistics where the goal is to assign data points (objects) to predefined categories (classes) based on their features (attributes).
Objective: Predict the class label of an object based on its features.
Input: A dataset with labeled examples (features and corresponding class labels).
Output: A model that can predict the class label for new, unseen data.
Why classification?
Predicting the class or category of an action to enable timely and cost-efficient decision-making.
used in business, healthcare, finance, and other fields to streamline processes, reduce costs, and improve decision-making.
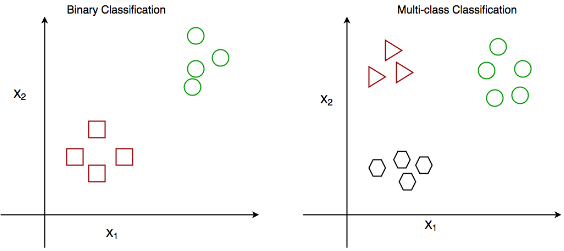
Types of Classification
Yes/no categorization: for two possible outcomes.
Example: Cat vs. Dog Classification
—
Multi-class classification involves categorizing images into three or more classes. This is more complex than binary classification as the model must learn to distinguish between multiple categories simultaneously.
Example: sentiment analysis (positive, neutral, negative)
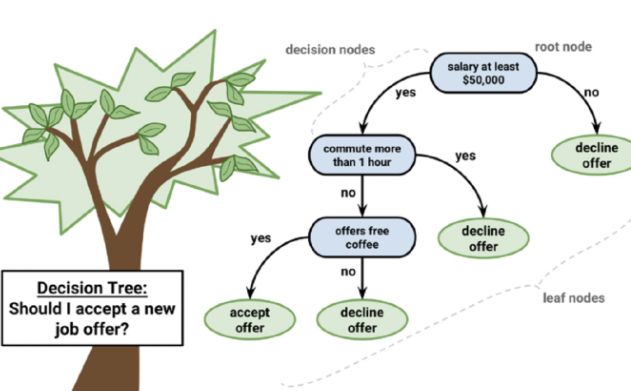
Decision Tree
powerful and intuitive machine learning technique that learn and express classification or prediction patterns in the form of a tree structure.
Advantages of Decision Tree Algorithms
Easy to understand and visualize, making them ideal for explaining model decisions to non-experts.
Less number of data preparation steps unlike other machine learning algorithms
It is a non-parametric algorithm i.e. it does not require lot of assumptions
Disadvantage of Decision Tree Algorithms
prone to overfitting, creating complex decision rules that capture noise in training data, leading to poor generalization on unseen samples.
Training decision trees can be highly time-consuming, especially when dealing with large datasets or multiple continuous independent variables
finding optimal split points requires evaluating numerous thresholds.
Decision trees are inherently unstable, with small changes in the input data potentially causing dramatic shifts in the tree structure predictions
making them sensitive to variations in the training set.
Decision Tree Model Steps
Step 1) Kicked Vehicle Data
Step 2) Data Preprocessing
Step 3) Build a decision tree on training data
learn the relationship between predictors and target variable
Step 4) Evaluate Decision Tree Model Performance
Step 1: Kicked Vehicle Data
The dataset includes information about vehicles bought at an auction, such as odometer readings, warranty costs, vehicle age, etc.
Predictor Variables (X)
Target Variable (Y)
Classifier
Predictor
variable used in forecasting the values of another variable, known as the target variable
Target Variable
Variable whose outcomes are modeled and predicted based on the predictors.
Classifier
type of model or algorithm in machine learning that categorizes input data into specific classes
Step 2: Data Preprocessing
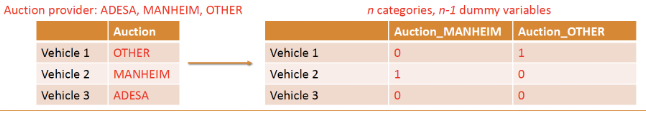
Dummy coding
Splitting Data
Dummy coding
convert categorical variables into numeric format
Create dummy variables to replace the original categorical variable
binary variable: gender
Splitting Data (Data Preprocessing)
Dividing the dataset into training and testing sets for model evaluation
Decision Tree structure
Leaf Node
Decision Node
Root Node
Leaf Node
Endpoint of the tree where no further splitting occurs. It represents a class label (outcome), such as a prediction result (Yes or No).
Decision Node
Includes both the root node and internal nodes. These nodes contain a predictor and make decisions based on input features.
Root Node
First node of the tree, represents the entire population or dataset. It splits into two or more homogeneous subsets based on the most significant attribute.
Step 3: Build a Decision Tree
Splitting Data
Entropy
Information Gain
Recursive Splitting
Splitting Data
Decision trees split the dataset based on a predictor that creates the most homogeneous subgroups, measured by the purity of the subset.
Entropy
Represents the randomness or impurity in the dataset. It is used to decide how to split data within the decision tree.
Lower _____ indicates purer data subsets.
Higher information gain = lower _____
Information Gain
The reduction in entropy after a dataset is split based on a predictor. It helps in selecting the best feature for splitting the data at each step
Higher means a better split.
Recursive Splitting
Decision trees use a recursive approach to continue splitting the data until a stopping criterion is met
(e.g., all nodes are pure or maximum depth is reached).
Step 4: Evaluate Decision Tree Performance
Confusion Matrix
Evaluation Metrics
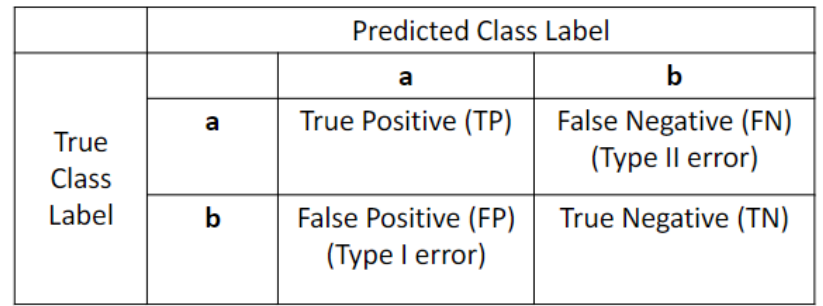
Confusion Matrix
A table used to evaluate the performance of a classification model by comparing predicted values to actual values.
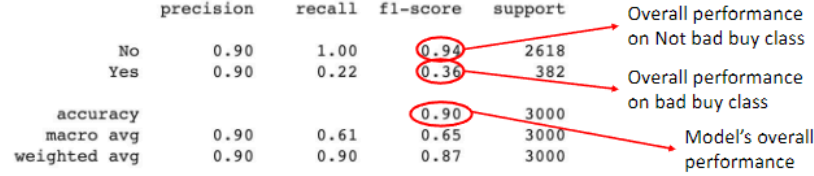
Evaluation Metrics
Precision
Recall
F-Measure
Pruning
Precision
Ratio of correctly predicted positive observations to the total predicted positives
shows how precise the model is when predicting the positive class.
Recall
Ability of the model to correctly identify all positive cases.
F-Measure
Harmonic mean of precision and recall, providing a balanced measure of the model’s performance.
Pruning
Process used to reduce the complexity of the model and avoid overfitting by removing branches that have little importance.