AP Statistics Unit 1
1/12
Earn XP
Description and Tags
Name | Mastery | Learn | Test | Matching | Spaced | Call with Kai | Chat |
|---|
No analytics yet
Send a link to your students to track their progress
13 Terms
(1.6) What are the important characteristics to discuss when describing the distribution of quantitative data?
Shape (Skewed Left/Right, Symettrical, Unimodal, Bimodal, Uniform)
Center (Mean, Median)
Variability/Spread (Range, IQR, Standard Deviation)
Unusual Features (Outliers, Gaps, Clusters)
(1.7) How do we determine if a value in a data set is an outlier?
Less than 1.5 times the IQR below Q1 or more than 1.5 times the IQR above Q3
2 or more standard deviations away from the mean
(1.7) IQR Formula?
Q3 - Q1
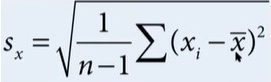
(1.7) Standard Deviation Formula
(1.7) What measures are non-resistant?
Mean, Standard Deviation, & Range
(1.7) What measures are resistant?
Mean & IQR
(1.8) How does the shape of a graph influence the relative relationship of the mean and median?
Skewed right distribution, mean > median
Skewed left distribution, mean < median
Symetric distribution, mean = median
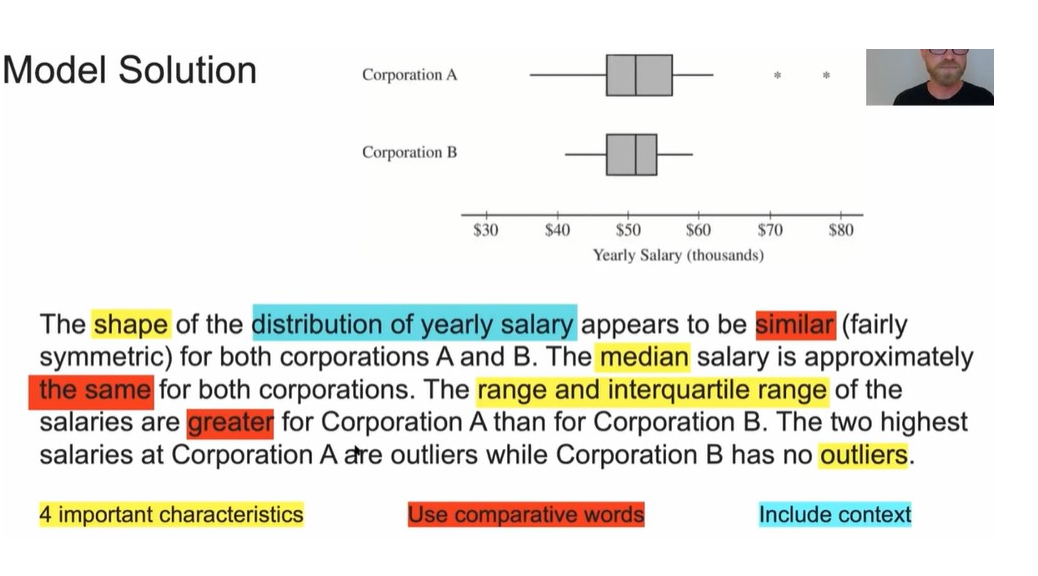
(1.9) For a Complete Response when comparing distributions of quantitative data, what is required?
Address the four important characteristics (Shape, center, variability, unusual features)
Use Comparative Words
Include Context
(1.10) Define normal distribution
Model for quantitative data that appears often in real life. It is mound shaped (bell curve) and symmetric.
(1.10) Empirical Rule
States that for a normal distribution:
Approximately 68% of data falls within 1 standard deviation from the mean.
Approximately 95% falls within 2 standard deviations.
Approximately 99.7% falls within 3 standard deviations.
In other words, 68-95-99.7
(1.10) How can percentile be used to describe position of a value in a quantitative data set?
Percentile is the percent of data values less than or equal to a given value.
(1.10) Z-Score?
Z-Score tells us the number of standard deviations above or below the mean
(1.10) How can z-score be used to find percent of data values in given interval for normal distribution?
Left: Get from Table A
Right: 1 - Area from Table A
Between: Subtract two areas from Table A