4.4: Contingency Tables and Association
1/6
Earn XP
Description and Tags
Learning Objectives: 1. Compute the marginal distribution of a variable 2. Use the conditional distribution to identify association among categorical data 3. Explain Simpson’s Paradox
Name | Mastery | Learn | Test | Matching | Spaced |
|---|
No study sessions yet.
7 Terms
Contingency Table
A “two-way table” that is used to analyze ‘count’ data across two experimental factors/categories of data (usually n set of counts or frequencies)
Row variable
Column Variable
Cell (Each box inside the table)
What is the row/column variable in the table below?
Traditional | Online | Hybrid | |
A B C D F | 36 52 57 46 46 | 39 55 68 38 54 | 24 66 90 41 31 |
Row variable: grade (each row in the table describes the grade received for each group)
Column variable: Delivery Method (Trad., Online, Hybrid)
Marginal Distribution
The Frequency or Relative Frequency distribution of either the row or column variable in a contingency table.
EXAMPLE Determining Frequency Marginal Distributions
A professor at a community college in New Mexico conducted a study to assess the effectiveness of delivering an introductory statistics course via traditional lecture-based method, online delivery (no classroom instruction), and hybrid instruction (online course with weekly meetings) methods, the grades students received in each of the courses were tallied.
Find the frequency marginal distributions for course grade and delivery method.
Traditional | Online | Hybrid | |
A B C D F | 36 52 57 46 46 | 39 55 68 38 54 | 24 66 90 41 31 |
Traditional | Online | Hybrid | Frequency (total) | |
A B C D F | 36 52 57 46 46 | 39 55 68 38 54 | 24 66 90 41 31 | 99 173 215 125 131 |
Frequency (total) | 237 | 254 | 252 | 743 |
EXAMPLE Determining Relative Frequency Marginal Distributions
Determine the relative frequency marginal distribution for course grade and delivery method.
Traditional | Online | Hybrid | |
A B C D F | 36 52 57 46 46 | 39 55 68 38 54 | 24 66 90 41 31 |
Traditional | Online | Hybrid | Relative Frequency | |
A B C D F | 36 52 57 46 46 | 39 55 68 38 54 | 24 66 90 41 31 | 99/743 = 0.133 173/743 =0.233 215/743 =0.289 125/743= 0.168 131/743 =0.176 |
Relative Frequency | 237/743 = 0.319 | 254/743 = 0.342 | 252/743 = 0.339 | 1.000 |
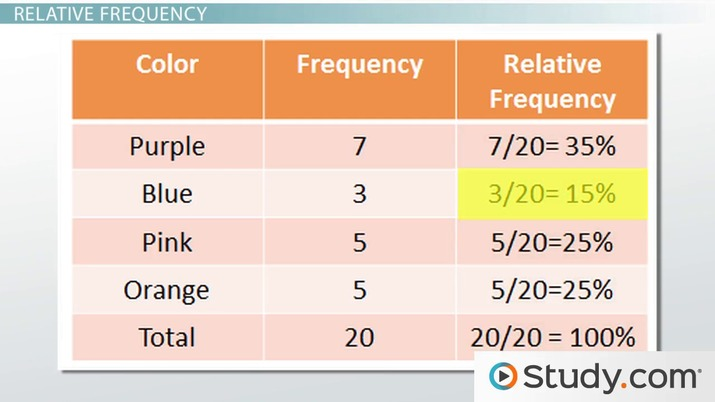
RF = Frequency of singular category / All Frequencies of each category totaled /
(picture is refresher on relative frequency)
Conditional Distribution
Chart that lists the relative frequency of each category of the response variable, given a specific value of the explanatory variable in the contingency table.
EXAMPLE Determining a Conditional Distribution
Construct a conditional distribution of course grade by method of delivery.
Comment on any type of association that may exist between course grade and delivery method.
Traditional | Online | Hybrid | |
A B C D F | 36 52 57 46 46 | 39 55 68 38 54 | 24 66 90 41 31 |
36 + 52 + 57 + 46 + 46 = 237
36/237 = 0.152
Traditional | Online | Hybrid | |
A B C D F | 0.152 0.219 0.241 0.194 0.194 | 0.154 0.217 0.268 0.150 0.213 | 0.095 0.262 0.357 0.163 0.123 |
It appears that students in the hybrid course are more likely to pass (A, B, or C) than the other two methods.
36/237 = 0.152
52/237 = 0.219, and so on…
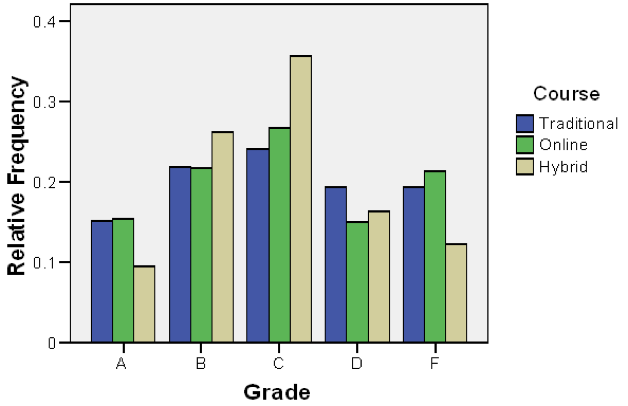
EXAMPLE Conditional Distribution Bar Graph
Using the results of the previous example, create a bar graph that represents the conditional distribution of method of delivery by grade earned.
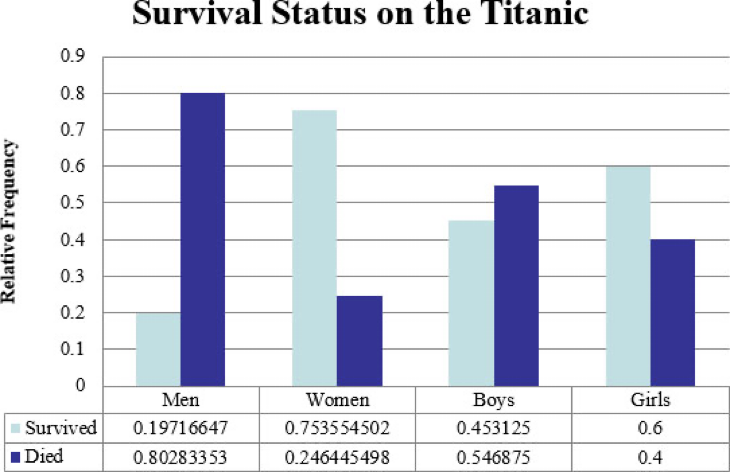
EXAMPLE Conditional Distribution Bar Graph
The following contingency table shows the survival status and demographics of passengers on the ill-fated Titanic.
Men | Women | Boys | Girls | |
Survived | 334 | 318 | 29 | 27 |
Died | 1360 | 104 | 35 | 18 |
Draw a conditional bar graph of survival status by demographic characteristic.