A level Bio 3.4 Mass transport in Animals
1/47
Earn XP
Description and Tags
Name | Mastery | Learn | Test | Matching | Spaced | Call with Kai |
|---|
No analytics yet
Send a link to your students to track their progress
48 Terms
Give the pathway a red blood cell takes when travelling in the human circulatory system from a kidney to the lungs. Do not include descriptions of pressure changes in the heart or the role of heart valves in your answer. (3)
Renal vein (1)
Vena cava to right atrium (1)
Right ventricle to pulmonary artery (1)
Tissue fluid is formed from blood at the arteriole end of a capillary bed. Explain how water from tissue fluid is returned to the circulatory system. (3)
(Plasma) proteins remain (1)
(creates) water potential gradient (1)
Water moves (to blood) by lymphatic system (1)
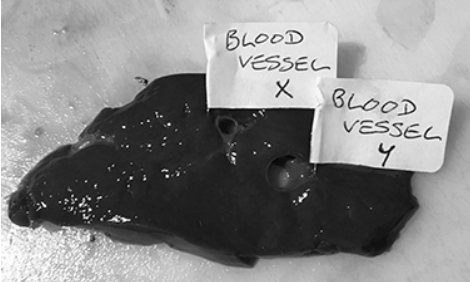
A student dissected an organ from a mammal to observe blood vessels. He dissected a slice of the organ and identified two blood vessels. Figure 1 shows a photograph of his dissection.
Describe two precautions the student should take when clearing away after the dissection. (2)
Put organ/gloves/paper towels in a (separate) bag/bin/tray to dispose (1)
Disinfect instruments/surfaces (1)
Explain how an arteriole can reduce the blood flow into capillaries. (2)
Muscle contracts (1)
Constricts arteriole/lumen (1)
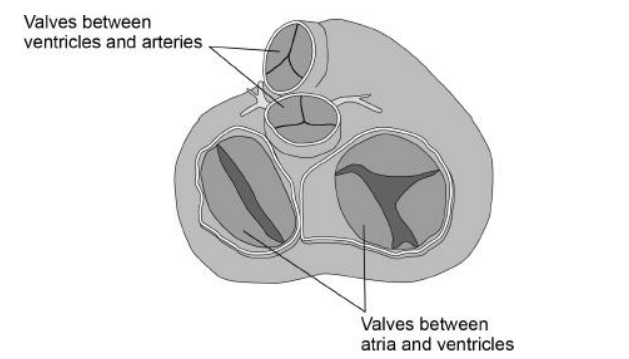
The image below shows heart valves during one stage of a cardiac cycle. Ventricles are visible through the open valves.
What can you conclude from the appearance of valves in the image above about heart muscle activity and blood movement between:
1. ventricles and arteries? (2)
2. atria and ventricles? (2)
(Ventricles and arteries)
Ventricle (muscle) relaxed (1)
No (blood) backflow (into ventricles) (1)
(Atria and ventricles)
Atria (muscle) contracted (1)
Blood movement from atria (into ventricles (1)
Which blood vessel carries blood at the lowest blood pressure
A Capillary
B Pulmonary vein
C Renal vein
D Vena cava (1)
D - Vena cava is a large vein returning blood to the heart (1)

The diagram below shows pressure and blood flow during the cardiac cycle in a dog.
At P on the diagram above, the pressure in the left ventricle is increasing. At this time, the rate of blood flow has not yet started to increase in the aorta. Use evidence from diagram above to explain why (2)
Aortic/semi-lunar valves is closed (1)
Because pressure in aorta higher than in ventricle (1)

The diagram below shows pressure and blood flow during the cardiac cycle in a dog.
At Q on the diagram above there is a small increase in pressure and in rate of blood flow in the aorta. Explain how this happens and its importance (2)
Elastic recoil (of the aorta wall/tissue) (1)
Smooths the blood flow (1)

A student correctly plotted the right ventricle pressure on the same grid as the left ventricle pressure in diagram above.
Describe one way in which the student’s curve would be similar to and one way it would be different from the curve shown in the diagram above. (2)
Peaks/contractions at the same/similar time (1)
Lower pressure (1)
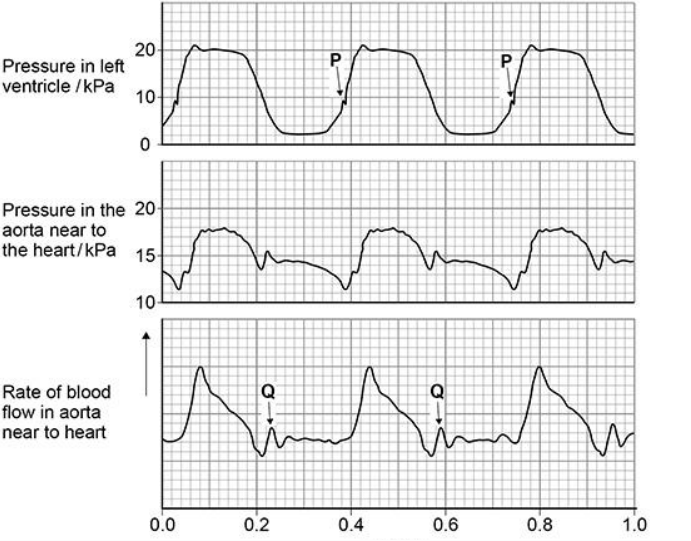
Figure 3 shows pressure and blood flow during the cardiac cycle in a dog.
Use information from Figure 3 to calculate the heart rate of this dog. (1)
Time of one cycle =0.36s=0.006 min
beats per minute =1/0.006=166.67 beats minute-1(1)
Describe the advantage of the Bohr effect during intense exercise. (2)
Increases dissociation of oxygen (1)
For aerobic respiration at the tissues/muscles/cells (1)
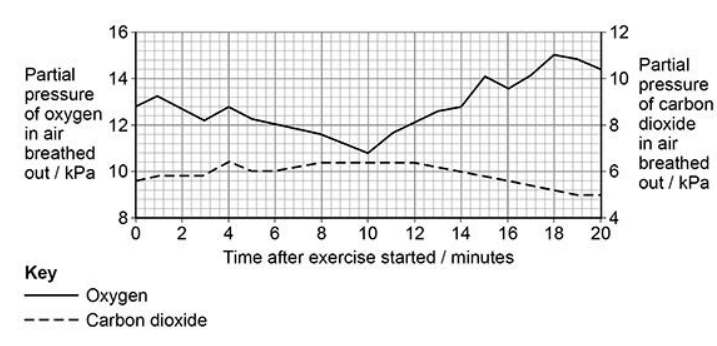
An increase in the intensity of exercise produces an increase in the volume of carbon dioxide produced.
However, the graph above shows that the pCO2 in air breathed out did not show a large increase during the exercise. Suggest one physiological change that would cause this result. Explain how the physiological change would allow for the removal of the increase in the volume of carbon dioxide produced (2)
Increase in breathing (rate) (1)
Similar/same pCO2 per breath, but increased volume per breath (1)
EPO is another performance-enhancing drug. It can increase the haematocrit (the percentage of red blood cells in blood).
A heart attack is caused by a lack of glucose and oxygen being delivered to cardiac muscle via the coronary arteries. The overuse of EPO can increase the risk of a heart attack. Suggest how. (2)
EPO causes blood to thicken (1)
(The thickened blood) could block the coronary arteries (1)
The normal haematocrit for human males is 47(±5)%. For professional male cyclists, the maximum haematocrit allowed is 50%. A student suggested that professional male cyclists should be allowed to use EPO until their haematocrit is 50%. Give two reasons why this suggestion is not valid. (2)
Some cyclists will gain a bigger advantage (1)
there are health risks associated with taking EPO (1)
Describe and explain the effect of increasing carbon dioxide concentration on the dissociation of oxyhaemoglobin. (2)
More dissociation of oxygen (1)
by decreasing blood pH (1)
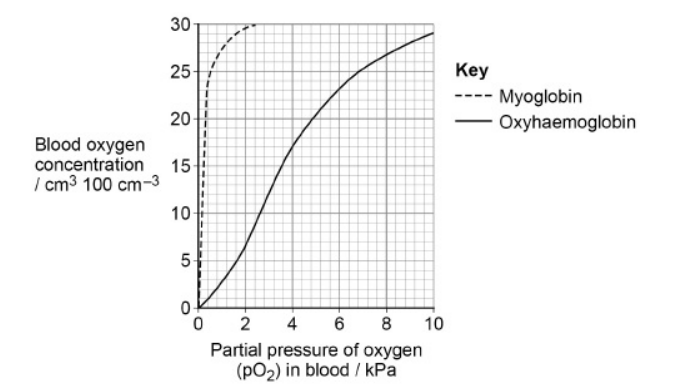
Seals are diving mammals. They fill their lungs with air before they dive and hold their breath during the dive.
The graph shows the dissociation curves for seal oxyhaemoglobin and seal myoglobin. Myoglobin is an oxygen-carrying protein found in muscles.
Use information in the graph to explain how the seal’s myoglobin dissociation curve shows the seal is adapted for diving. (2)
High(er) affinity for O2 (than haemoglobin) (1)
Allows aerobic respiration when diving/at lower pO2 (1)
Explain how valve A in Figure 1 maintains a undirectional flow of blood. (2)
(When) pressure above valve is higher than below valve it opens (1)
Pressure in (left) ventricle/B is higher than in atrium causing valve to close (1)
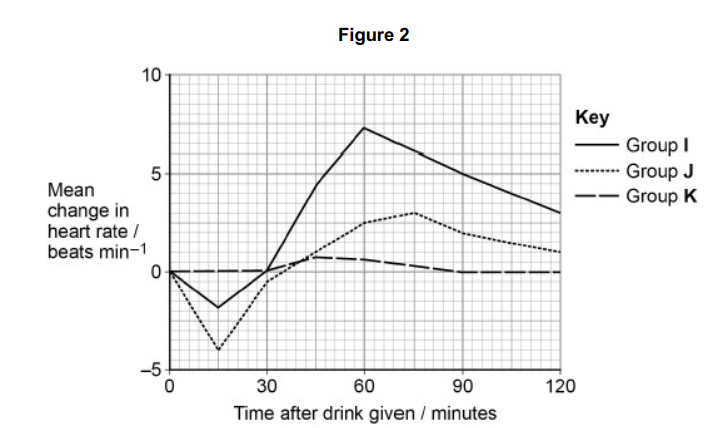
A research scientist investigated the effect of caffeine on heart rate in human
volunteers.
The scientist divided volunteers into three groups. Each group was given the same volume of fluid.
• Each member of Group I was given a sports drink containing caffeine and sugar.
• Each member of Group J was given a sports drink containing caffeine and
no sugar.
• Each member of Group K was given water.
The scientist recorded the volunteers’ heart rate before the drink was given and
for 120 minutes after the drink was given.
Her results can be seen in Figure 2.
The increase seen in Group I could be due to the combination of caffeine and sugar. Suggest one drink to be given to an additional group that should be investigated to find out if this is true. Give a reason for your answer. (2)
Sugar solution (only) (1)
To show sugar alone is not causing the increases in HR (1)
Binding of one molecule of oxygen to haemoglobin makes it easier for a second oxygen molecule to bind.
Explain why (2)
Binding of first oxygen changes tertiary / quaternary (structure) of haemoglobin (1)
Uncovers another binding site (1)
Explain the role of the heart in the formation of tissue fluid (2)
Contraction of ventricle(s) produces high blood / hydrostatic pressure (1)
(This) forces water (and some dissolved substances) out (of blood capillaries) (1)
Lymphoedema is a swelling in the legs which may be caused by a blockage in the lymphatic system. Suggest how a blockage in the lymphatic system could cause lymphoedema. (1)
Excess tissue fluid cannot be (re)absorbed / builds up (1)
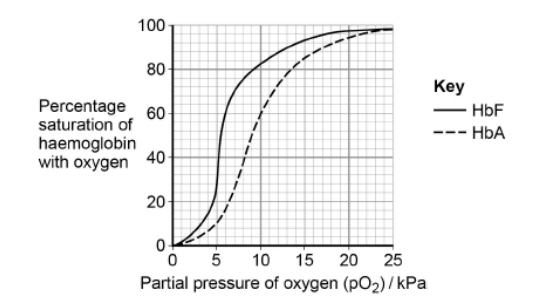
The graph shows the oxyhaemoglobin dissociation curves for fetal haemoglobin (HbF) and adult haemoglobin (HbA).
At birth 98% of the haemoglobin is HbF. By the age of 6 months, the HbF has usually completely disappeared from the baby’s blood and been replaced by HbA.
Use the graph above to explain why this change is an advantage for the baby (2)
(HbA has) lower affinity for O2 at low partial pressures (1)
Easier unloading of O2 for (aerobic) respiration (1)
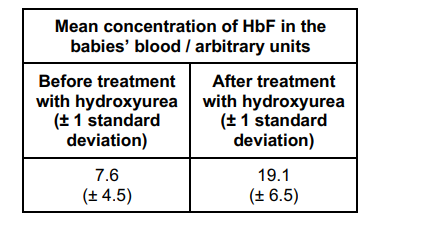
Sickle cell disease (SCD) is caused by production of faulty HbA. This results in a reduced ability to transport oxygen to tissues. Scientists investigated the use of a substance called hydroxyurea to treat babies with SCD.
Hydroxyurea changes the concentration of HbF in the blood. The scientists carried out an investigation with 122 babies who had SCD. Each baby was given hydroxyurea for 41 months. The scientists then found the mean change in the concentration of HbF in the babies’ blood. Their results are shown in the table
The scientists concluded that treatment with hydroxyurea would increase the concentration of oxygen in the blood of babies with SCD. Suggest how the graph and table above support this conclusion (3)
A large/significant increase in HbF (1)
(HbF has) higher affinity for O2 (than faulty HbA) (1)
Higher proportion of HbF in blood so more oxygen carried (1)
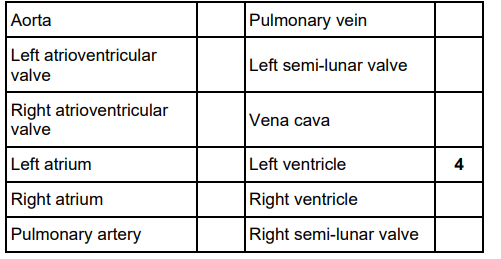
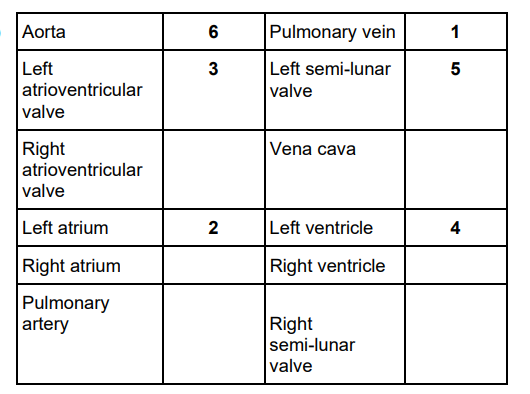
This question is about the flow of blood into and through the heart.
Add the numbers 1 to 6 to the table below to give the order of structures through which blood will pass as it enters the heart and flows through the left ventricle.
Use each number only once. Number 4 has been done for you. (2)
(2)
Name the type of blood vessel that controls blood flow to muscles and explain how these blood vessels change blood flow during exercise. (3)
Arteriole (1)
(Circular/smooth) muscle relaxes (1)
vasodilation increases blood flow (1)
Blood donation involves healthy donors giving blood that can be used to
treat hospital patients.
When donors arrive, the haemoglobin concentration of their blood is tested.
A sample of each donor’s blood is added to a copper sulfate solution to
determine whether the haemoglobin concentration is high enough to donate.
Errors sometimes occur with this test.
Tom has a concentration of haemoglobin high enough to donate.
Lucy has a concentration of haemoglobin too low to donate.
Evaluate the consequences of errors occurring when Tom’s and Lucy’s blood samples are tested. (3)
(Tom)
Healthy donor not allowed to donate (1)
(lucy)
her blood may not help patients (1)
Her (missed) low haemoglobin goes untreated (1)
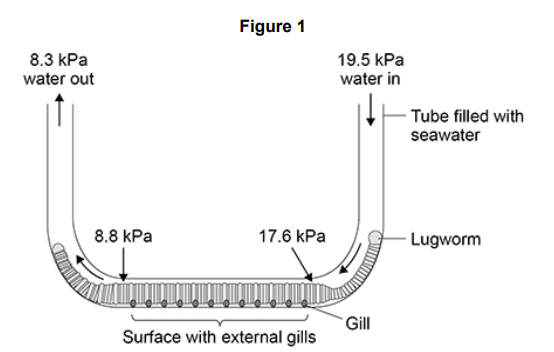
Lugworms create tubes in the sand on seashores. The tubes are filled with seawater.
A scientist measured the partial pressure of dissolved oxygen (pO2) in seawater at different places in a tube with a lugworm inside.
Figure 1 shows her results.
The pO2 of dissolved oxygen in lugworm blood is < 2.7 kPa Using the data in Figure 1, what can you conclude about the uptake of oxygen over the entire body of the lugworm? (4)
Enters by diffusion (1)
Down a concentration gradient (1)
More across parts of body with gills (1)
Gills provide a larger surface area for absorption (1)
The intensity of the red colour in blood is affected by the pO2 of the blood.
The intensity of the colour in a solution is measured using a colorimeter.
The scientist used a colorimeter to measure the intensity of red colour in
samples of lugworm blood with different pO2 values. She prepared a
calibration curve with this information.
Describe how the scientist will use information from the colorimeter and her
calibration curve to determine the pO2 in a sample of lugworm blood.(2)
(Measure light) absorption/transmission (1)
Interpolate/draw line to curve (1)
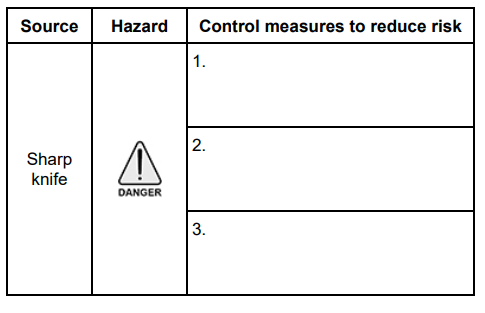
A student dissected a sheep’s heart. He prepared a risk assessment on:
• carrying a scalpel
• using a scalpel.
Complete the table below by giving three control measures the student
must use to reduce the risks associated with carrying and using a scalpel.(2)
Cut onto hard surface
Cut away from body
Disinfect used scalpel as instructed (2)
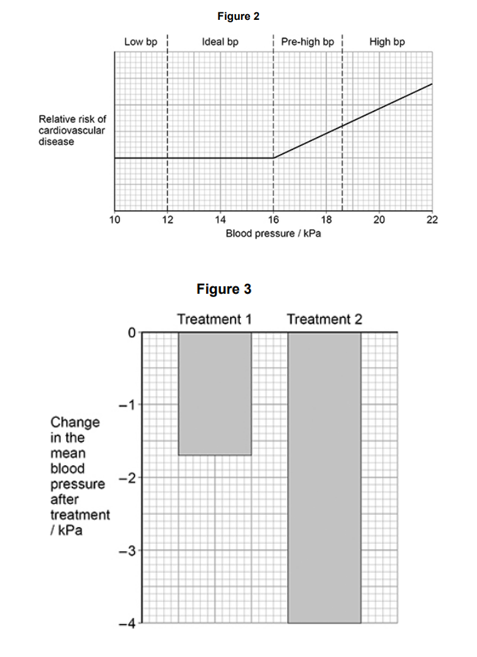
In a separate investigation, a doctor measured the effect of blood pressure medicines on treating a large number of patients with a mean blood pressure of 22 kPa
The doctor used two different treatments.
• Treatment 1 contained one blood pressure medicine.
• Treatment 2 contained three blood pressure medicines.
He measured the change in the mean blood pressure after each treatment in these patients.
Figure 3 shows his results.
Using information in Figure 2 and Figure 3, evaluate the effect of these treatments on reducing the risk of developing cardiovascular disease in patients with a mean blood pressure of 22 kPa (4)
Treatment 2 is more effective (than treatment 1) (1)
Neither treatment achieves low(est) risk (1)
No statistics test so do not know if changes/differences (in bp) are due to chance/are significant (1)
Unknown side effects of treatments (1)
Describe the role of haemoglobin (Hb) in the loading, transport and unloading of oxygen. (5)
(Hb) loads/associates/binds oxygen in the lungs (1)
At high partial pressure of oxygen (1)
Binding of an oxygen (molecule to Hb) makes binding of another oxygen (molecule) easier (1)
(Oxygen transported as) oxyhaemoglobin in red blood cells (1)
(Hb) unloads/dissociates oxygen in the (respiring) cells/tissues (1)
At low partial pressure of oxygen/At high partial pressure of carbon dioxide (1)
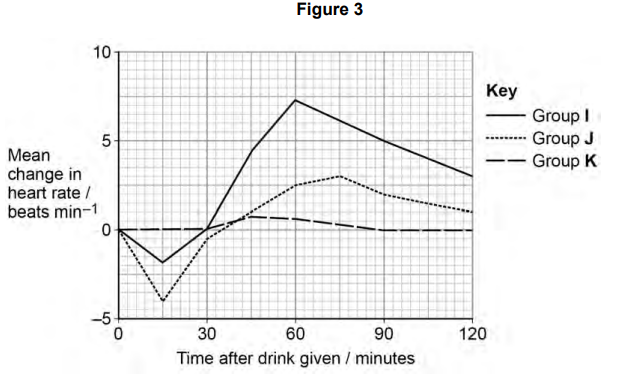
A research scientist investigated the effect of caffeine on heart rate in human box volunteers.
The scientist divided volunteers into three groups. Each group was given the same
volume of fluid.
• Each member of Group I was given a sports drink containing caffeine and sugar.
• Each member of Group J was given a sports drink containing caffeine and no
sugar.
• Each member of Group K was given water.
The scientist recorded the volunteers’ heart rate before the drink was given and for
120 minutes after the drink was given.
Her results can be seen in Figure 3.
Before taking the drink, the mean heart rate of Group J was 68 beats per minute.
Fifteen minutes after taking the drink, the mean volume of blood leaving the hearts of
Group J was 4700 cm3 per minute.
Calculate the mean volume of blood leaving the heart at each beat fifteen minutes
after taking the drink. (1)
New heart rate : 68-4=64bpm
Blood flow per beat = Blood flow in 1 min/heart rate
4700/64= 73.4 (1)
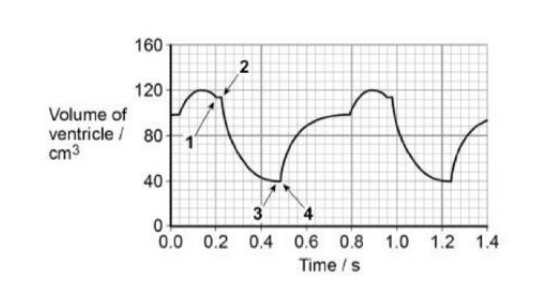
Figure 3 shows the volume changes in the left ventricle of a human heart during two cardiac cycles. The numbers 1, 2, 3 and 4 represent times when heart valves open or close.
Use the information in Figure 3 to complete table 2. Place the number 1, 2, 3 or 4 in the appropriate box.
Valve opens | Valve closes | |
|---|---|---|
Semi-lunar valve | ||
Atrioventricular valve |
(2)
Valve opens | Valve closes | |
|---|---|---|
Semi-lunar valve | 2 | 3 |
Atrioventricular valve | 4 | 1 |
AV valve opens when ventricle is filling up (vol↑ )
closes when ventricle is contracting (vol↓)
SL valve opens when ventricle is contracting and blood is forced out
closes when ventricle is released and begin to fill out

Figure 3 shows the volume changes in the left ventricle of a human heart during two cardiac cycles.
Use the diagram to calculate the volume of blood pumped per minute by the left ventricle. (2)
one cardiac cycle = 1.24-0.48= 0.76
60/0.76= 79 bpm
change in vol= 120-40 = 80
79×80=6315.79
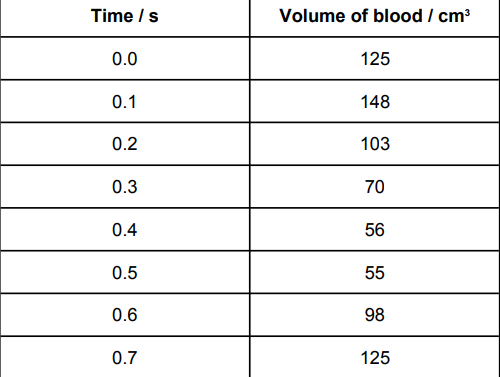
The table shows the volume of blood in a man's right ventricle at different times during one cardiac cycle.
Use the data in the table to calculate the man’s heart rate and cardiac output (3)
one cardiac cycle = 0.7s
Heart rate = 60/0.7= 86 bpm (1)
Stroke volume = end diastolic volume- end systolic volume = 125-55=70
70×86= 6020 (2)

When a stethoscope is placed on the chest wall, sounds are heard as the heart beats. These heart sounds are caused by valves shutting. The diagram shows the heart sounds from a resting person.
The sounds labelled A on the diagram are made by the closing the valves at the entrance to the arteries. What makes the sounds labelled B (1)
AV valve closing (1)
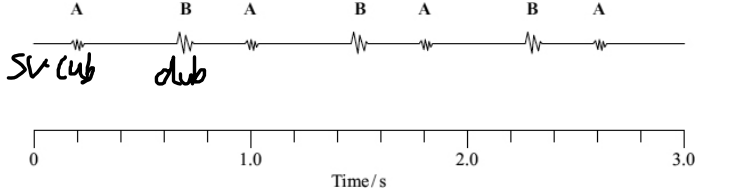
When a stethoscope is placed on the chest wall, sounds are heard as the heart beats. These heart sounds are caused by valves shutting. The diagram shows the heart sounds from a resting person.
Explain what causes the valve to shut when sound A is heard ? (1)
Pressure is greater than in the artery than the ventricles (1)
A ventricular septal defect (VSD) is a common feature of Edwards’ syndrome. A VSD is a hole in the wall between the two ventricles of the heart. A VSD can cause higher blood pressure in the lungs. Explain how a VSD can cause higher blood pressure in the lungs. (2)
More blood moves from left to right ventricle (as left ventricle has thicker muscle) (1)
Greater volume of blood to lungs (1)
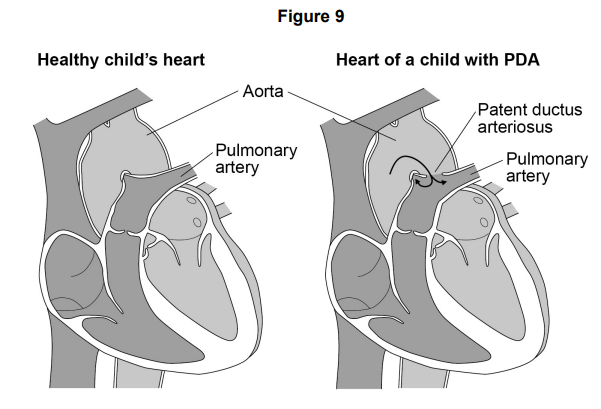
Most children born with Patau syndrome die in the first 12 months, often due to defects of circulation of blood.
One of these defects is patent ductus arteriosus (PDA). This can result in some of the blood flowing between the aorta and the pulmonary artery.
Figure 9 shows a healthy child’s heart and the heart of a child with PDA.
Suggest how the flow of some of the blood between the aorta and pulmonary artery could cause children to die in the first 12 months. (3)
(Some) oxygenated blood (from the aorta) flows into pulmonary artery (1)
So less/not enough oxygen for aerobic respiration (in cell/ tissue/organ) (1)
Tissue/organ doesn’t grow/develop properly (causing death) (1)
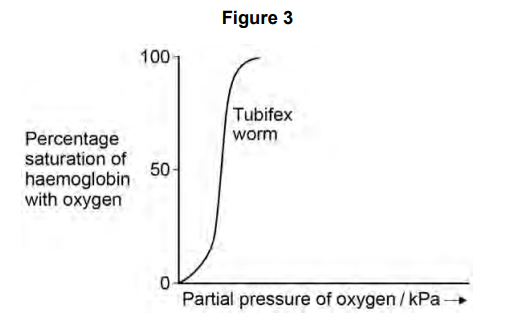
Most species of tubifex worms live at the bottom of ponds, lakes and rivers where the partial pressure of oxygen is low. Pollution of water by sewage can cause the partial pressure of oxygen to fall below 0.2 kPa.
Figure 3 shows the oxyhaemoglobin dissociation curve for a species of tubifex worm found in a river polluted with sewage.
The species of tubifex worm in Figure 3 has 50% saturation of their haemoglobin with oxygen at 0.08 kPa. Explain how this enables this species to survive in water polluted with sewage. (2)
High/50% saturation (with oxygen) below (pO2 of) 0.2 kPa (1)
(Oxygen) for respiration (1)
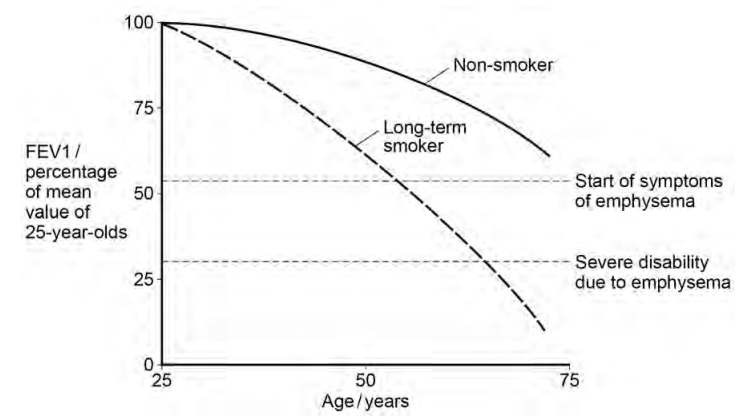
Forced expiration volume (FEV1) is the volume of air a person can breathe out in 1 second.
Emphysema is a lung disease which results in a reduction in FEV1. Emphysema is mainly caused by long-term cigarette smoking.
Scientists investigated the effects of ageing and long-term cigarette smoking on FEV1 and on the development of emphysema.
Figure 7 shows their results.
Scientists determined the mean FEV1 value of 25-year-olds in the population. Suggest two precautions that should have been taken to ensure that this mean FEV1 value was reliable.(2)
Large sample size (1)
Equal number of males and females (1)

Forced expiration volume (FEV1) is the volume of air a person can breathe out in 1 second.
Emphysema is a lung disease which results in a reduction in FEV1. Emphysema is mainly caused by long-term cigarette smoking.
Scientists investigated the effects of ageing and long-term cigarette smoking on FEV1 and on the development of emphysema.
Figure 7 shows their results.
Explain the importance of determining a mean FEV1 value of 25-year-olds in this investigation. (2)
(for) comparison (1)
takes into account anomalous results (1)

Forced expiration volume (FEV1) is the volume of air a person can breathe out in 1 second.
Emphysema is a lung disease which results in a reduction in FEV1. Emphysema is mainly caused by long-term cigarette smoking.
Scientists investigated the effects of ageing and long-term cigarette smoking on FEV1 and on the development of emphysema.
Figure 7 shows their results.
The mean FEV1 value of non-smokers decreases after the age of 30. Use your knowledge of ventilation to suggest why. (1)
internal intercostal muscle(s) less effective (1)
One of the severe disabilities that results from emphysema is that walking upstairs becomes difficult. Explain how a low FEV1 value could cause this disability. (3)
Less carbon dioxide removed (1)
Less oxygen (uptake/in blood) (1)
Less (aerobic) respiration (1)
Some people produce a much higher ventricular blood pressure than normal. This can cause tissue fluid to build up outside the blood capillaries of these people.
Explain why. (2)
More fluid filtered out of the capillary (1)
Less return of fluid (into capillary/blood) due to pressure OR lymphatic system cannot drain away all excess fluid (1)
Some drugs used to reduce high ventricular blood pressure cause widening of blood vessels. Suggest how widening of blood vessels can reduce ventricular blood pressure. (2)
Larger lumen (of blood vessels) (1)
Reduces (blood) pressure (in blood vessels) (1)
Explain how tissue fluid is formed and how it may be returned to the circulatory system. (6)
(hydrostatic) pressure of blood high at arterial end (1)
fluid / water / soluble molecules pass out (1)
proteins/large molecules remain (1)
This lowers the water potential (1)
water moves back into venous end of capillary (reject tissue fluid) by osmosis (1)
lymph system collects any excess tissue fluid which returns to blood / circulatory system (1)
Explain how the heart muscle and the heart valves maintain a one-way flow of blood from the left atrium to the aorta (5)
Atrium has higher pressure than ventricle (due to filling / contraction) causing atrioventricular valves to open (1)
Ventricle has higher pressure than atrium (due to filling / contraction) causing atrioventricular valves to close (1)
Ventricle has higher pressure than aorta causing semilunar valve to open (1)
Higher pressure in aorta than ventricle (as heart relaxes) causing semilunar valve to close (1)
(Muscle / atrial / ventricular) contraction causes increase in pressure (1)