STAT FINAL EXAM DONE UP TO 6.7
1/62
There's no tags or description
Looks like no tags are added yet.
Name | Mastery | Learn | Test | Matching | Spaced | Call with Kai |
|---|
No analytics yet
Send a link to your students to track their progress
63 Terms
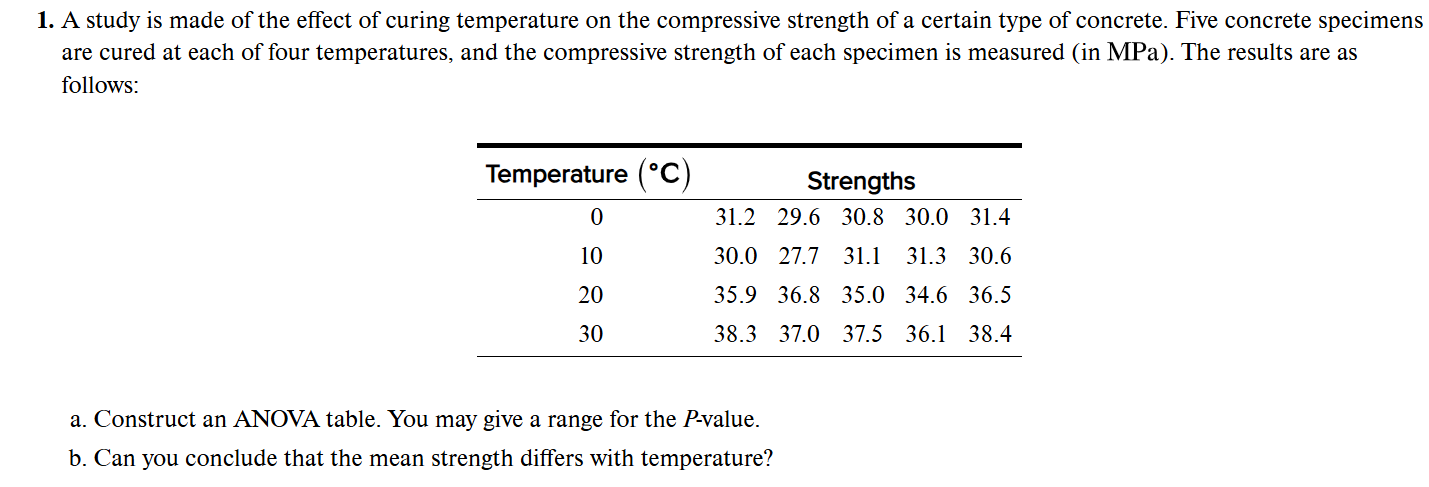
Each of the following processes involves sampling from a population. Define the population, and state whether it is tangible or conceptual.
a. A chemical process is run 15 times, and the yield is measured each time.
b. A pollster samples 1000 registered voters in a certain state and asks them which candidate they support for governor.
c. In a clinical trial to test a new drug that is designed to lower cholesterol, 100 people with high cholesterol levels are recruited to try the new drug.
d. Eight concrete specimens are constructed from a new formulation, and the compressive strength of each is measured.
e. A quality engineer needs to estimate the percentage of bolts manufactured on a certain day that meet a strength specification. At 3:00 in the afternoon he samples the last 100 bolts to be manufactured.
(a) The population consists of all the times the process could be run. It is conceptual.
(b) The population consists of all the registered voters in the state. It is tangible.
(c) The population consists of all people with high cholesterol levels. It is tangible.
(d) The population consists of all concrete specimens that could be made from the new formulation. It is conceptual.
(e) The population consists of all bolts manufactured that day. It is tangible.
True or False
a. A simple random sample is guaranteed to reflect exactly the population from which it was drawn.
b. A simple random sample is free from any systematic tendency to differ from the population from which it was drawn.
(a) False
(b) True
A certain process for manufacturing integrated circuits has been in use for a period of time, and it is known that 12% of the circuits it produces are defective. A new process that is supposed to reduce the proportion of defectives is being tested. In a simple random sample of 100 circuits produced by the new process, 12 were defective.
a. One of the engineers suggests that the test proves that the new process is no better than the old process, since the proportion of defectives in the sample is the same. Is this conclusion justified? Explain.
b. Assume that there had been only 11 defective circuits in the sample of 100. Would this have proven that the new process is better? Explain.
c. Which outcome represents stronger evidence that the new process is better: finding 11 defective circuits in the sample, or finding 2 defective circuits in the sample?
(a) No. What is important is the population proportion of defectives; the sample proportion is only an approximation. The population proportion for the new process may in fact be greater or less than that of the old process.
(b) No. The population proportion for the new process may be 12% or more, even though the sample proportion was only 11%.
(c) Finding 2 defective circuits in the sample.
A vendor converts the weights on the packages she sends out from pounds to kilograms a. How does this affect the mean weight of the packages? b. How does this affect the standard deviation of the weights?
(a) The mean will be divided by 2.2. (b) The standard deviation will be divided by 2.2
True or false: For any list of numbers, half of them will be below the mean.
False
In a sample of 20 men, the mean height was 178 cm. In a sample of 30 women, the mean height was 164 cm. What was the mean height for both groups put together?
169.6 cm.
Let S be the event that a randomly selected college student has taken a statistics course, and let C be the event that the same student has taken a chemistry course. Suppose P(S) = 0.4, P(C) = 0.3 and P(S int C) = 0.2.
a. Find the probability that a student has taken statistics, chemistry, or both.
b. Find the probability that a student has taken neither statistics nor chemistry.
c. Find the probability that a student has taken statistics but not chemistry.
(a) 0.5 (b) 0.5 (c) 0.2
Suppose that start-up companies in the area of biotechnology have probability 0.2 of becoming profitable and that those in the area of information technology have probability 0.15 of becoming profitable. A venture capitalist invests in one firm of each type. Assume the companies function independently.
a. What is the probability that both companies become profitable?
b. What is the probability that neither company becomes profitable?
c. What is the probability that at least one of the two companies becomes profitable?
(a) 0.03 (b) 0.68 (c) 0.32
A box contains 15 resistors. Ten of them are labeled 50O and the other five are labeled 100O. Two resistors are selected at random. Answer a. What is the probability that the first resistor is 100O? b. What is the probability that the second resistor is 100O, given that the first resistor is 50O? c. What is the probability that the second resistor is 100O, given that the first resistor is 100O?
(a) 1/3 (b) 5/14 (c) 2/7
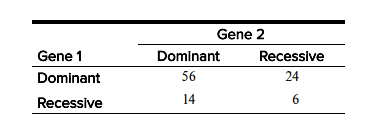
A geneticist is studying two genes. Each gene can be either dominant or recessive. A sample of 100 individuals is categorized as follows.
a. What is the probability that in a randomly sampled individual, Gene 1 is dominant?
b. What is the probability that in a randomly sampled individual, Gene 2 is dominant?
c. Given that Gene 1 is dominant, what is the probability that Gene 2 is dominant?
d. These genes are said to be in linkage equilibrium if the event that Gene 1 is dominant is independent of the event that Gene 2 is dominant. Are these genes in linkage equilibrium?
(a) 0.8 (b) 0.7 (c) 0.7 (d) Yes
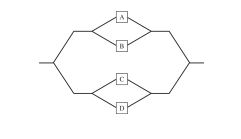
A system consists of four components connected as shown in the following diagram:
Assume A, B, C, and D function independently. If the probabilities that A, B, C, and D fail are 0.1, 0.2, 0.05, and 0.3, respectively, what is the probability that the system functions?
0.9997
A system contains two components, C and D, connected in parallel as shown in the diagram. Assume C and D function independently. For the system to function, either C or D must function
a. If the probability that C fails is 0.08 and the probability that D fails is 0.12, find the probability that the system functions.
b. If both C and D have probability p of failing, what must the value of p be so that the probability that the system functions is 0.99?
c. If three components are connected in parallel, function independently, and each has probability p of failing, what must the value of p be so that the probability that the system functions is 0.99?
d. If components function independently, and each component has probability 0.5 of failing, what is the minimum number of components that must be connected in parallel so that the probability that the system functions is at least 0.99?
(a) 0.9904 (b) 0.1 (c) 0.2154 (d) 7
Determine whether each of the following random variables is discrete or continuous.
a. The number of heads in 100 tosses of a coin.
b. The length of a rod randomly chosen from a day’s production.
c. The final exam score of a randomly chosen student from last semester’s engineering statistics class.
d. The age of a randomly chosen Colorado School of Mines student.
e. The age that a randomly chosen Colorado School of Mines student will be on his or her next birthday
(a) Discrete (b) Continuous (c) Discrete (d) Continuous (e) Discrete
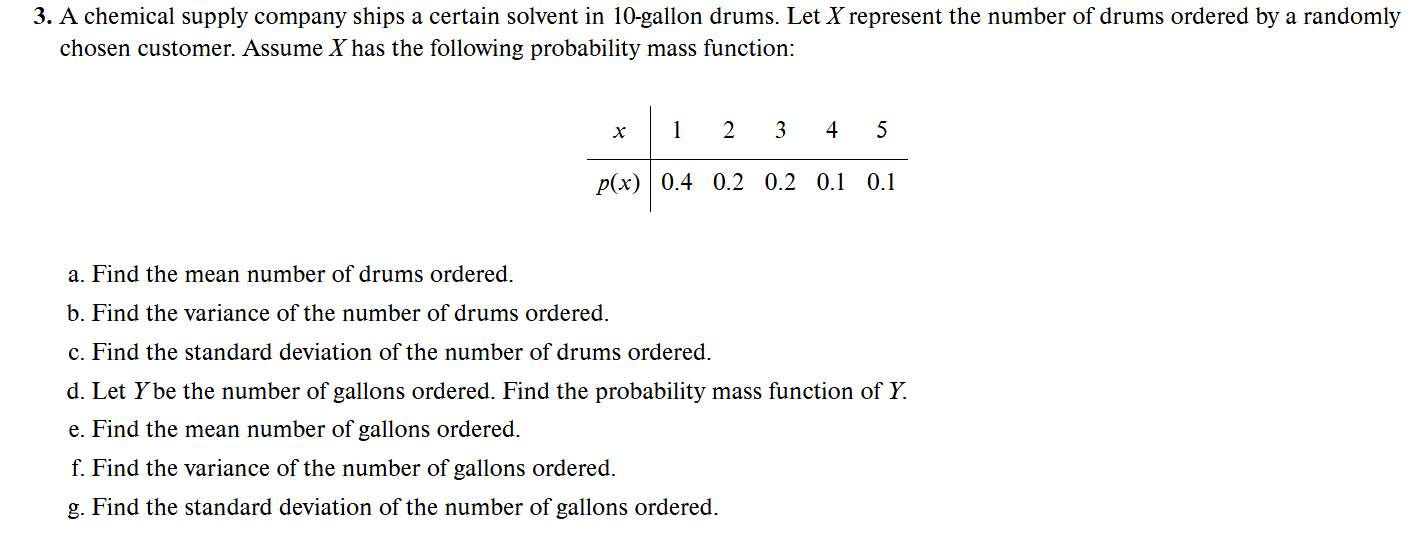
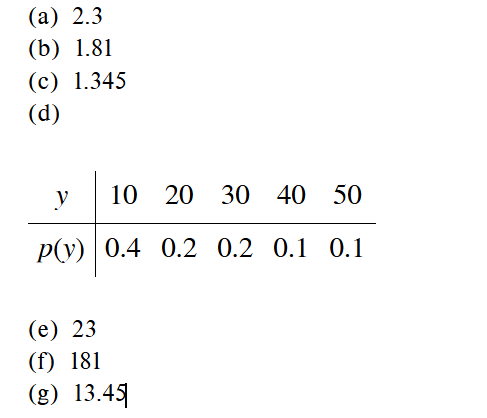
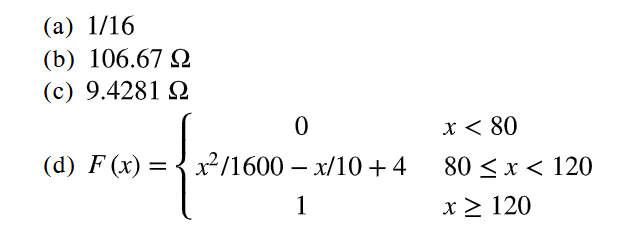
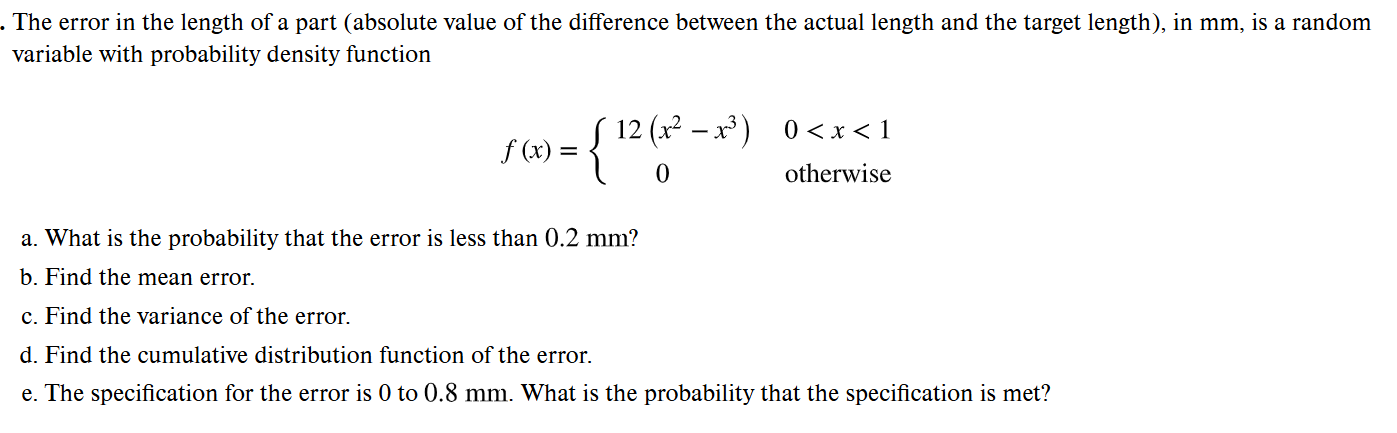
(a) 2 (b) 0.09 (c) 0.147 (d) 0.21 (e) 0.1323
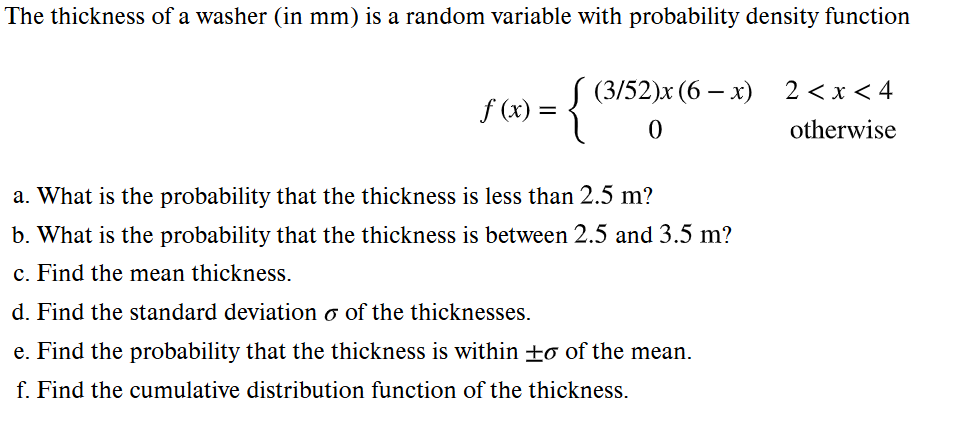
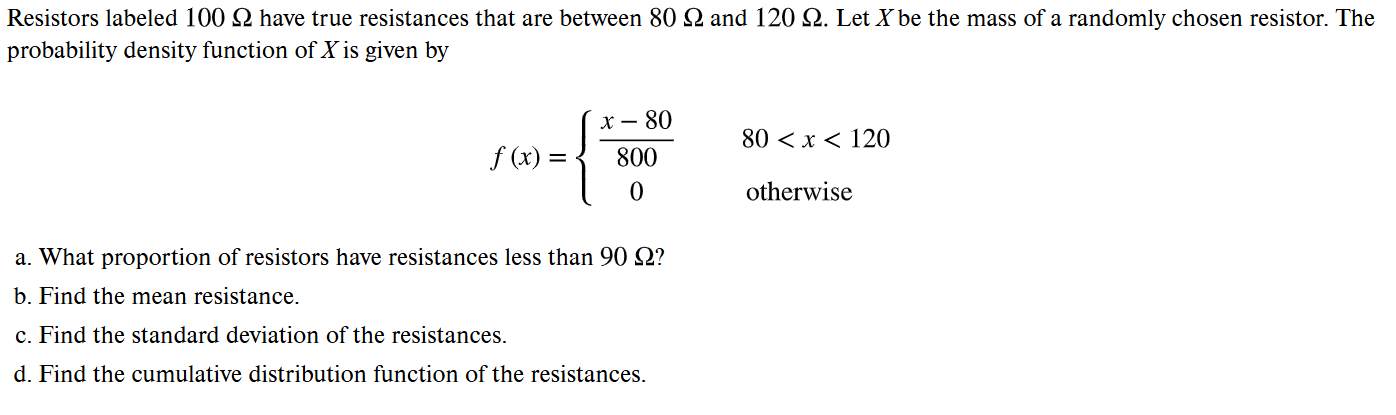
(a) 0.2428 (b) 0.5144 (c) 3 (d) 0.5684 (e) 0.5832
Let X~Bin(7,0.3), find:
a. P(X=1)
b. P(X=2)
c. P(X<1)
d. P(X>4)
e. The mean value
f. The varience
(a) 0.247 (b) 0.318 (c) 0.0824 (d) 0.0288 (e) 2.1 (f) 1.47
Of all the weld failures in a certain assembly, 85% of them occur in the weld metal itself, and the remaining 15% occur in the base metal. A sample of 20 weld failures is examined.
a. What is the probability that exactly five of them are base metal failures?
b. What is the probability that fewer than four of them are base metal failures?
c. What is the probability that none of them are base metal failures?
d. Find the mean number of base metal failures.
e. Find the standard deviation of the number of base metal failures.
(a) 0.1028 (b) 0.6477 (c) 0.0388 (d) 3 (e) 1.597
A fair coin is tossed eight times.
a. What is the probability of obtaining exactly five heads?
b. Find the mean number of heads obtained.
c. Find the variance of the number of heads obtained.
d. Find the standard deviation of the number of heads obtained
(a) 0.21875 (b) 4 (c) 2 (d) 1.414
Several million lottery tickets are sold, and 60% of the tickets are held by women. Five winning tickets will be drawn at random.
a. What is the probability that three or fewer of the winners will be women?
b. What is the probability that three of the winners will be of one gender and two of the winners will be of the other gender?
(a) 0.6630 (b) 0.5760
A certain large shipment comes with a guarantee that it contains no more than 15% defective items. If the proportion of defective items in the shipment is greater than 15%, the shipment may be returned. You draw a random sample of 10 items. Let X be the number of defective items in the sample.
a. If in fact 15% of the items in the shipment are defective (so that the shipment is good, but just barely), what is P(X>=7)?
b. Based on the answer to part (a), if 15% of the items in the shipment are defective, would 7 defectives in a sample of size 10 be an unusually large number?
c. If you found that 7 of the 10 sample items were defective, would this be convincing evidence that the shipment should be returned? Explain.
d. If in fact 15% of the items in the shipment are defective, what is P(X>=2)?
e. Based on the answer to part (d), if 15% of the items in the shipment are defective, would 2 defectives in a sample of size 10 be an unusually large number?
f. If you found that 2 of the 10 sample items were defective, would this be convincing evidence that the shipment should be returned?
(a) 1.346×10^-4
(b) Yes, only about 13 or 14 out of every 100,000 samples of size 10 would have 7 or more defective items.
(c) Yes, because 7 defectives in a sample of size 10 is an unusually large number for a good shipment. (d) 0.4557
(e) No, in about 45% of the samples of size 10, 2 or more items would be defective.
(f) No, because 2 defectives in a sample of size 10 is not an unusually large number for a good shipment.
Bottles filled by a certain machine are supposed to contain 12 oz of liquid. In fact, the fill volume is random, with mean 12.01 oz and standard deviation 0.2 oz.
a. What is the probability that the mean volume of a random sample of 144 bottles is less than 12 oz? b. If the population mean fill volume is increased to 12.03 oz, what is the probability that the mean volume of a sample of size 144 will be less than 12 oz?
(a) 0.2743 (b) 0.0359
The time spent by a customer at a checkout counter has mean 4 minutes and standard deviation 2 minutes.
a. What is the probability that the total time taken by a random sample of 50 customers is less than 180 minutes?
b. Find the 30th percentile of the total time taken by 50 customers
(a) 0.0793 (b) 192.6 minutes
In a process that manufactures bearings, 90% of the bearings meet a thickness specification. In a sample of 500 bearings, what is the probability that more than 440 meet the specification?
0.9222
Bags checked for a certain airline flight have a mean weight of 15 kg with a standard deviation of 5 kg. A random sample of 60 bags is drawn.
a. What is the probability that the sample mean weight is less than 14 kg?
b. Find the 70th percentile of the sample mean weights.
c. How many bags must be sampled so that the probability is 0.01 that the sample mean weight is less than 14 kg?
(a) 0.0606 (b)15.34 (c) 136
DO NOT NEED
The concentration of particles in a suspension is 50 per mL. A 5-mL volume of the suspension is withdrawn.
a. What is the probability that the number of particles withdrawn will be between 235 and 265?
b. What is the probability that the average number of particles per mL in the withdrawn sample is between 48 and 52?
c. If a 10-mL sample is withdrawn, what is the probability that the average number per mL of particles in the withdrawn sample is between 48 and 52?
d. How large a sample must be withdrawn so that the average number of particles per mL in the sample is between 48 and 52 with probability 95%?
(a) 0.6578 (b) 0.4714 (c) 0.6266 (d) 48.02 mL
Choose the best answer to fill in the blank. If an estimator is unbiased, then ________________
i. the estimator is equal to the true value.
ii. the estimator is usually close to the true value.
iii. the mean of the estimator is equal to the true value.
iv. the mean of the estimator is usually close to the true value
iii
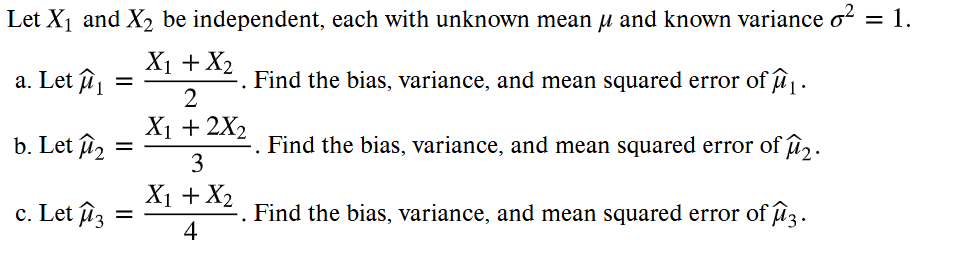
(a) Bias = 0, Var = 1/2 , MSE = ½
(b) Bias = 0, Var = 5/9 , MSE = 5/9
(c) Bias = 0, Var = 1/8 , MSE = ¼ mu²/4 + 1/8
As the confidence level goes up, the reliability goes ________, and the precision goes _______. Options: up, down.
Up, down
A sample of 114 patients were given a drug to lower cholesterol. A 95% confidence interval for the mean reduction in cholesterol (in mmol/L) was (0.88,1.02)
a. What was the sample mean reduction? b. What was the sample standard deviation of the reduction amounts?
(a) 0.95 (b) 0.3813
In a sample of 100 steel canisters, the mean wall thickness was 8.1mm with a standard deviation of 0.5mm.
a.Find a 95% confidence interval for the mean wall thickness of this type of canister.
b. Find a 99% confidence interval for the mean wall thickness of this type of canister.
c. An engineer claims that the mean thickness is between 8.02 and 8.18 With what level of confidence can this statement be made?
d. How many canisters must be sampled so that a 95% confidence interval will specify the mean wall thickness to within 0.08 mm?
e. How many canisters must be sampled so that a 99% confidence interval will specify the mean wall thickness to within 0.08 mm?
(a) (8.002, 8.198) (b) (7.971, 8.229) (c) 89.04% (d) 151 (e) 261
In a sample of 80 light bulbs, the mean lifetime was 1217 hours with a standard deviation of 52 hours. a. Find a 95% confidence interval for the mean lifetime of this type of light bulb.
b. Find a 98% confidence interval for the mean lifetime of this type of light bulb.
c. An engineer claims that the mean lifetime is between 1208 and 1226 hours. With what level of confidence can this statement be made?
d. How many light bulbs must be sampled so that a 95% confidence interval will specify the mean lifetime to within 8 hours?
e. How many light bulbs must be sampled so that a 98% confidence interval will specify the mean lifetime to within 8 hours?
(a) (1205.6, 1228.4) (b) (1202.0, 1232.0) (c) 87.88% (d) 163 (e) 230
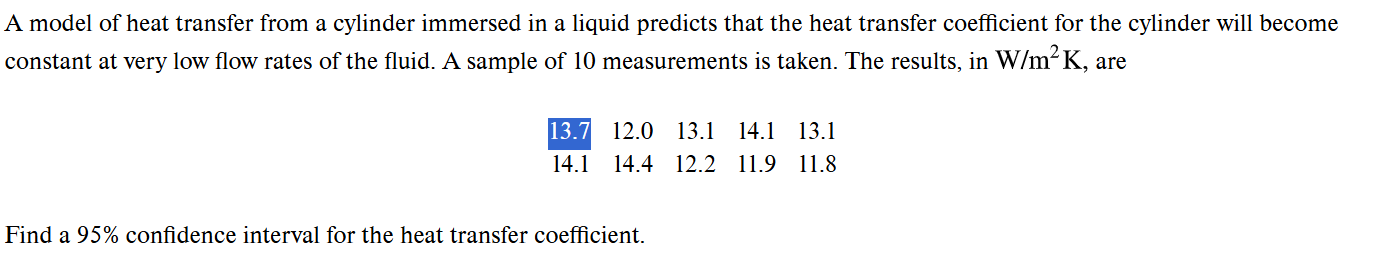
(12.318, 13.762)

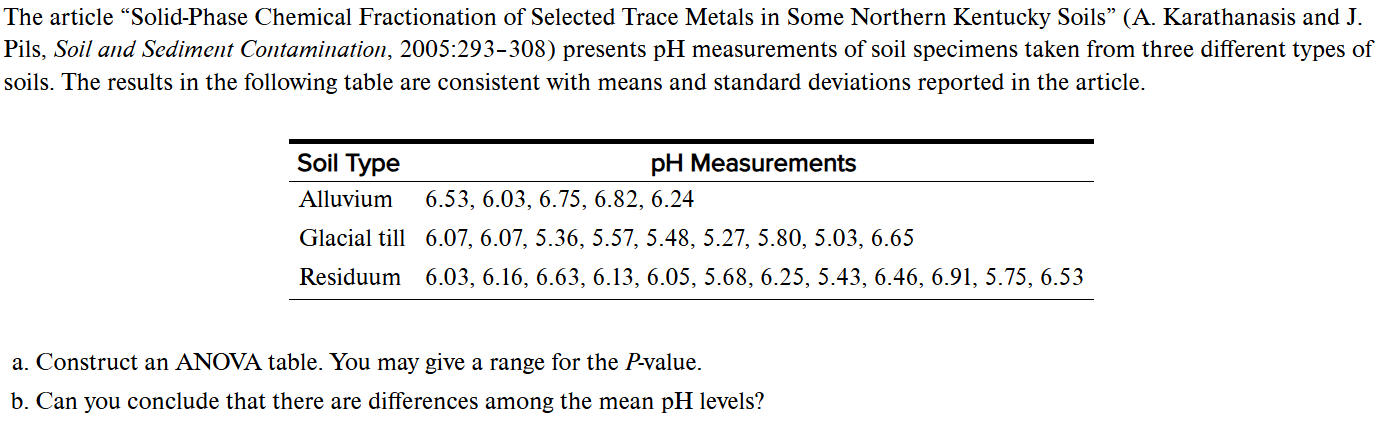
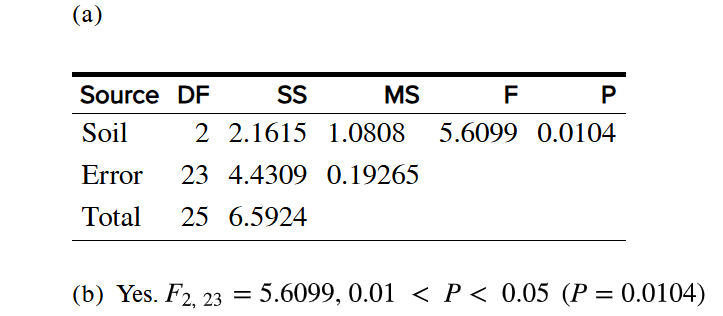
The article “Ozone for Removal of Acute Toxicity from Logyard Run-off” (M. Zenaitis and S. Duff, Ozone Science and Engineering, 2002:83–90) presents chemical analyses of runoff water from sawmills in British Columbia. Included were measurements of pH for six water specimens: 5.9, 5.0, 6.5, 5.6, 5.9, 6.5. Assuming these to be a random sample of water specimens from an approximately normal population, find a 95% confidence interval for the mean pH.
(5.303, 6.497)
Ten samples of coal from a Northern Appalachian source had an average mercury content of 0.242 ppm with a standard deviation of 0.031 ppm. Find a 95% confidence for the mean mercury content of coal from this source.
(0.2198, 0.2642)
(0.2198, 0.2642)
Recently, many companies have been experimenting with telecommuting, allowing employees to work at home on their computers. Among other things, telecommuting is supposed to reduce the number of sick days taken. Suppose that at one firm, it is known that over the past few years employees have taken a mean of 5.4 sick days. This year, the firm introduces telecommuting. Management chooses a simple random sample of 80 employees to follow in detail, and, at the end of the year, these employees average 4.5 sick days with a standard deviation of 2.7 days. Let U represent the mean number of sick days for all employees of the firm.
a. Find the P-value for testing H0: U <= 2.5 versus H1: U>2.5
b. Either the mean number of sick days has declined since the introduction of telecommuting, or the sample is in the most extreme ________% of its distribution.
0.0014
0.14
Fill in the blank: If the null hypothesis is H0: U <= 4 then the mean of under the null distribution is ____ i. 0
ii. 4
iii. Any number less than or equal to 4
iv. We can’t tell unless we know H1
ii
1. For which P-value is the null hypothesis more plausible: P = 0.10 or P = 0.01
P = 0.10
If FIX which is the best conclusion?
i.H0 is definitely false.
ii. H0 is definitely true.
iii. H0 There is a 1% probability that is true.
iv.H0 might be true, but it’s unlikely.
v.H0 might be false, but it’s unlikely.
vi.H0 is plausible.
iv
True or false: If then P = 0.02
a. The result is statistically significant at the 5% level.
b. The result is statistically significant at the 1% level.
c. The null hypothesis is rejected at the 5% level.
d. The null hypothesis is rejected at the 1% level.
(a) True (b) False (c) True (d) False
Scores on a certain IQ test are known to have a mean of 100. A random sample of 60 students attend a series of coaching classes before taking the test. Let be the population mean IQ score that would occur if every student took the coaching classes. The classes are successful if U > 100 A test is made of the hypotheses H0: U<= 100 versus H1: U>100. Consider three possible conclusions: (i) The classes are successful. (ii) The classes are not successful. (iii) The classes might not be successful
a. Which of the three conclusions is best if is rejected?
b. Which of the three conclusions is best if is not rejected?
i, iii
In each of the following situations, state the most appropriate null hypothesis regarding the population mean
a. A new type of battery will be installed in heart pacemakers if it can be shown to have a mean lifetime greater than 8 years.
b. A new material for manufacturing tires will be used if it can be shown that the mean lifetime of tires will be more than 60,000 miles.
c. A quality control inspector will recalibrate a flowmeter if the mean flow rate differs from 10 mL/s
H0∶μ≤8
H0∶𝜇≤60,000
H0: μ≤ 10mL/s
Gravel pieces are classified as small, medium, or large. A vendor claims that at least 10% of the gravel pieces from her plant are large. In a random sample of 1600 pieces, 130 pieces were classified as large. Is this enough evidence to reject the claim?
Yes, P = 0.0062
Do bathroom scales tend to underestimate a person’s true weight? A 150 test weight was placed on each of 50 bathroom scales. The readings on 29 of the scales were too light, and the readings on the other 21 were too heavy. Can you conclude that more than half of bathroom scales underestimate weight?
No, P = 0.1292
In a survey of 500 residents in a certain town, 274 said they were opposed to constructing a new shopping mall. Can you conclude that more than half of the residents in this town are opposed to constructing a new shopping mall?
Yes, P = 0.0158
The article “Developing a Tool to Measure the Factors Influencing Nurses’ Enjoyment of Nursing” (L. Wilkes, M. Doull, et al., Journal of Clinical Nursing, 2016:1854–1860) reports that in a sample of 124 nurses, 54 said that a busy workload had a positive effect on their enjoyment of their job. Can you conclude that less than 45% of nurses feel that a busy workload has a positive effect on their enjoyment of their job?
No, P = 0.3745
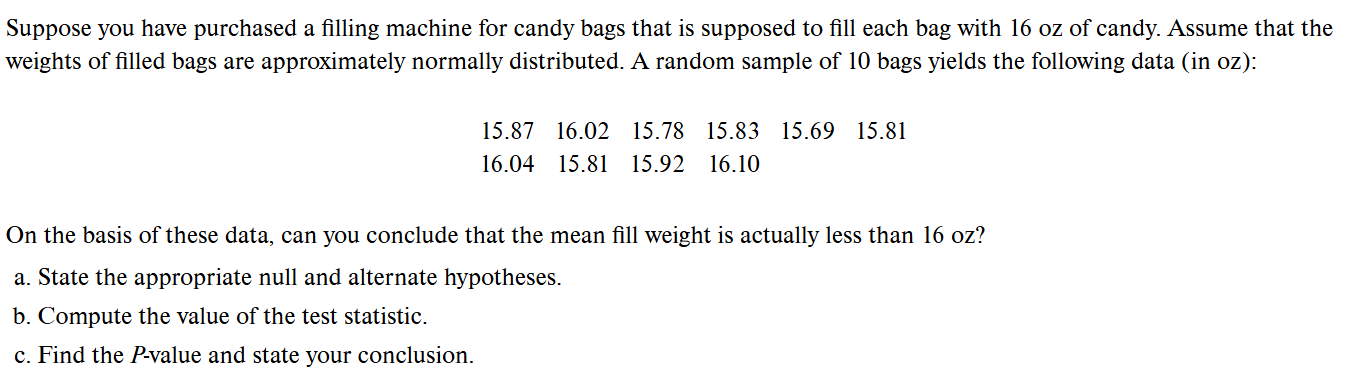
Null Hypothesis (H₀): μ = 16 oz Alternate Hypothesis (Hₐ): μ < 16 oz. t = -2.74 (Based on Sample Mean = 15.887 and Sample Std Dev = 0.1305). 0.01<P<0.025 Conclusion: Reject the null hypothesis. There is sufficient evidence to conclude that the mean fill weight is less than 16 oz.
A test has power 0.85 when U = 10 True or false:
a. The probability of rejecting H0 when is 0.85.
b. The probability of making a correct decision when U = 10 is 0.85.
c. The probability of making a correct decision when U = 10 is 0.15.
d. The probability that H0 is true when U = 10 is 0.15
(a) True (b) True (c) False (d) False
If the sample size remains the same, and the level α increases, then the power will ________. Options: increase, decrease
increase
A power calculation has shown that if U = 10 the power of a test H0: U <= 8 of versus H1: U > 8 is 0.80. If instead U = 12, which one of the following statements is true?
i. The power of the test will be less than 0.80.
ii. The power of the test will be greater than 0.80.
iii. We cannot determine the power of the test without specifying the population standard deviation σ
ii. The power of the test will be greater than 0.80.
The article “Automatic Filtering of Outliers in RR Intervals Before Analysis of Heart Rate Variability in Holter Recordings: a Comparison with Carefully Edited Data” (M. Karlsson, et al., Biomedical Engineering Online, 2012) reports measurements of the total power, on the log scale, of the heart rate variability, in the frequency range 0.003 to 0.4 Hz, for a group of 40 patients aged 25–49 years and for a group of 43 patients aged 50–75 years. The mean for the patients aged 25–49 years was 3.64 with a standard deviation of 0.23, and the mean for the patients aged 50–75 years was 3.40 with a standard deviation of 0.28. Find a 95% confidence interval for the difference in mean power between the two age groups
(0.1301, 0.3499)
The article “Effects of Diets with Whole Plant-Origin Proteins Added with Different Ratios of Taurine:Methionine on the Growth, Macrophage Activity and Antioxidant Capacity of Rainbow Trout (Oncorhynchus mykiss) Fingerlings” (O. Hernandez, L. Hernandez, et al., Veterinary and Animal Science, 2017:4–9) reports that a sample of 210 juvenile rainbow trout fed a diet fortified with equal amounts of the amino acids taurine and methionine for a period of 70 days had a mean weight gain of 313 percent with a standard deviation of 25, while 210 fish fed with a control diet had a mean weight gain of 233 percent with a standard deviation of 19. Units are percent. Find a 99% confidence interval for the difference in weight gain on the two diets.
(74.41, 85.59)
The article “The Prevalence of Daytime Napping and Its Relationship to Nighttime Sleep” (J. Pilcher, K. Michalkowski, and R. Carrigan), Behavioral Medicine, 2001:71–76) presents results of a study of sleep habits in a large number of subjects. In a sample of 87 young adults, the average time per day spent in bed (either awake or asleep) was 7.70 hours, with a standard deviation of 1.02 hours, and the average time spent in bed asleep was 7.06 hours, with a standard deviation of 1.11 hours. The mean time spent in bed awake was estimated to be 7.7-7.06 hours. Is it possible to compute a 95% confidence interval for the mean time spent in bed awake? If so, construct the confidence interval. If not possible, explain why not.