Principles of Macroeconomics: Supply, Demand, and Elasticity
1/311
There's no tags or description
Looks like no tags are added yet.
Name | Mastery | Learn | Test | Matching | Spaced |
|---|
No study sessions yet.
312 Terms
Circular Flow Diagram
Explains the economy by showing how money and goods flow between households and firms.
Production Possibilities Frontier
Illustrates aggregate production and shows the maximum feasible amount of two goods that can be produced with available resources.
Allocative Efficiency
Occurs when resources are distributed in a way that maximizes the total benefit received by all members of society.
Productive Efficiency
Achieved when goods are produced at the lowest possible cost.
Opportunity Cost
The value of the next best alternative that is forgone when making a decision.
Shifts in Production Possibilities Frontier
Caused by changes in resources, technology, or economic conditions.
Economist as Policy Adviser
When an economist provides recommendations based on economic theories and data.
Economist as Scientist
When an economist analyzes data and develops theories to understand economic phenomena.
Disagreement Among Economists
Arises from differences in assumptions, interpretations of data, or theoretical perspectives.
Calculating Slopes
The rate of change of one variable in relation to another.
Establishing Causality
Determining whether a change in one variable directly causes a change in another variable.
Scientific Method
A systematic approach to developing and testing theories about how the world works.
Natural Experiments
Historical events that can be analyzed to understand economic principles.
Macroeconomic Models
Quantitative models used to simulate economic scenarios and test theories.
Role of Assumptions
To simplify complex realities and aid in understanding economic questions.
Economic Models
Simplified descriptions of complex realities, often represented by diagrams and equations.
Revision of Economic Models
Economic models are subject to change as new data and theories emerge.
Data Collection in Economics
The process of gathering information to verify or refute economic theories.
Theories in Economics
Conceptual frameworks developed to explain economic behaviors and relationships.
Essence of Science
The scientific method, which involves observation, theory development, and further observation.
Complex World Simplification
Using assumptions to make complex economic concepts easier to understand.
Different Assumptions
Economists use various assumptions based on the questions they are addressing.
Time Horizons in Economics
Different time frames that can affect economic analysis and assumptions.
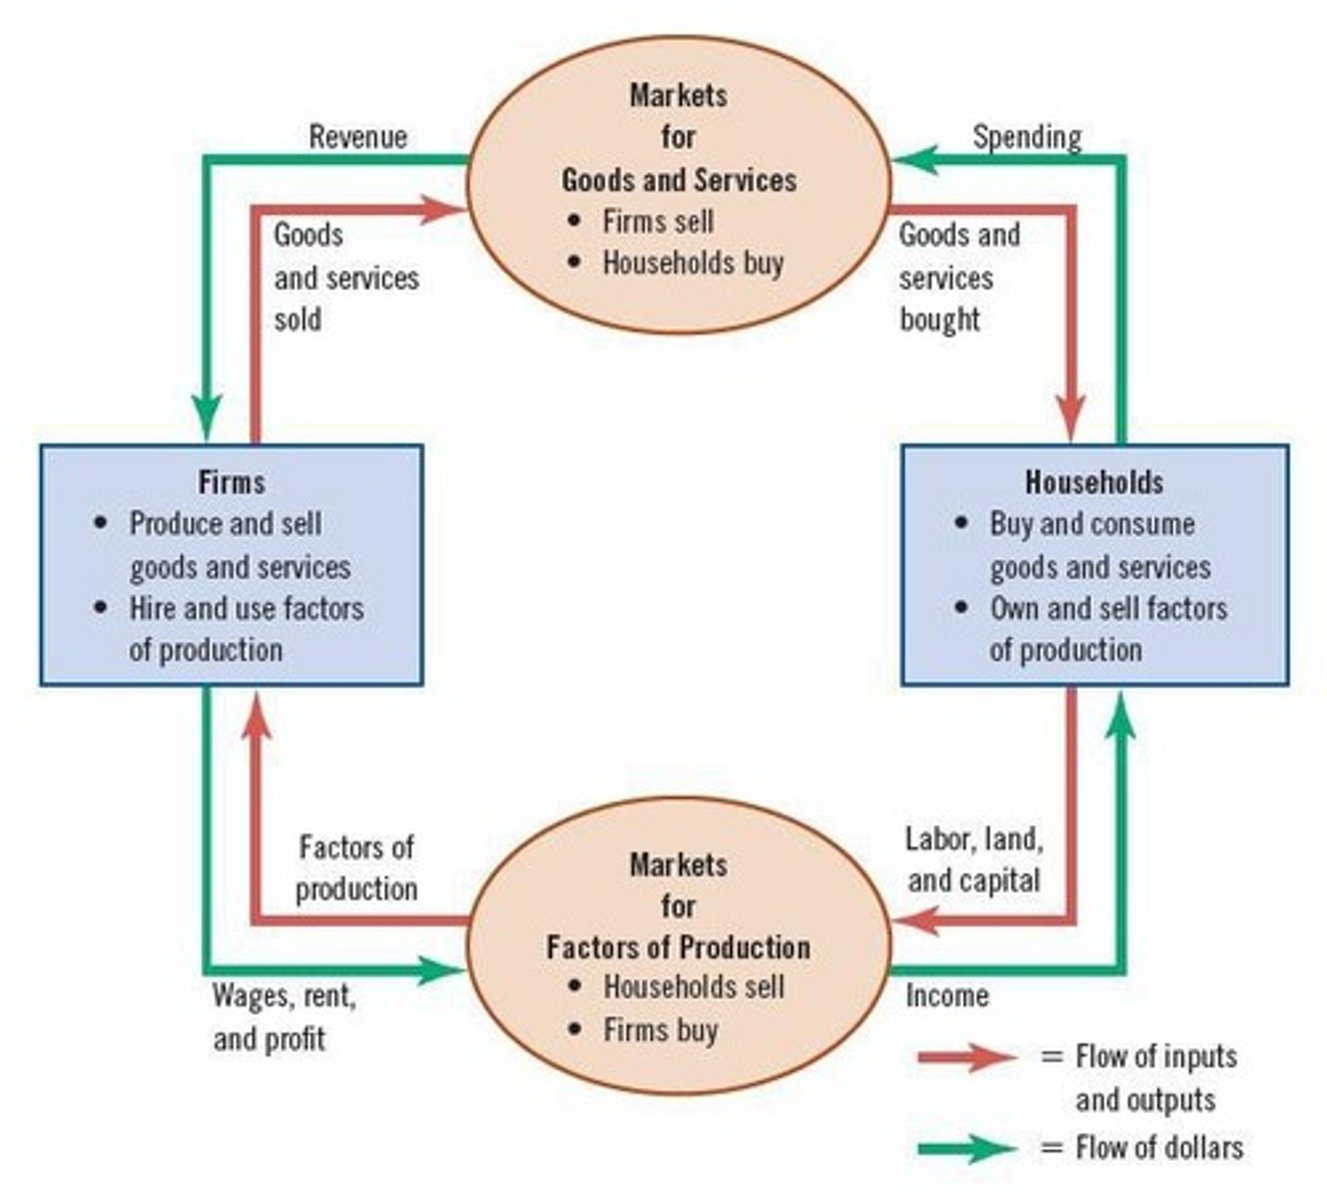
Circular-flow diagram
Visual model of the economy that shows how dollars and goods/services flow through markets among households and firms.
Firms
Entities that produce goods and services (outputs) and use factors of production (inputs).
Households
Entities that own factors of production (labor, capital) and consume goods and services.
Markets for goods and services
Markets where households are buyers and firms are sellers.
Markets for factors of production
Markets where households are sellers and firms are buyers.
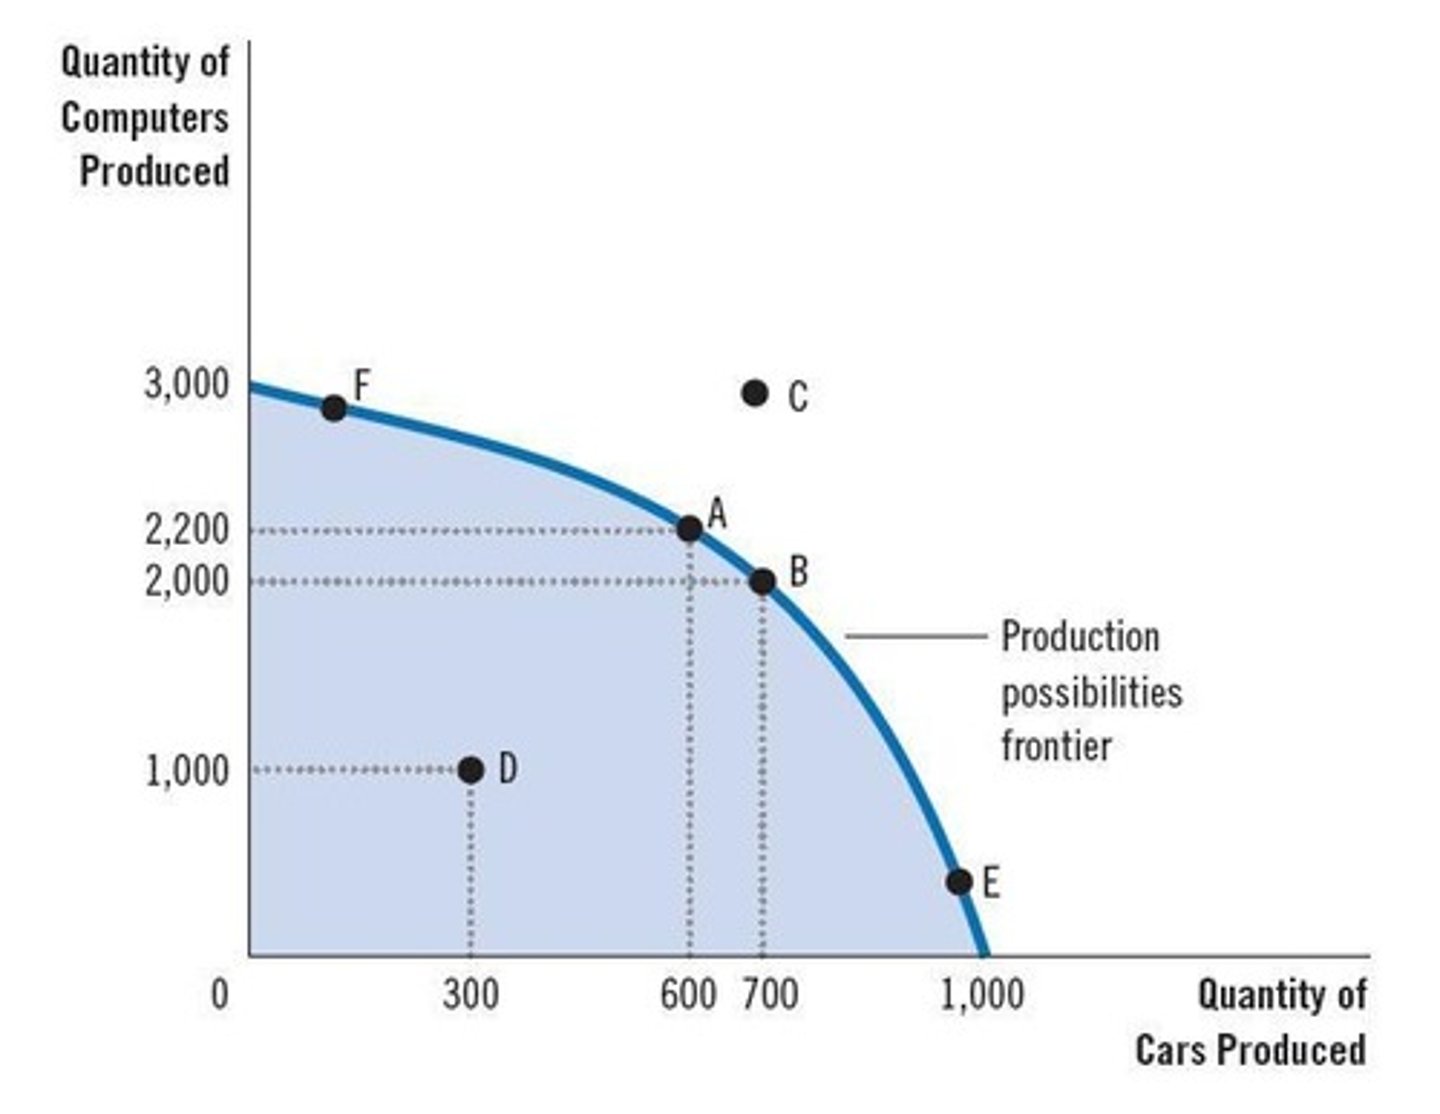
Production possibilities frontier (PPF)
A graph that shows the various combinations of outputs that the economy can possibly produce with the available factors of production and production technology.
Combinations of output
Different quantities of goods that can be produced, such as cars and computers, as represented on the production possibilities frontier.
Feasible output combinations
Any point on or beneath the production possibilities frontier curve.
Infeasible output combinations
Points outside the production possibilities frontier that are not possible given the economy's resources.
Slope of the production possibilities frontier
Measures the opportunity cost of a car in terms of computers.
Efficient outcomes
Points on the production possibilities frontier where the economy is utilizing all its available resources.
Trade-off
The situation where producing more of one good results in producing less of another good.
Example of trade-off
Moving from point A to point B, society produces 100 more cars at the expense of producing 200 fewer computers.
Opportunity cost of 100 cars
200 computers.
Opportunity cost of each car
2 computers, which equals the slope of the production possibilities frontier.
Inputs
Factors of production used by firms to produce outputs.
Outputs
Goods and services produced by firms.
Households and firms interaction
Occurs in two types of markets: for goods and services, and for factors of production.
Visual representation of economy
The circular-flow diagram serves as a schematic representation of the organization of the economy.
Flow of dollars
Represented by the outer set of arrows in the circular-flow diagram.
Flow of inputs and outputs
Represented by the inner set of arrows in the circular-flow diagram.
Production technology
The methods and processes used to produce goods and services.
Resources
The factors available to an economy for production, which limit output combinations.
Inefficient Outcomes
Points inside PPF are inefficient.
Point D
Economy is producing less than it could from the resources it has available.
Elimination of Inefficiency
If source of the inefficiency is eliminated, economy can increase its production of both goods.
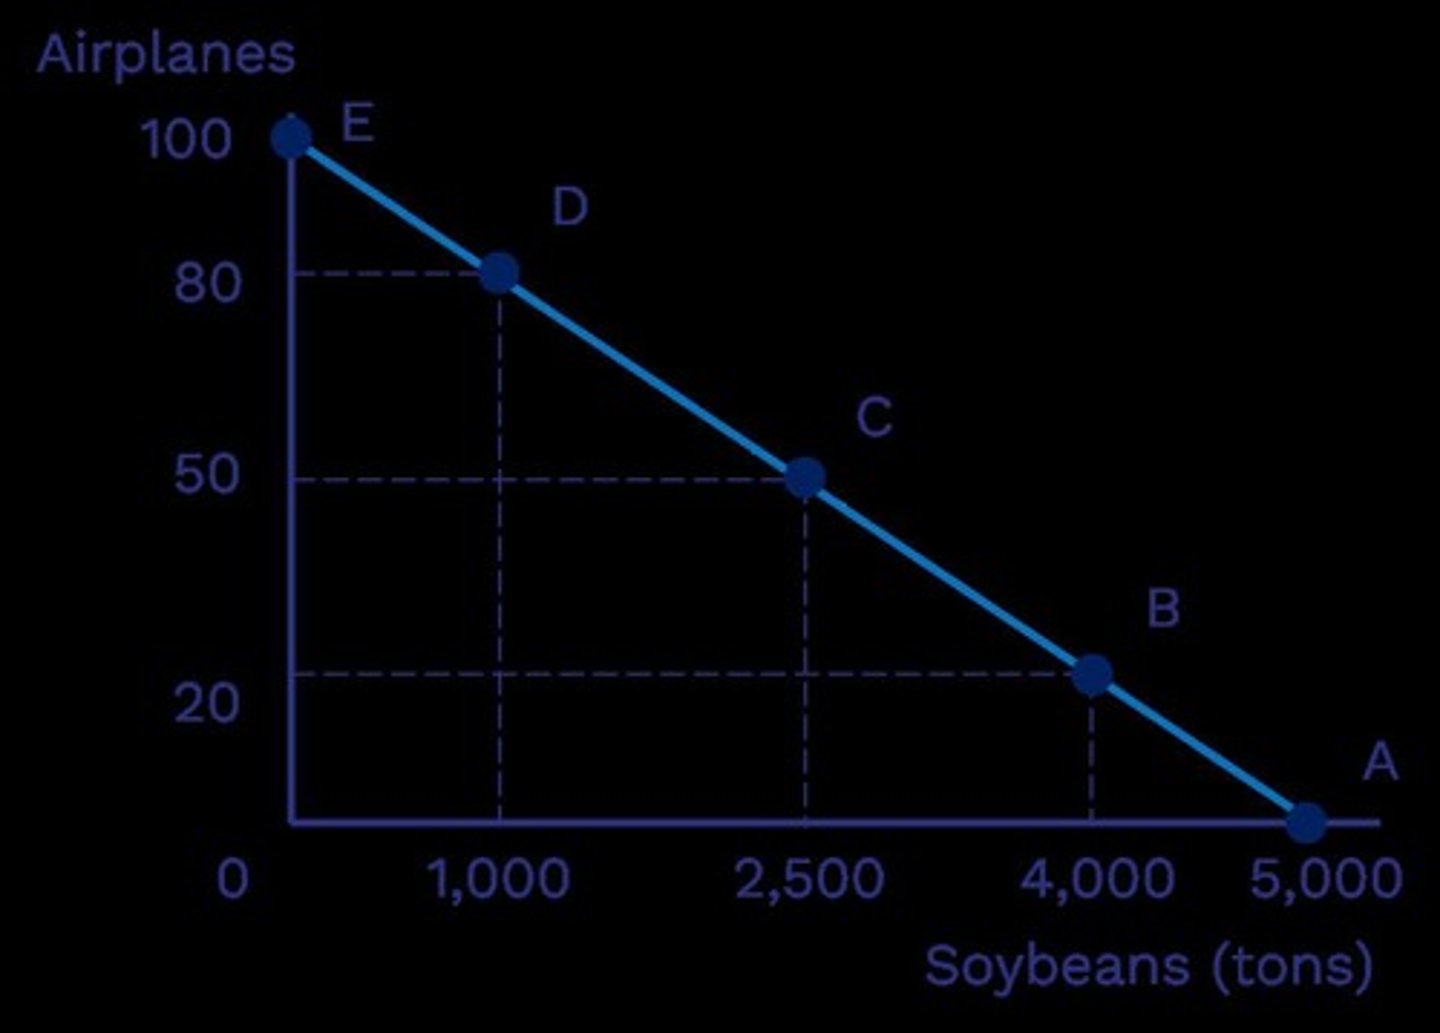
Point F
80 airplanes and 4,000 tons of soybeans; not possible.
Point G
30 airplanes and 2,500 tons of soybeans; possible but not efficient (can produce more).
Technological Advance
Enables the economy to produce more computers for any given number of cars.
Outward Shift of PPF
Occurs when technological advances allow for increased production capabilities.
Economists as Scientists
Economists explain the causes of economic events.
Economists as Policy Advisers
Economists recommend policies to improve economic outcomes.
Positive Statements
Descriptive claims about how the world is; can be confirmed or refuted by evidence.
Example of Positive Statement
"Minimum-wage laws cause unemployment."
Normative Statements
Prescriptive claims about how the world ought to be; involves values as well as facts.
Example of Normative Statement
"The government should raise the minimum wage."
Council of Economic Advisers
Advises the president and writes the annual Economic Report of the President.
Office of Management and Budget
One of the economic advisory offices in Washington.
Department of the Treasury
One of the economic advisory offices in Washington.
Department of Labor
One of the economic advisory offices in Washington.
Department of Justice
One of the economic advisory offices in Washington.
Congressional Budget Office
One of the economic advisory offices in Washington.
The Federal Reserve
One of the economic advisory offices in Washington.
Active Learning 1
Graph the PPF and analyze possible combinations of goods.
Point A
0 airplanes and 5,000 tons of soybeans.
Point B
20 airplanes and 4,000 tons of soybeans.
Point C
50 airplanes and 2,500 tons of soybeans.
Point E
100 airplanes and 0 tons of soybeans.
Economic Advisers
Individuals who provide the president with economic advice.
Communication Advisers
Individuals who assist the president with communication strategies.
Press Advisers
Individuals who manage the president's interactions with the media.
Legislative Affairs Advisers
Individuals who help the president navigate legislative processes.
Political Advisers
Individuals who provide political strategy and advice to the president.
Business Cycles
Fluctuations in economic activity characterized by periods of economic expansion and contraction.
Supply Shocks
Unexpected events that affect the supply side of the economy.
Demand Shocks
Unexpected events that affect the demand side of the economy.
Labor Supply Elasticity
A measure of how much the quantity of labor supplied responds to changes in wages.
Public Policy
Government actions designed to address public issues.
Normative Views
Opinions about what policies should aim to achieve based on values.
Tax Fairness Question
Is the tax system fair when comparing different income and tax rates?
Graphs
Visual representations of data that express ideas clearly.
Pie Chart
A circular statistical graphic divided into slices to illustrate numerical proportions.
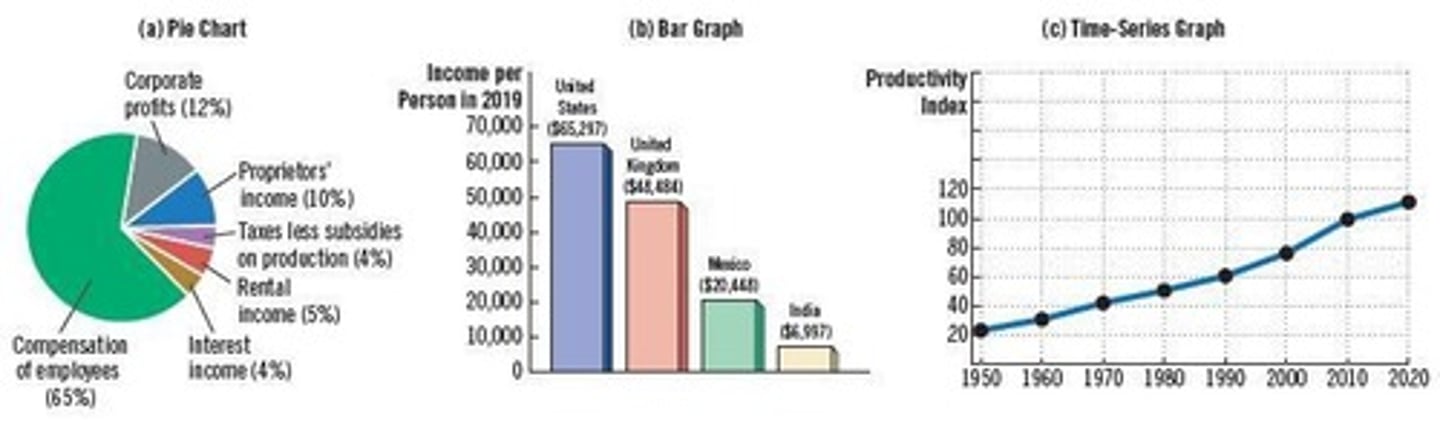
Bar Graph
A chart that presents categorical data with rectangular bars.
Time-Series Graph
A graph that displays data points at successive time intervals.
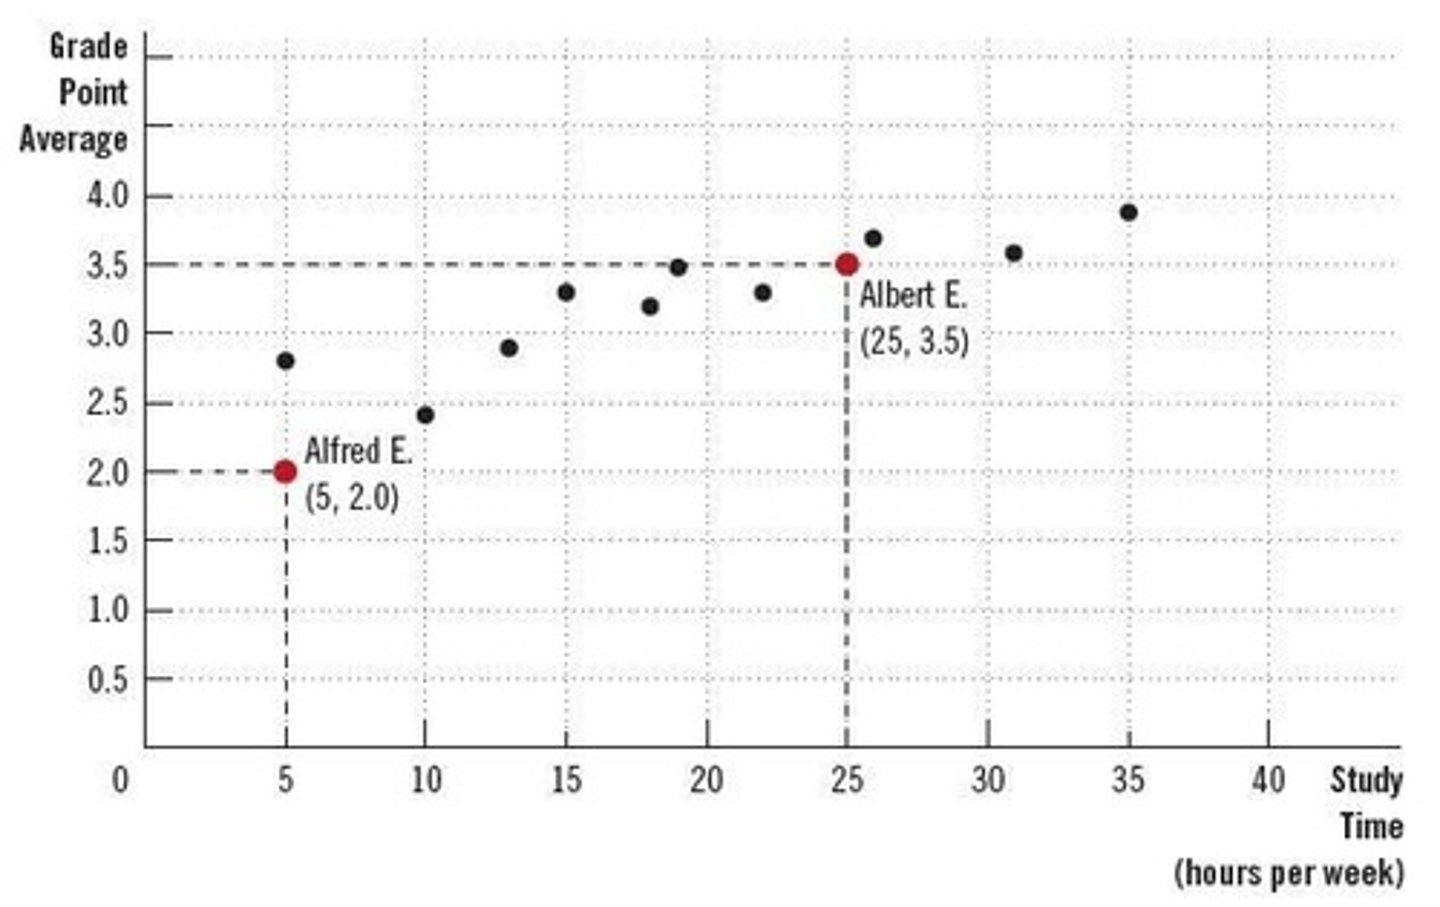
Scatterplot
A graph that uses dots to represent the values obtained for two different variables.
x-coordinate
The horizontal value in a coordinate system.
y-coordinate
The vertical value in a coordinate system.
Grade Point Average (GPA)
A measure of a student's academic performance, typically represented on the vertical axis.
Study Time
The amount of time spent studying, typically represented on the horizontal axis.
Interpolation
The method of estimating unknown values by connecting known data points.
Curves in Scatterplots
A visual representation of data points that shows trends when fine data observations are plotted.
Negatively related variables
The two variables move in opposite direction.
Positively related variables
The two variables move in the same direction.
Slope
Ratio of the vertical distance covered to the horizontal distance covered.
Δ (delta)
Change in a variable.
Slope formula
The 'rise' (change in y) divided by the 'run' (change in x).
Calculating the slope of a line
To calculate the slope of the demand curve, look at the changes in the x- and y-coordinates as we move from the point (13 novels, $8) to the point (21 novels, $6).