Workbook Qs
1/22
There's no tags or description
Looks like no tags are added yet.
Name | Mastery | Learn | Test | Matching | Spaced |
|---|
No study sessions yet.
23 Terms
Drug targets are often ________ in nature.
Protein (e.g. a receptor / enzyme / carrier protein)
The affinity of a drug for its receptor is usually analysed using what
Radioligand binding assays where the drug is incubated in a subcellular fraction containing the receptors of interest
The binding of drugs to receptors can often be measured directly using what
Drug molecules labelled with 1 or more radioactive atoms (3H, 14C or 125I)
Incubate samples of the tissue with various concs on the radioactive drug until equilibrium is reached.
The radiolabelled drug bound to target receptors is measured.
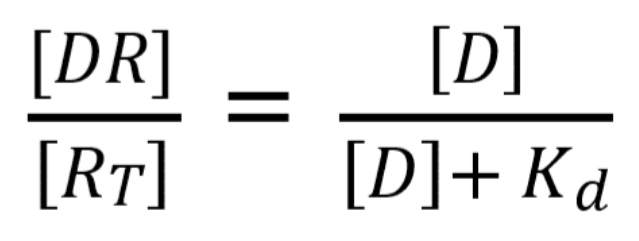
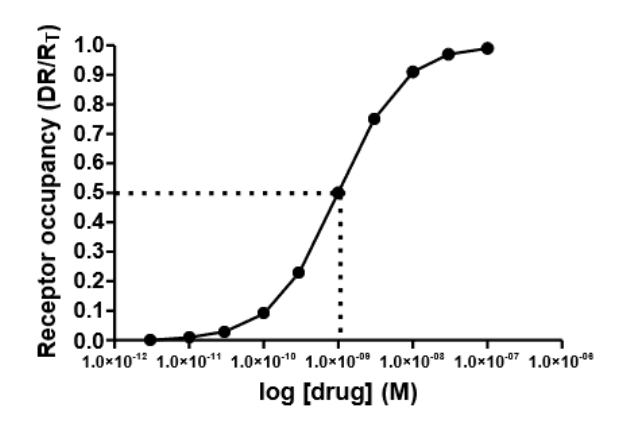
If we know the Kd for a ligand (the concentration of the ligand where 50% of the receptors are bound), we can calculate the proportion of receptors occupied at a given ligand concentration using the following equation
How is Kd read off a graph
Find 50% occupancy and go across & down
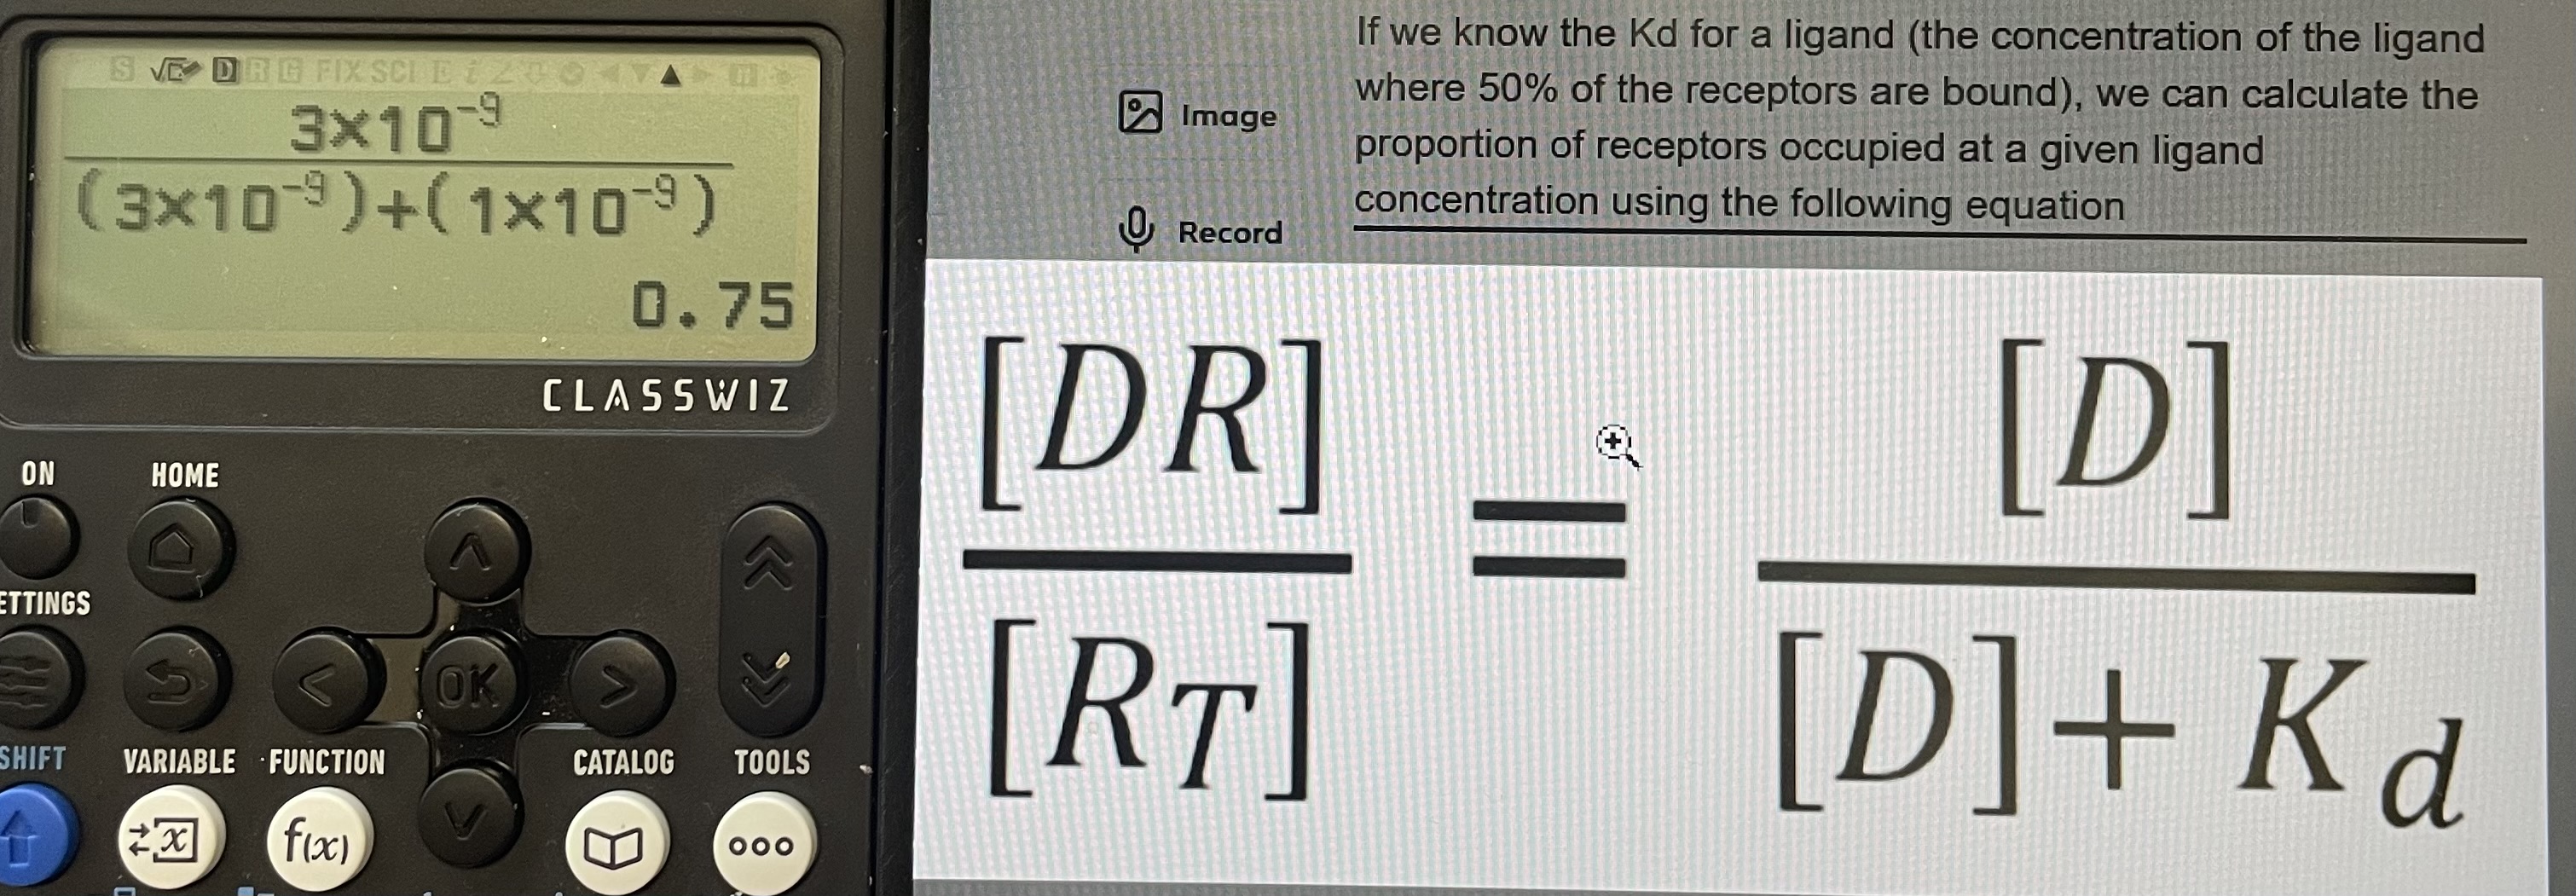
If a drug has a Kd value of 1 x 10⁻⁹ M, calculate the receptor occupancy when [D] (concentration) is 3.0 x 10⁻⁹ M
0.75
Find the Kd value
1 x 10⁻⁹ M
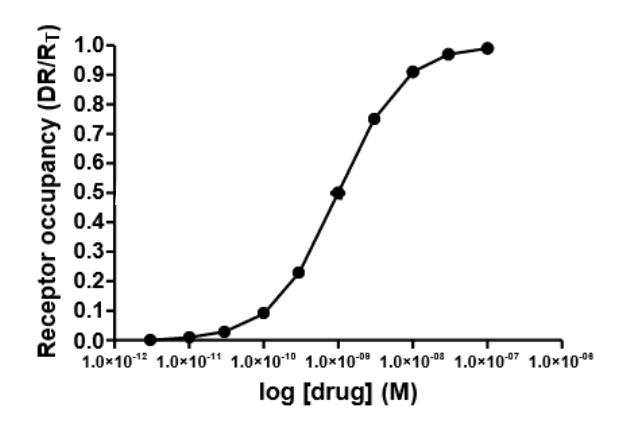
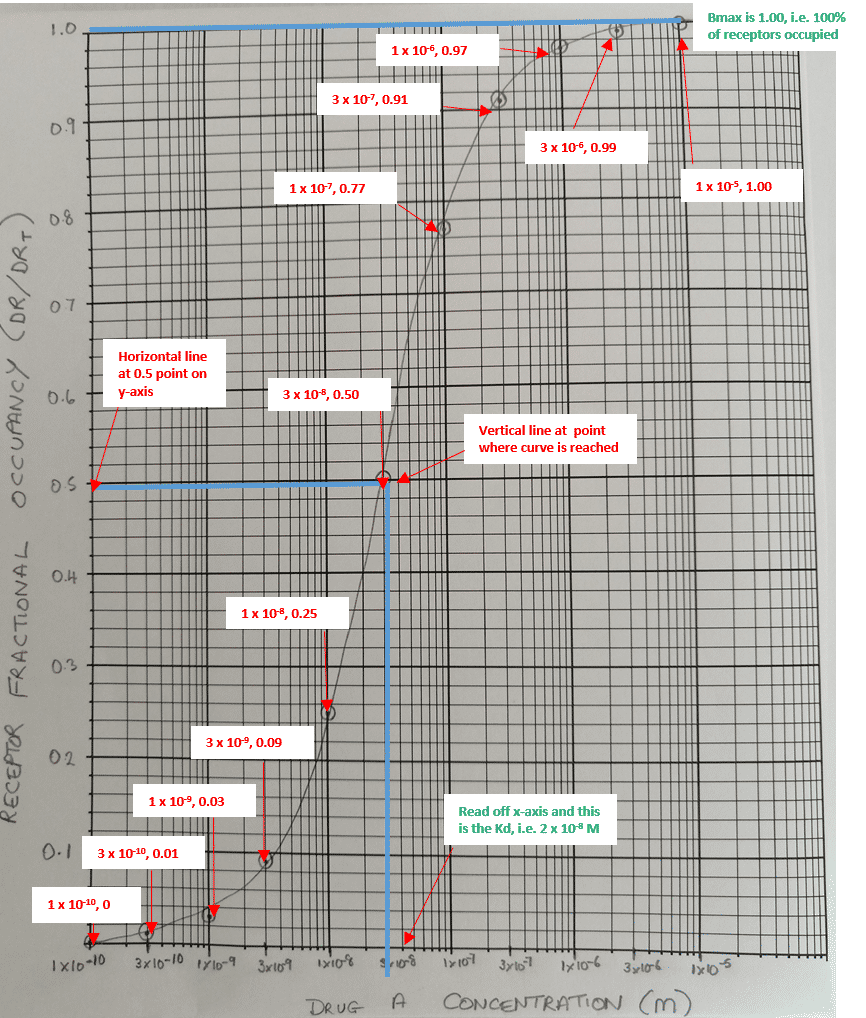
Construct a receptor occupancy curve for Drug A and calculate the Kd and Bmax using the graph.
Drug Concentration (M) | Receptor Occupancy (DR/DRT) |
|---|---|
1 x 10⁻¹⁰ | 0.00 |
3 x 10⁻¹⁰ | 0.01 |
1 x 10⁻⁹ | 0.05 |
3 x 10⁻⁹ | 0.13 |
1 x 10⁻⁸ | 0.33 |
3 x 10⁻⁸ | 0.60 |
1 x 10⁻⁷ | 0.83 |
3 x 10⁻⁷ | 0.94 |
1 x 10⁻⁶ | 0.98 |
3 x 10⁻⁶ | 0.99 |
1 x 10⁻⁵ | 1.00 |
From the curve the Kd value is 3 x 10⁻⁸ M. whilst the Bmax is the maximal point of the curve, in this case equating to 1.00.
How do affinity & Kd relate
High affinity = low Kd
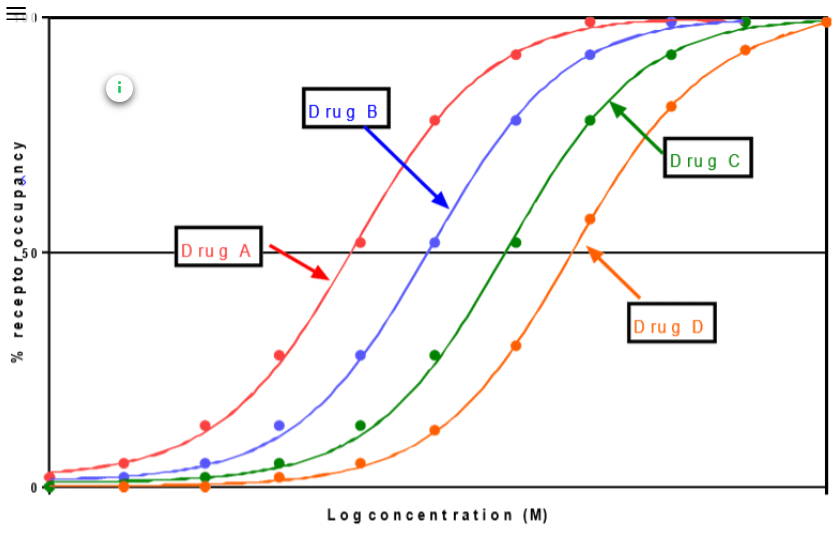
This graph allows us to determine whether Drug A is an agonist or an antagonist
True/False
False

Which of the following statements is true of the Bmax values shown on the graph
Drugs A and B have the same Bmax value
All the drugs have the same Bmax value
Drugs B, C and D have a lower Bmax than Drug A
Drugs A and B have the same Bmax value
All the drugs have the same Bmax value

Which drug has the highest affinity
Drug A (lowest Kd)

Drug A is an agonist. Drugs B and C are antagonists. Identify the nature of their antagonism, i.e. competitive/non-competitive
Drug B = competitive antagonist - Increasing concentrations of Drug A will fully remove all of this antagonism
Drug C= non-competitive antagonist, the antagonism can only be partially overcome by increasing concentrations of Drug A
How do you tell the difference between a drug occupancy or concentration/response curve
In drug occupancy, the y-axis is receptor occupancy, whilst in a concentration/response curve, it is Biological Response.
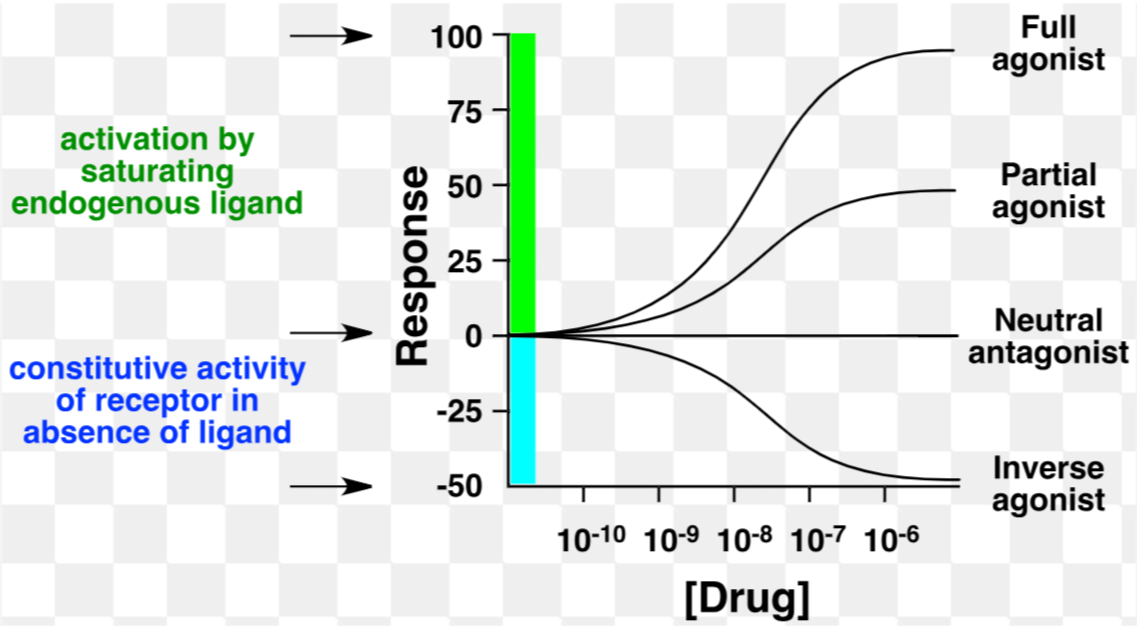
Name the 3 types of agonist & 2 types of antagonist
Agonist: full, partial or inverse
Antagonist: competitive, noncompetitive
When are responses plotted as a concentration–response curve vs a dose–response curve
Concentration–response curve: When dealing with an in vitro or isolated organ preparation
Dose–response curve: When it is derived in vivo, i.e. in laboratory animals or human subjects
How would you plot this on a graph
Concentration in organ bath (M) | Acetylcholine (ACh) | Drug A | ||
Response (mm) | (%Emax) | Response (mm) | (%Emax) | |
1 x 10⁻⁹ | 0 | 0 | ||
3 x 10⁻⁹ | 1 | 2 | ||
1 x 10⁻⁸ | 5 | 8 | 0 | 0 |
3 x 10⁻⁸ | 22 | 35 | 2 | 3 |
1 x 10⁻⁷ | 42 | 68 | 16 | 26 |
3 x 10⁻⁷ | 51 | 82 | 38 | 61 |
1 x 10⁻⁶ | 58 | 94 | 50 | 81 |
3 x 10⁻⁶ | 61 | 98 | 57 | 92 |
1 x 10⁻⁵ | 62 | 100 | 61 | 98 |
3 x 10⁻⁵ | 62 | 100 | 62 | 100 |
1 x 10⁻⁴ | 62 | 100 | ||
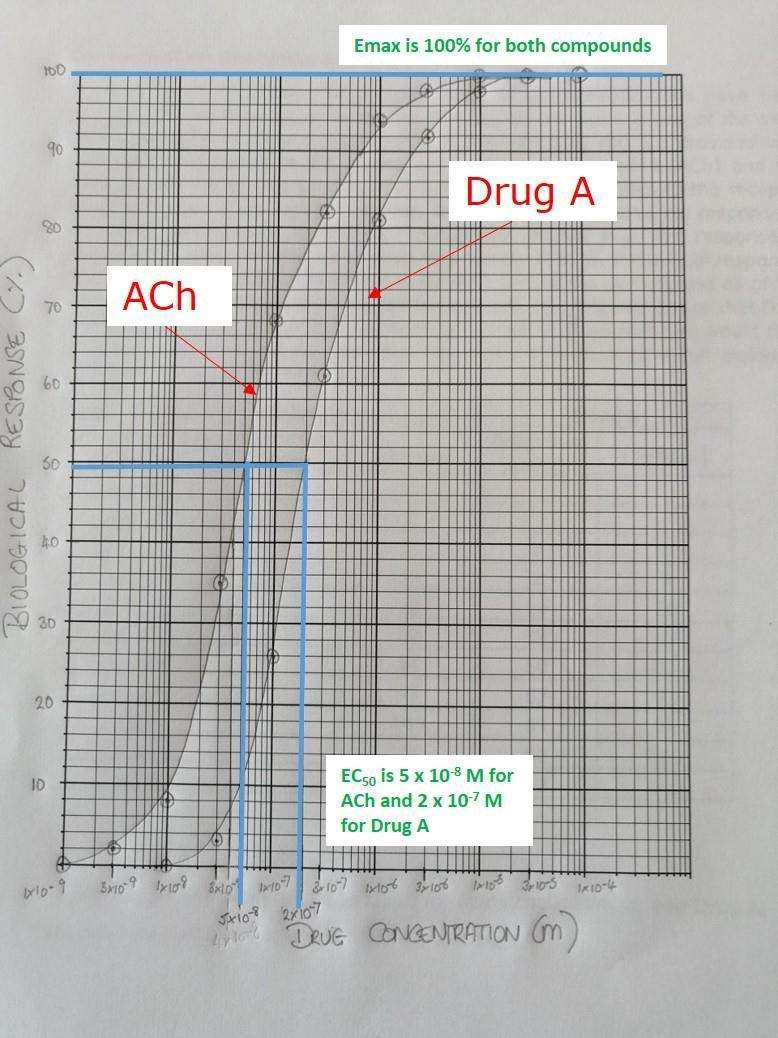
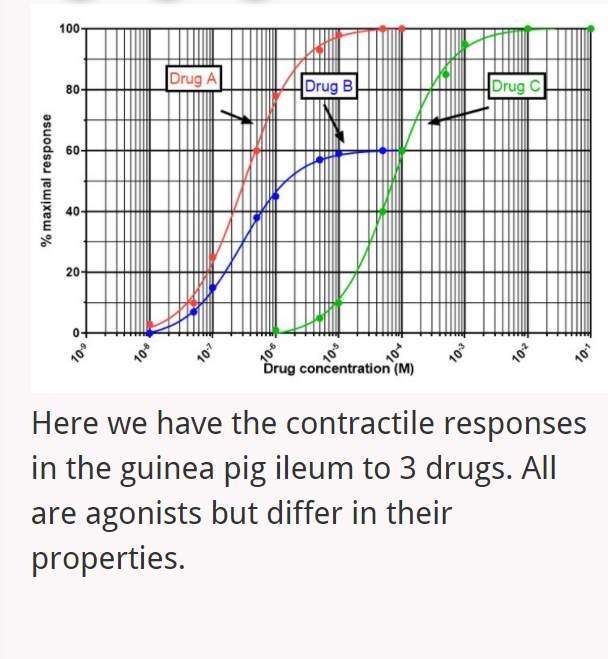
The Emax for Drugs A and C is _____
100%

The Emax for Drug B is ______
60
Does a high therapeutic index mean that a drug is more/less safe
Give 3 examples
High TI = more safe (some available over the counter)
E.g. H2 blockers, proton pump inhibitors (PPIs) & pencillin antibacterials
Give some examples of low TI drugs
These drugs require great care in ensuring that the dose does not produce harmful effects, such as digoxin, warfarin, anticancer drugs & barbiturates
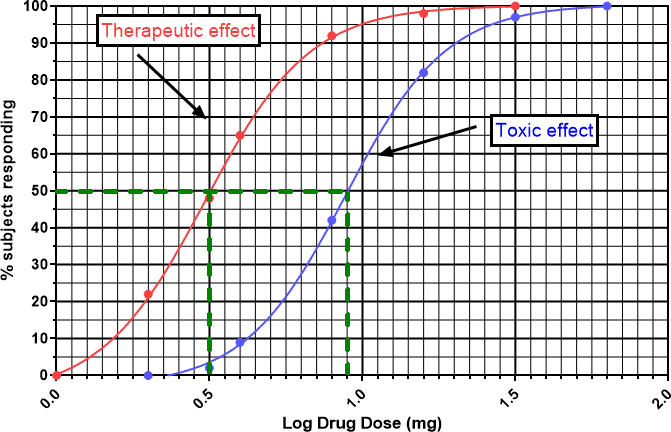
What figures do we need to calculate therapeutic index
ED50 and TD50 for a drug
How would this look on a graph
Drug Dose (mg) | Log Drug Dose | Therapeutic response (%) | Toxic response (%) |
1 | 0 | 0 | |
2 | 0.3 | 22 | 0 |
3 | 0.5 | 45 | 2 |
4 | 0.6 | 65 | 9 |
8 | 0.9 | 92 | 42 |
16 | 1.2 | 98 | 82 |
32 | 1.5 | 100 | 97 |
64 | 1.8 | 100 |