Independent study unit
1/197
There's no tags or description
Looks like no tags are added yet.
Name | Mastery | Learn | Test | Matching | Spaced | Call with Kai |
|---|
No analytics yet
Send a link to your students to track their progress
198 Terms
What is population ecology
the study of populations, particularly the size, density, distribution, and changes over time
WHat are uses of population ecology
Gather’s data to predict growth trends in populations
help determine the health of different species/ ecosystems in which the species live in
research in ecology is often linked to genetics, physiology, anatomy, behaviour, evolution, etc…
info from population ecology allows scientists to manage the size of populations
ecologists must determine how environments influence organisms and how organisms change the environments in which they live
What 3 factors describe the distribution of a population
its geographic range
population size and density
the way that individuals are dispersed through the area
What is geographic range
the total area that is occupied by a population
varies between species
what is a habitat and how is it characterised
a habitat is a specific environment in which an organism lives in
characterized by its biotic (living) and abiotic (non living) features
biotic : plants, animals
abiotic: soil, sunlight, temp, water
What is population size and density
population size (Nt) : the number of individuals that make up a population at a specified time
population density (D): the number of individuals per unit area or per unit volume (of their habitat)
What do species with a larger body size tell u about their population density compares to species with a smaller body size
species with a larger body size generally how a lower population density than species with a small body size
What are the 2 types of population density
crude density: population density measured in terms of individuals of the same species within the total area of their entire habitat
ecological density: population density measured in terms of individuals of the same species per unit area or volume
how is population density calculated
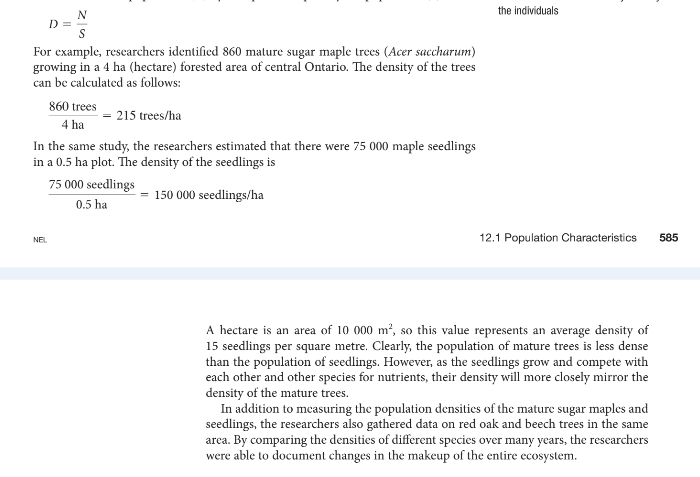
by dividing the total numbers of individuals in the population (N) by the space occupied by the population (S)
D = N/S
Researchers identified 860 mature sugar maple trees (Acer saccharum) growing in a 4 ha (hectare) forested area of central Ontario.
a) What is the density of the trees?
b) in the same study, the researchers estimated that there were 75000 maple seedlings in a 0.5 ha in a plot. What is the density of the seedlings
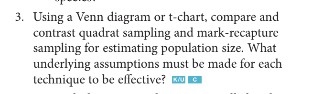
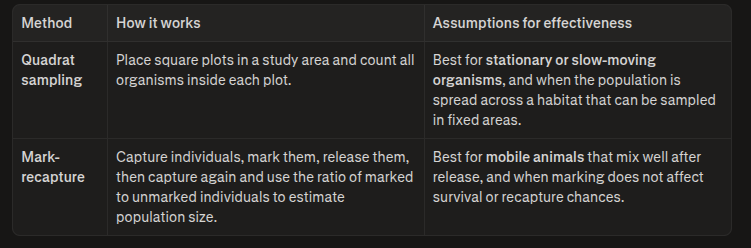
What are the 3 methods of estimated population sizes
quadrat method
mark-recapture method
technological tracking
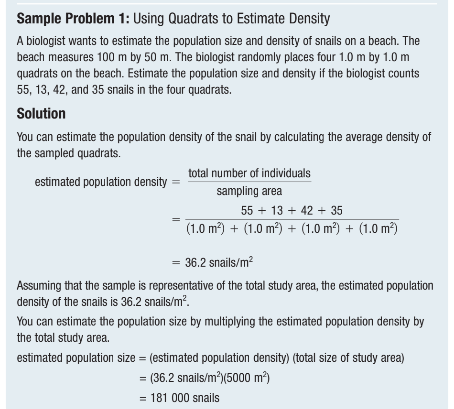
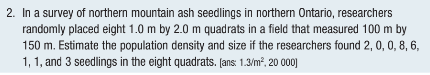
Define quadrat and describe the quadrat method for estimating population sizes
quadrat : a sampling frame that is used for estimating population size
frame can be real or virtual (Ex: square made of wood, plastic, etc…)
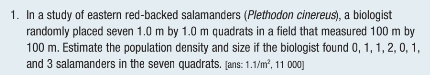
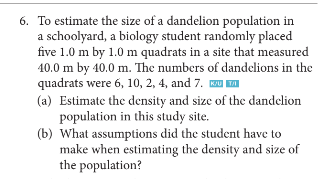
A biologist wants to estimate the population size and density of snails on a beach. The beach measures 100m by 1.0m quadrats on the beach. Estimate the population size and density if the biologist counts 55, 13, 42, and 35 snails in the 4 quadrats
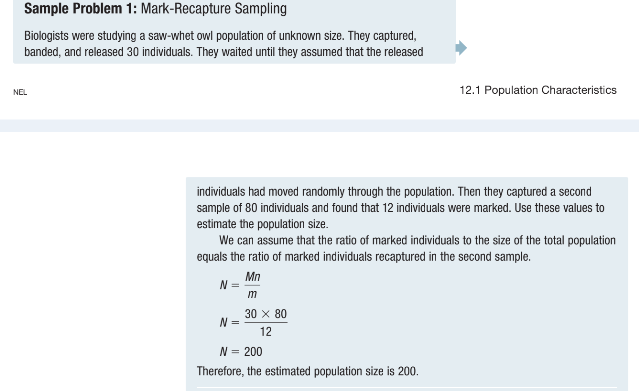
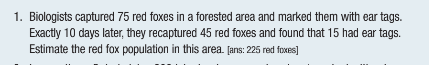
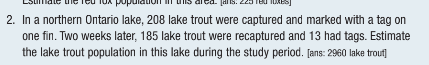
Describe the mark-recapture method
a sampling technique for estimating population size and density by comparing the proportion of marked and unmarked animals that are captured in a given area (sometimes called the capture-recapture method)
Accuracy of this method depends on 5 assumptions:
chances that each individual in the population to be caught are equal and constant for both the initial capture and recpature
proportion of marked to unmarked animals remains the same between captures
enough time is allowed between the initial capture and the subsequent recapture for all marked individuals to disperse randomly
the captured animals are not affected by their marks
marked animals do not lose their marks
Based on these assumptions, estimated pop size is calculated using:
total number marked (M) / total pop (N) = number of recaptures (m) / size of the second sample (n)
M/N = m/n
What are the 5 assumptions when using the mark-recapture method to estimate population size
Accuracy of this method depends on 5 assumptions:
chances that each individual in the population to be caught are equal and constant for both the initial capture and recpature
proportion of marked to unmarked animals remains the same between captures
enough time is allowed between the initial capture and the subsequent recapture for all marked individuals to disperse randomly
the captured animals are not affected by their marks
marked animals do not lose their marks
what is the formula used for mark-recapture method
Based on these assumptions, estimated pop size is calculated using:
total number marked (M) / total pop (N) = number of recaptures (m) / size of the second sample (n)
M/N = m/n
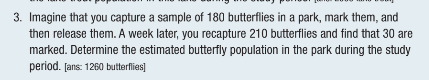
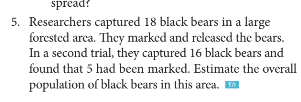
Biologists were studying a saw-whet owl population of unknown size. They captured, banded, and released 30 individuals. They waited until they assumed that the released individuals had moved randomly through the population. Then they captured a second sample of 80 individuals and found that 12 individuals were marked. Use these values to estimate the population size
Describe technological tracking
technological tracking is essentially done through special transmitters using GPS technology and sateillites
tracking can also be done with DNA sampling
by collecting and testing their droppings and other biological materials
tracking animals provides useful information about their behaviour
biologists have been able to learn a great deal about the range, distribution, and population density of various species with these techniques
Why are scientists concerned about studying wild populations
marking and tracking can be excellent techniques for monitoring and sampling a population
but there is also an ethical debate about their potential impact on the animals involved
concerns that the handling of animals during data collection (for pop size/density) may alter their behaviour after their release or reduce their reproductive ability
concerns about trapping methods that may be harmful
What is the canadian council on animal care (CCAC) and what do they do
the CCAC are developing a set of guidelines for ethical wildlife research by encouraging researchers to:
reduce their use of animals in studies as much as possible
support and develop techniques minimize pain and distress
replace trapping with computer estimations where possible
what is distribution
Distribution: the spatial distribution of individuals within a geographic range
a)
clumped dispersion : individuals are grouped more closely to each other than if they were randomly dispersed (groups of clumps)
random dispersion : individuals are distributed independently of each other
uniform distribution: individuals are more widely separated from each other than if they were randomly dispersed
b) No, dispersion patterns do not always match what you might expect, because they depend on more than just where resources are found. Competition, territorial behavior, social grouping, and environmental patchiness can all change the pattern.
For example, even if a habitat seems evenly suitable, animals may still be clumped because they live in groups, or uniformly spaced because they defend territories.
more in notes
Define demography
the study of the growth rate, age structure, and other characteristics of populations
define emmigration
movement of individuals out of a population
define immigration
movement of individuals into a population
define natality (birth)
birth rate in a population
define mortality (death)
death rate in a population
WHat is a life table
a life table summaries the demographic characteristic of a population
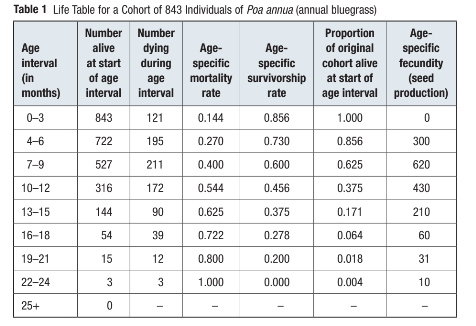
How do demographers collect life table data
demographers usually mark a group of individuals born around the same time (cohort) and then monitor the survival of these individuals until all of them die
WHat are the 2 ways mortality rate can be viewed
age-specific mortality: proportion of individuals that were alive at the start of an age interval but died during the age interval
age-specific survivorship: the proportion of individuals that were alive at the start of an age interval and survived until the start of the next age interval
Whats the formula for age-specific mortality rate

Formaula for age-speceifc survivorship?

When u add age-specific survivorship and age-specific mortality together what do u get
age-specific survivorship + age-specific mortality = 1
What are survivorship curves
a graphic display of the rate of survival if individuals over the lifespan of a species
What are the 3 types of survivorship curves and describe them
Type I curves
relatively flat at the start, reflecting a low death rate in early and middle years
drop steeply as the death rate increases in the older age groups
Type II curves
reflect a relatively constant rate of mortality in all age groups
provides a steadily declining survivorship
Type III curves
drop rapidly at the start, reflecting a high death rate early in life
flattens as the death rate declines for the few individuals that survive the critical stage
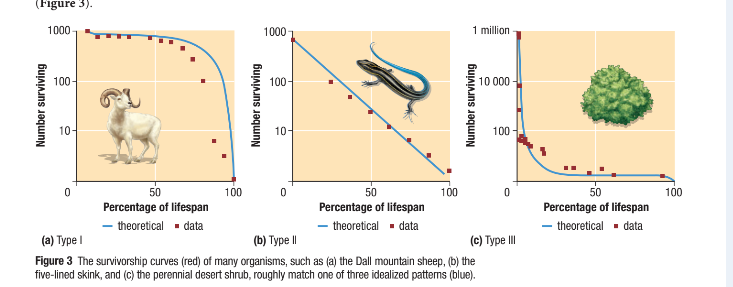
For each type of survivorship curve, what types of organism are usual for each curve
Type I:
These curves are typical for large animals that produce few young and provide their young with extended care, reducing mortality
Type II:
organisms that have type II curves generally have a relatively short gestation (pregnancy) period
often feed on type III organisms but are preyed on by type I organisms
Type III:
this type of curve is common of species that produce a large number of offsprings

Define fecundity
the potential reproductive capacity of an individual or population
WHat is fecundity dependent on
environmental conditions
in years where food is high and climate is optimal, species have higher fecundity
years where food is little and little precipitation, fecundity is low
generation time
(time needed to complete one generation between the birth of an organism to the birth of its offspring)
sex ratio
(relative proportion of males and females in a population)
number of females has a bigger impact cause they are the ones producing and one male can mate with several females hence the reason why number of females have a bigger impact
Define generation time
the time needed to complete one generation between the birth of an organism and the birth of the offspring
define sex ratio
the relative proportion of males and females in a population
Describe the relationship between fecundity and parental care
an animal that has many offspring (high fecundity) normally does Little to care for them
in contrast, animals that have just one or 2 offspring per year tend to be very protective and take good care of their offspring
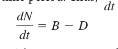
What is the change in population size formula
pop change = (births + immigration) - (deaths + emigration)
natality
Births increase population size because new individuals are added.
Mortality
Deaths decrease population size because individuals are removed.
Immigration
Immigration increases population size when individuals move into the population.
emigration
Emigration decreases population size when individuals move out of the population.
a) = 1
b) 0.703
by summarizing the demographic characteristics of a population
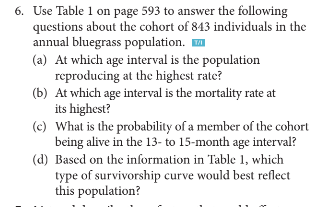
a) 7-9
b) 22-24
c) 0.171
d) type I
environmental conditions
years where food is high and climate is optimal, fecundity is high
years where food is little and precipitation is little, fecundity is little
generational time
time needed to complete one generation between the birth of an organism to the birth of its offspring
sex ratio
relative proportion of males and females in a population
number of females have a bigger impact cause they are the ones reproducing while one male can mate with several females
360
Define population dynamics
the change in a population over time
if positive → population is growing
if negative → population is decreasing
if 0 → no change in pop size
What is the exponential model of population growth
a pattern of population growth in which organisms reproduce continuously at a constant rate
ex:bacteria production
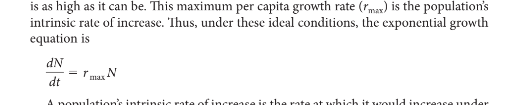
What is the per Capita growth rate (r)
the difference between the per Capita birth rate and the per capita death rate of a population
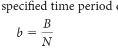
What is the per Capita birth rate (b)
the number of births in a population during the specified time period divided by the population size
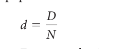
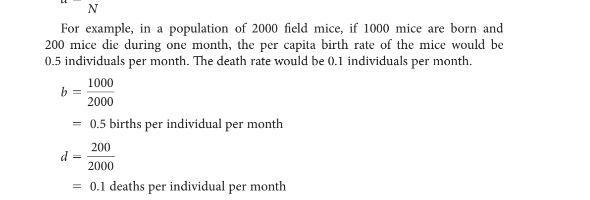
What is the per Capita death rate (d)
the number of deaths divided by the population size
In a population of 2000 field mice, if 1000 mice are born and 200 mice die during one month, the per capita birth rate of the mice would be? and what about per Capita death rate?
What is zero population growth
a situation where the death rate and the birth rate are in equilibrium
population size doesn’t change
births and deaths still occur, but they are at equal amounts
WHat happens to the per Capita death rate and per Capita birth rate when there are limited ressources
per Capita birth rate decrease
per Capita death rate increase
ZPG
What is the carrying capacity (k)
the max number of individuals in a population that the environmental resources can support
different for every poipulation
varies from one habitat to another
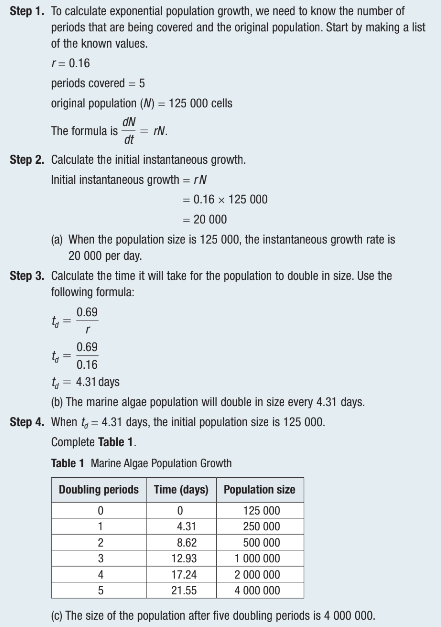
What is doubling time?
the doubling time of a population is the amount of time that is required for the population to double in size
td = 0.69/r
r = per Capita growth rate
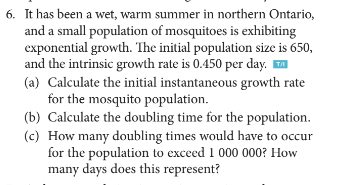
a population of single-celled marine algae grows exponentially. A sample of single-celled marine algae provided an estimate of 125000 cells on the initial sampling date. The intrinsic growth rate (r) is 0.16 per day. Calculate the following:
a) the initial instantaneous growth rate of the population
b) the time it will take for the population to double in size
the size of the population after five doubling periods
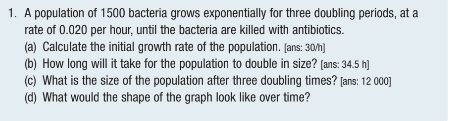
d) exponential increase followed by a sharp decline caused by antibiotics
What are the limitations of the exponential growth model
environmental limits
limited resources prevent continuous growth in populations
resource competition
as populations grow and outnumber resources, individuals compete, leading to increased death rates and decreased birth rates
reproductive patterns
many populations do not reproduce continuously as they have specific breeding periods
geometric growth patterns
reproduction at fixed intervals, following by population decline until next breeding period
growth rate determined by comparing year-to-year population size
what is the carrying capacity (k)
the max number of individuals in a population that the environmental resources can support
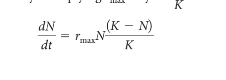
What is the logistic model of population growth
describes growth that levels off as the size of a population reaches the carrying capacity
if a population is very small ( N much less is K)
plenty resources are available
r approaches rmax
value of (K - N) / K is close to 1
if a population is large (N close to K)
few resources available
r is very low
(K - N) / K is small
is population is K (N =K)
(K - N) / N becomes 0
situation defined as zero population growth
r becomes 0
IF size of a population (N) exceeds carrying capacity (N bigger than K)
population decreases
when graphed, this type of population growth creates an S-shaped curve,or sigmoid curve (logistic)
describe the conditions of logistic model of growth
if a population is very small ( N much less is K)
plenty resources are available
r approaches rmax
value of (K - N) / K is close to 1
if a population is large (N close to K)
few resources available
r is very low
(K - N) / K is small
is population is K (N =K)
(K - N) / N becomes 0
situation defined as zero population growth
r becomes 0
IF size of a population (N) exceeds carrying capacity (N bigger than K)
population decreases
when graphed, this type of population growth creates an S-shaped curve,or sigmoid curve (logistic)
What is the sigmoid curve (logistic)
an s-shaped curve, typical of population growth that starts slow, accelerates or grows rapidly, and then levels out over time
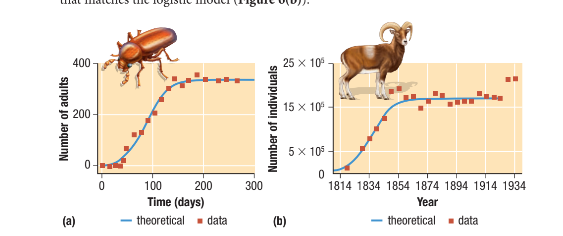

analyze these sigmoid curve (logistic)
population grows slow when population size is small because few individuals are reproducing
population grows slow when population is large because as population approaches k,the per Capita population rate is low
populations grow quickly at intermediate population sizes, where a large number of individuals are breeding and per Capita population growth rate (r ) is still fairly high
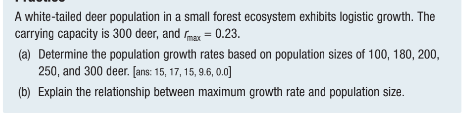
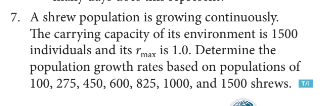
A population of spotted butterflies exhibits logistic growth. The carrying capacity of the population is 500 butterflies, and the maximum growth rate (rmax) is 0.1
a) determine the population growth rates based on a population size of 50, 100,200, 350, 480, 500 and 525 butterflies
b) describe the relationship between population size and growth rate
go to page 607
What are the assumptions made when it comes to limitations of the logistic growth model
all individuals reproduce, die, and use resources at the same rate
carrying capacity (k) remains constant, with no environmental variations
no migration (immigration or emigration) occurs
What is the difference between open populations and closed populations
open population →natality, mortality, immigration, and emigration all effect growth rate
closed population →only natality and mortality affect growth rate
immigration and emigration already occur
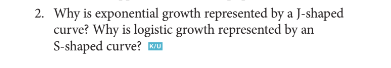
exponential growth is represented by a J-shaped curve because the population increases rapidly without constraints,
while logistic growth is represented by an S-shaped curve because the population’s growth slows down and stabilizes as it approaches the carrying capacity
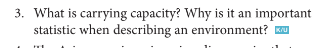
carrying capacity is the max number of individuals in a population that the environmental resources can support
Carrying capacity (K) is an important statistic when describing an environment because it represents the maximum population size of a species that a specific environment can sustainably support over time
define limiting factor
a factor that limits the growth of a population
limiting factors can be biotic or abiotic
can cause populations to increase or decrease
What are the 2 types of limiting factors
density-dependent factors
a factor that is influenced by population density, having a greater impact as the population density increases
density-independent factors
a factor that influences population regulation, regardless of population density
factors not related to density
What are examples of density-dependent factors?
competition
an interaction in which both competing populations lose access to some resources
two types: intraspecific competition and interspecific competition
competition is only apparent if population density is high or low
predation
when one organism kills and eats another organisms (interaction between predator and prey)
more competitive when population density of predators are high
by consuming the prey, predators increase their own population while decreasing the population density of the prey
disease
increases with the density of the population
high population density makes the spread of disease easier, and disease can have catastrophic effects on a population, as well as all the populations that interact with it in an ecosystem
crowding
only occurs in high-density population with limited space
crowding affects the growth, size, and survival of the individuals in a population
individuals living in extremely dense populations are unable to harvest enough resources
when resources are more shared, less is in supply, and individuals have less energy for reproduction
also allows disease to spread more easily
What are the two types of competition
intraspecific competition
ioccurs when members of the same species compete for ressources
interspecific competition
occurs when members of different species compete for resources
what is the allee effect
a density-dependent phenomenon that occurs when a population cannot survive or fails to reproduce enough to offset mortality once the population density is too low
not crowded enoiugh
occurs when population is too small
animal species that reach small sizes or low densities experience a decrease in their Capita rate of population growth
can lead to extinction
small populations are at greater risk for extinction due to the normal variations in natality and mortality, resources limitations,habitat availablitity, predation, competition, and catastrophic events
What is the minimum viable population size
the least number of individuals that ensures the continued existence of a population for a determined period of time, regardless of environment change or disaster
likely to survive both predictable and unpredictable environmental variation
if a species drops below it's minimum viable pop size, chances of extinction increase dramatically
note: only a prediction
what are the density-independent factors
natural disturbances
like fires, earthquakes, and storms can contribute directly or indirectly to density-independent mortality
temperature fluctuations
also influence the growth and activity of organisms
warmer climates
can have density-independent impacts on the level of atmosphere carbon dioxide
Describe two examples for temperature fluctuations as a density-independent factor
mountain pine beetles:
burrows into pine trees, eating soft tissue beneath the bark
overwhelms and kills trees
has not been a problem until recently as beetle populations were kept in check by winter frosts and temps that routinely dropped low
recent winter shave not had low enough temps to limit the beetle population significantly
higher beetle survival rates and lack of resistance in trees lead to an increased beetle attacks
more dead trees means more release of carbon dioxide
increases the temp more leading to more beetles surviving
called a positive feedback loop
human effects
massive forest fires have turned trees into carbon sources, released the carbon dioxide stores within trees
with the increase in temp, leads to reduced precipitation, drought, and storms
these issues present great challenges for future planning and species management
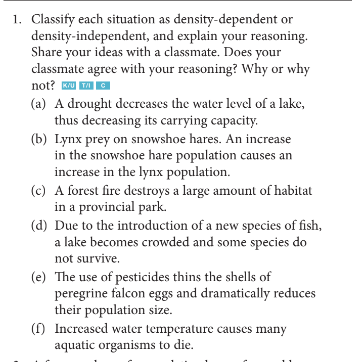
a) density-independent
drought is a natural distater that affects population regardless of pop density
b) density-dependent
predator population increases cause prey population increase
c) density-independent
natural disaster
d) density-dependent
e) density-independent
f) density-independent
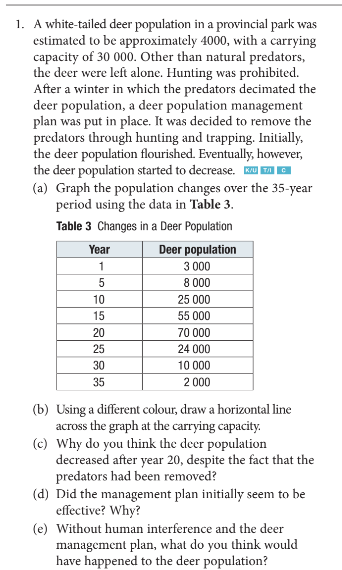
limited genetic diversity within the population
Predation: because of predetors that rely on the population density of deers as their prey to feed on them and increase their own population
competition: may introduce more competition into an environment where an increased deer pop density leads to more competition for resources
define coevolution
a process in which one species evolved in response to the evolution of another species
What are the types of coevolutionary relationships and know examples of each
predation (+/-)
when an organism feeds on another organism
predators gain nutrients and energy while prey are killed or injured
ex: northern lynx (predator) and snowshoe hare (prey)
northern lynx gains nutrients and energy while snowshoe hare are killed and injured
herbivory (+/-)
organism feeds on plants
herbivores gain nutrients and energy while plants are killed or injured
ex: white-tailed deer (herbivore) and foliage plant
mutualism (+/+)
interaction/relationship where both partners benefit each other
ex: honey bee (pollinator) and flowering plants
honey bee feeds on flowering plants while plants are able to reproduce asexually because of the pollination
Parasitism (+/-)
interaction where one species benefits and the other is harmed
parasite benefits from host while reducing the host’s in some way
ex: mistletoe, which attaches to a tree and takes water and nutrients from its host; usually stunts growth but can kill the tree with heavy infestation
Competition (-/-)
both competing populations lose access to some resources
ex: trees in a forest competing for light
commensalism (+/0)
an interaction where one species recieves benefits from the other organism without affecting them
ex: moss growing on a tree getting light and nutrients while the tree is unaffected
compare predation and herbivory
carnivores use sensory systems to locate their animal prey and specialized behaviours and anatomical structures ro capture and consume it
herbivores have comparable adaptations for locating and processing food plants
herbivorous mammals have specialized teeth to harvest and grind tough vegetation
it is predicted that an animal’s diet is a compromise between the costs and benefits associated with different types of food
an important element in food choice is the abundance of prey
what are the different types of defense mechanisms
camouflage
an organism mimics the pattern of its environment
chemical defense
an organism is chemically unattractive, either by releasing noxious odours or by concentrating poisonous chemicals in its body
behavioural defence
this defense can be passive (such as hiding,freezing or playing dead)
or active (such as fleeing, herding,mobbing,or using distraction displays)
mimicry
two types
batesian mimicry: a palatable or harmless species (mimic) resembles an unpalatable or poisonous species (model)
mullerian mimicry: two or more unpalatable species that share common predators look the same
spines and armour
various animals and plants have dard, thorny, or needle-like structures
Is predation an example of interspecific interaction or intraspecific
interspecific
pop density of one species, predator increases, while pop density of the other species,prey, decreases)
when prey population increases, predator population decreases and vise versa
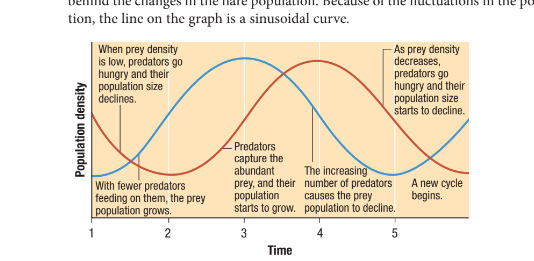
describe population cycles
when prey population increases, predator population decreases and vise versa
predation is an example of interspecific competition
ex: population of lynx (primary eats snowshoe-hares) tended to rise and fall just a year or two after the changes in snowshoe-hare population
caused by complex interactions between the hare populatios
other factors affecting the cycling of population size: catastrophic natural events, changes in climate, and human interference I.e addition of non native species and habitat destruction)
these fluctuations make a sinusoidal graph