Macroeconomics Complete
1/240
There's no tags or description
Looks like no tags are added yet.
Name | Mastery | Learn | Test | Matching | Spaced | Call with Kai |
|---|
No analytics yet
Send a link to your students to track their progress
241 Terms
Disposable income
the income left over for an individual or household after direct taxes have been paid and they have received any transfer payments. disposable income can either be saved or spent on goods/services.
Disposable income and its influence on consumer spending
If direct taxes like income tax decrease, then disposable income increases.
If wages rise, then disposable income increases.
If transfer payments to a household increase, then disposable income increases.
As disposable income increases, consumer spending tends to rise. This is due to the marginal propensity to consume, which is the proportion of an additional dollar of income that a consumer spends.
Savings
the portion of income which is not spent on consumption.
Relationship between savings and consumption
There is an inverse relationship between savings and consumption. When consumers increase savings they spend less on consumption, and when consumers decrease savings they spend more on consumption. The household savings ratio calculates household savings as a proportion of household income. This percentage is often low when an economy is booming and full of confidence and vice versa.
Interests rates on consumer spending
Interest rates are set by the government’s Central Bank, in which changes to the base rate cause commercial banks to change the lending and lending saving rates they offer customers. This means that lower interest rates tend to stimulate consumer spending because borrowing costs are reduced, meaning that there is a greater incentive to save and less incentive to borrow. If any interest rates increase, the monthly repayment on any loan or mortgage increases, where a higher loan repayment leads to less consumption.
Inflation
the sustained increase in the general price level of goods and services in an economy over time. The average price level is measured by checking the prices of a “basket” of goods/services that an average household will purchase each month. The basket of goods turned into an index and is called the consumer price index. The UK has an inflation target of CPI at 2% per annum. It leads to a decrease in the purchasing power of money. Low inflation is better than no inflation, as it is a sign of economic growth.
Deflation
the sustained decrease in the general price level. It increase the purchasing power of money but can discourage spending and investment.
Disflation
occurs when the rate of inflation declines but remains positive. Prices are still rising but at a slower rate than before.
CPI
CPI is a widely used measure of inflation in the UK. It tracks changes in the prices of a basket of goods and services purchased by an average household. The formula for CPI inflation rate is Current CPI - Previous CPI / Previous CPI x 100.
limitations of CPI as a measure of inflation
Substitution bias: CPI assumes constant consumption patterns, whereas consumers often adjust their purchases in response to changing prices. Depending on what households buy, the level of inflation for each one can vary significantly. As an average, it also ignores regional differences in inflation. This can lead to an overestimation of inflation.
Quality changes: CPI may not adequately account for quality improvements in goods and services in the basket over time. As product quality changes over time, the comparison with different time periods is less useful. This leads to an overestimation of price increases.
RPI
a measure of inflation in the UK which includes a broader range of expenditures than CPI. Although it is calculated in exactly the same way as the CPI, certain goods/services that are excluded from the CPI are included with the RPI. These include council tax, mortgage interest payments, household depreciation, and other house purchasing costs such as estate agent fees. Due to the extra inclusions, inflation measured using the RPI is usually higher than the CPI. This is mainly due to its sensitivity to interest rate changes, which affect mortgage interest.
Demand-pull inflation
occurs when AD exceeds AS, leading to upward pressure on prices and excess demand in the economy. Factors like increased consumer spending, business investment, or government expenditure can contribute to demand-pull inflation. Moreover, workers would feel less secure as their wages no longer have the same purchasing power. Moreover, the wage-price spiral may occur in which workers may demand wage increases to compensate for the higher prices. Those wage increases are now a form of cost-push inflation and drive prices even higher. If any of the four components of AD increase (consumption, investment, government spending and net exports), there will be a shift to the right of the AD curve. At the original price, there is now a condition of excess demand in the economy. As prices rise, there is a contraction of AD and an extension of SRAS. Prices for goods and services are bid up. This leads to demand-pull inflation.
If the Central Bank lowers the base rate, there is likely to be increase borrowing by firms and consumers. This will result in an increase in consumption and investment. It is likely to lead to a form of demand-pull inflation.
The Central Bank can also increase the money supply through quantitative easing. This will result in increased liquidity and lower interest rates. This is likely to lead to a form of demand-pull inflation.

Cost-push inflation
occurs when production costs increase, causing firms to raise prices to maintain profitability. Factors such as rising raw material prices, higher wages, or supply chain disruptions can lead to cost-push inflation. If any of the costs of production increase, there will be a shift to the left of SRAS curve. At the original price, there is now a condition of excess demand in the economy. As prices rise, there is a contraction of AD and an extension of SRAS. Prices for goods/services are bid up which indicates that cost-push inflation has occurred. Moreover, the wage-price spiral may occur in which workers may demand wage increases to compensate for the higher prices. Those wage increases are now a form of cost-push inflation and drive prices even higher.
Effects of Inflation on Firms
Uncertainty: Rapid price changes create uncertainty and delay investment.
Menu change costs: Price changes force firms to change their menu prices too and this can be expensive.
Effects of Inflation on Consumers
Decrease in purchasing power
Decrease in the real value of savings (as money will be worth less in real terms)
Fall in real income for those on fixed incomes/pension
Effects of Inflation on Government
Inflation erodes international competitiveness of export industries. This leads to trade imbalances, where a country may import more than it exports. As imports are a leakage and exports are an injection, this means there is less money circulating in the circular flow of income, which means the economy declines. Moreover, with a current account deficit and lack of international competitiveness, governments will focus more of their resources on gaining ground. Any policy action creates opportunity costs and trade-offs
Trade-offs involved in tackling inflation
Effects of Inflation on Workers
Demand higher wages to compensate for reduced purchasing power
While workers may see nominal wage increases, their real wages may decline due to inflation
Labour unions may negotiate for higher wages to keep pace with rising prices.
Net trade balance
Net trade balance is the difference between the value of exports and imports.
Economic growth
refers to the increase in a country’s real GDP over time. It signifies an expansion of an economy’s production capacity and is a key indicator of its overall economic health. It is typically measured by calculating the percentage change in real GDP over a specific period, such as a year.
Real GDP “at constant prices”
value of all goods and services produced in an economy in a one-year period and adjusted for inflation
nominal GDP “at current prices”
actual value of all goods/services produced in an economy in a one-year period. There has been no adjustment to the amount based on the increase in general price levels (inflation)
GDP per capita
shows the mean wealth of each resident in a country. This makes it easier to compare standards of living between countries. It is calculated using the formula GDP / the population
total GDP
represents the aggregate sum of a variable for a given population or area.
value
represents the monetary worth of goods and services produced
volume
measures the physical quantity of goods and services produced, disregarding their monetary value
GNI
measures the total income earned by a country’s residents and businesses regardless of where that income is generated during a given period. It starts with the value of all final goods and services produced within the country and then adjusts for cross-border income flows, adding income residents receive from the rest of the world and subtracting income that non-residents earn inside the country. It is a broader measure than GDP and considers income earned from overseas investments and remittances. It is often used to compare the economic well-being of a country’s residents or to set eligibility thresholds for development assistance, because it traces income to the nationality of the earner rather than to the geographic place of production.
GNI per capita
provides a much more realistic view of a country’s view of a country’s wealth than GDP/capita
national income statistics
useful for making growth comparisons between countries. they provide insights on the effectiveness of government policies and allow judgements to be made about the relative wealth and standard of living within each country. they allow comparisons to be made over the same or different time periods.
using real GDP is a better comparison than nominal GDP
one country may have a much higher rate of inflation. real GDP provides a better comparison
using real GDP/capita provides better information than real GDP as it takes population differences into account
using real GNI/capita is a more realistic metric for analysing the income available per person than GDP/capita
using real GNI/capita provides information on the income that is actually within a country’s borders. this value can be significantly different from GDP/capita
purchasing power parity
a conversion factor that can be applied to GDP, GNI and GNP. it calculates the relative purchasing power of different currencies. it shows the number of units of a country’s currency that are required to buy the same baskets of products in the local economy, as $1 would buy the same products in the USA or another country. the aim of PPP is to help make a more accurate standard of living comparison between countries where goods and services cost different amounts. it seems the cost of living is much higher in advanced countries, however, if an advanced country seems to have a higher GNP/capita than a developing country, it could be argued that the advanced country has better standards of living. conversely, if the GNP/capita in an advanced country was less than the developing country, it could be argued that the citizens of the developing country enjoy a higher standard of living as they spend less income to acquire the same goods and services. Although the measurement is more sophisticated, it still has limitations due to the countries having different tastes and preferences. choosing the items to use in the basket of products is difficult.
limitations of using GDP for comparisons
lack of information provided of inequality: the distribution of income in an economy is provided as an average (GDP/capita) and the differences in the standard of living within the same country can be significant
quality of goods and services: GDP provides no information on the increase/decrease in the quality of goods/services over time. if quality worsens but prices are lower, then the standard of living is judged to have increased. the poor quality may actually have decreased the standard of living.
does not include voluntary work: if it included voluntary work, then GDP/capita would be higher
differences in work hours: GDP data does not capture the amount of time taken to produce the GDP/capita. in one country, where it takes less time to generate the income than in a similar country, the standard of living would actually be higher.
environmental factors: GDP does not capture the environmental and health impacts of generating the income within a country (externalities). in one country, where there are fewer externalities in generating the income, the standard of living would be higher
national happiness
focuses on health, relationships, the environment, education, satisfaction at work and living conditions. national income statistics tend to present more positive data while national happiness surveys yield more normative data. there is a link between income and happiness and the easterlin paradox is often used to explain it. happiness and increases in income have a direct relationship up to a point. beyond that point, the relationship is less evident
unemployed
someone who is not working but actively seeking work. they are part of the labour force and in the population of working age so are economically active.
labour force
consists of all workers actively working and the unemployed (who are seeking work). the labour force is usually between the ages of 16-65
non-labour force
includes all those not seeking work e.g. stay-at-home parents, pensioners, schoolchildren and students. economically inactive are those between 16-65 and not working or not seeking work e.g. early retired.
claimant count
a measure of unemployment based on the number of people who are claiming unemployment-related benefits, such as Jobseeker’s Allowance. it provides a narrow definition of unemployment, as it only includes those actively seeking and receiving government benefits. it also requires claimants to meet regularly with a “work coach”
International Labour Organisation and the UK Labour Force Survey
the ILO defines unemployment as individuals of working age who are without work, actively seeking work, and available for work. the UK Labour Force Survey is the primary source of unemployment data in the UK and follows the ILO definition. It comes in the form of an extensive survey sent to a random sample of around 60,000 UK households every quarter. respondents self-determine if they are unemployed based on the ILO criteria: ready to work within the next two weeks, have actively looked for work in the past one month. the same survey is used globally so it’s useful for making international comparisons. it provides a broader and more comprehensive picture of unemployment, including those ineligible for benefits.
unemployment
refers to individuals who are not currently employed but are actively seeking and available for work
under-employment
occurs when individuals are employed but their job does not fully utilize their skills and qualifications. this can result in part-time work, low wages, or jobs below their skill level. it is often a response to cyclical unemployment when workers who have lost their jobs in a weak economy are willing to take part-time jobs or accept roles outside of their main skill base. It is also a consequence of structural unemployment unless workers retrain and gain new skills, it will be harder for them to gain full employment
employment rate
measures the proportion of the working-age population in employment. a rising employment rate indicates economic growth
unemployment rate
measures the proportion of the labour force actively seeking work. a high unemployment rate indicates economic problems
inactivity rate
measures the proportion of the working-age population that is not in the labour force. it can indicate a lack of job opportunities or demographic factors
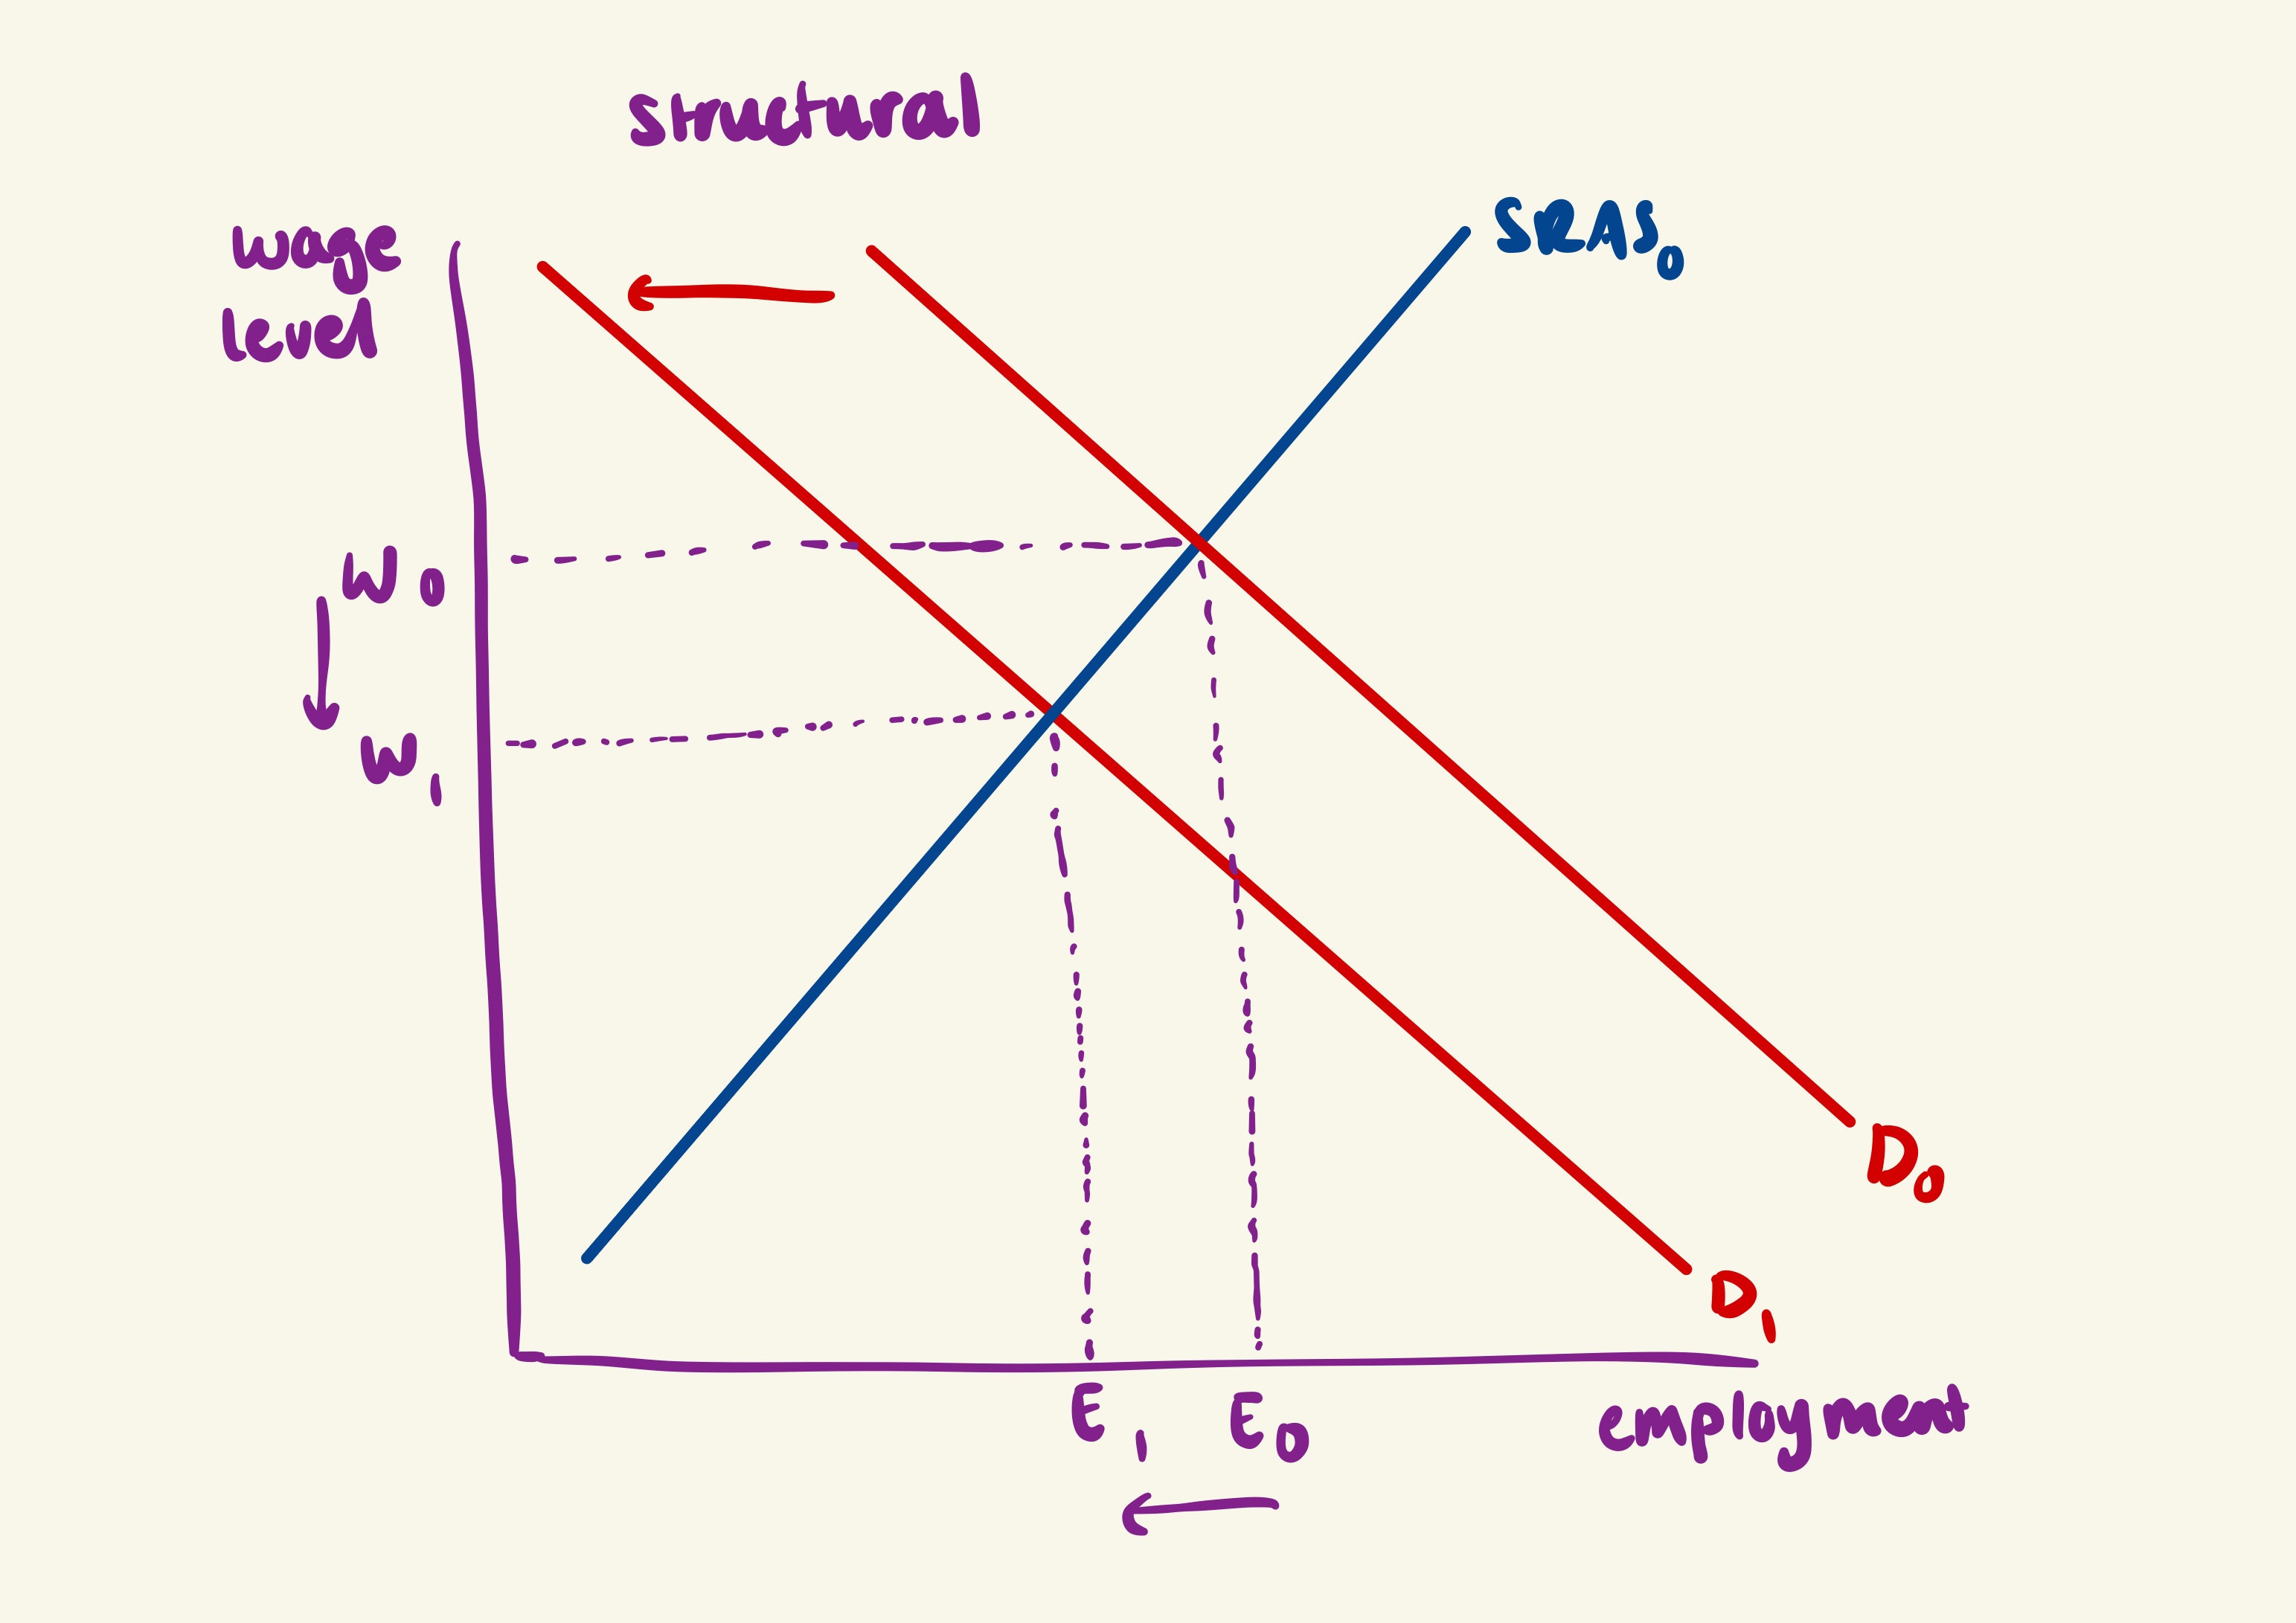
structural unemployment
occurs when there is a mismatch between jobs and skills in the economy. it usually happens as the structure of the economy changes. there is no longer need for a specific type of worker. many Western industries have relocated production to China, causing structural unemployment in their economies. unless workers receive help to retain, they are often left unemployed or under-employed. If many workers become structurally unemployed, their incomes fall. This leads to lower disposable income which leads to lower consumer spending. Businesses would then experience lower demands for goods and services which may incentivise firms to reduce production and lay off workers, creating demand-deficient unemployment. This could also lead to frictional unemployment as workers must leave declining sectors, in which they then search for new jobs or retrain. During this transition period, they are temporarily unemployed. This creates frictional unemployment while workers look for suitable jobs.
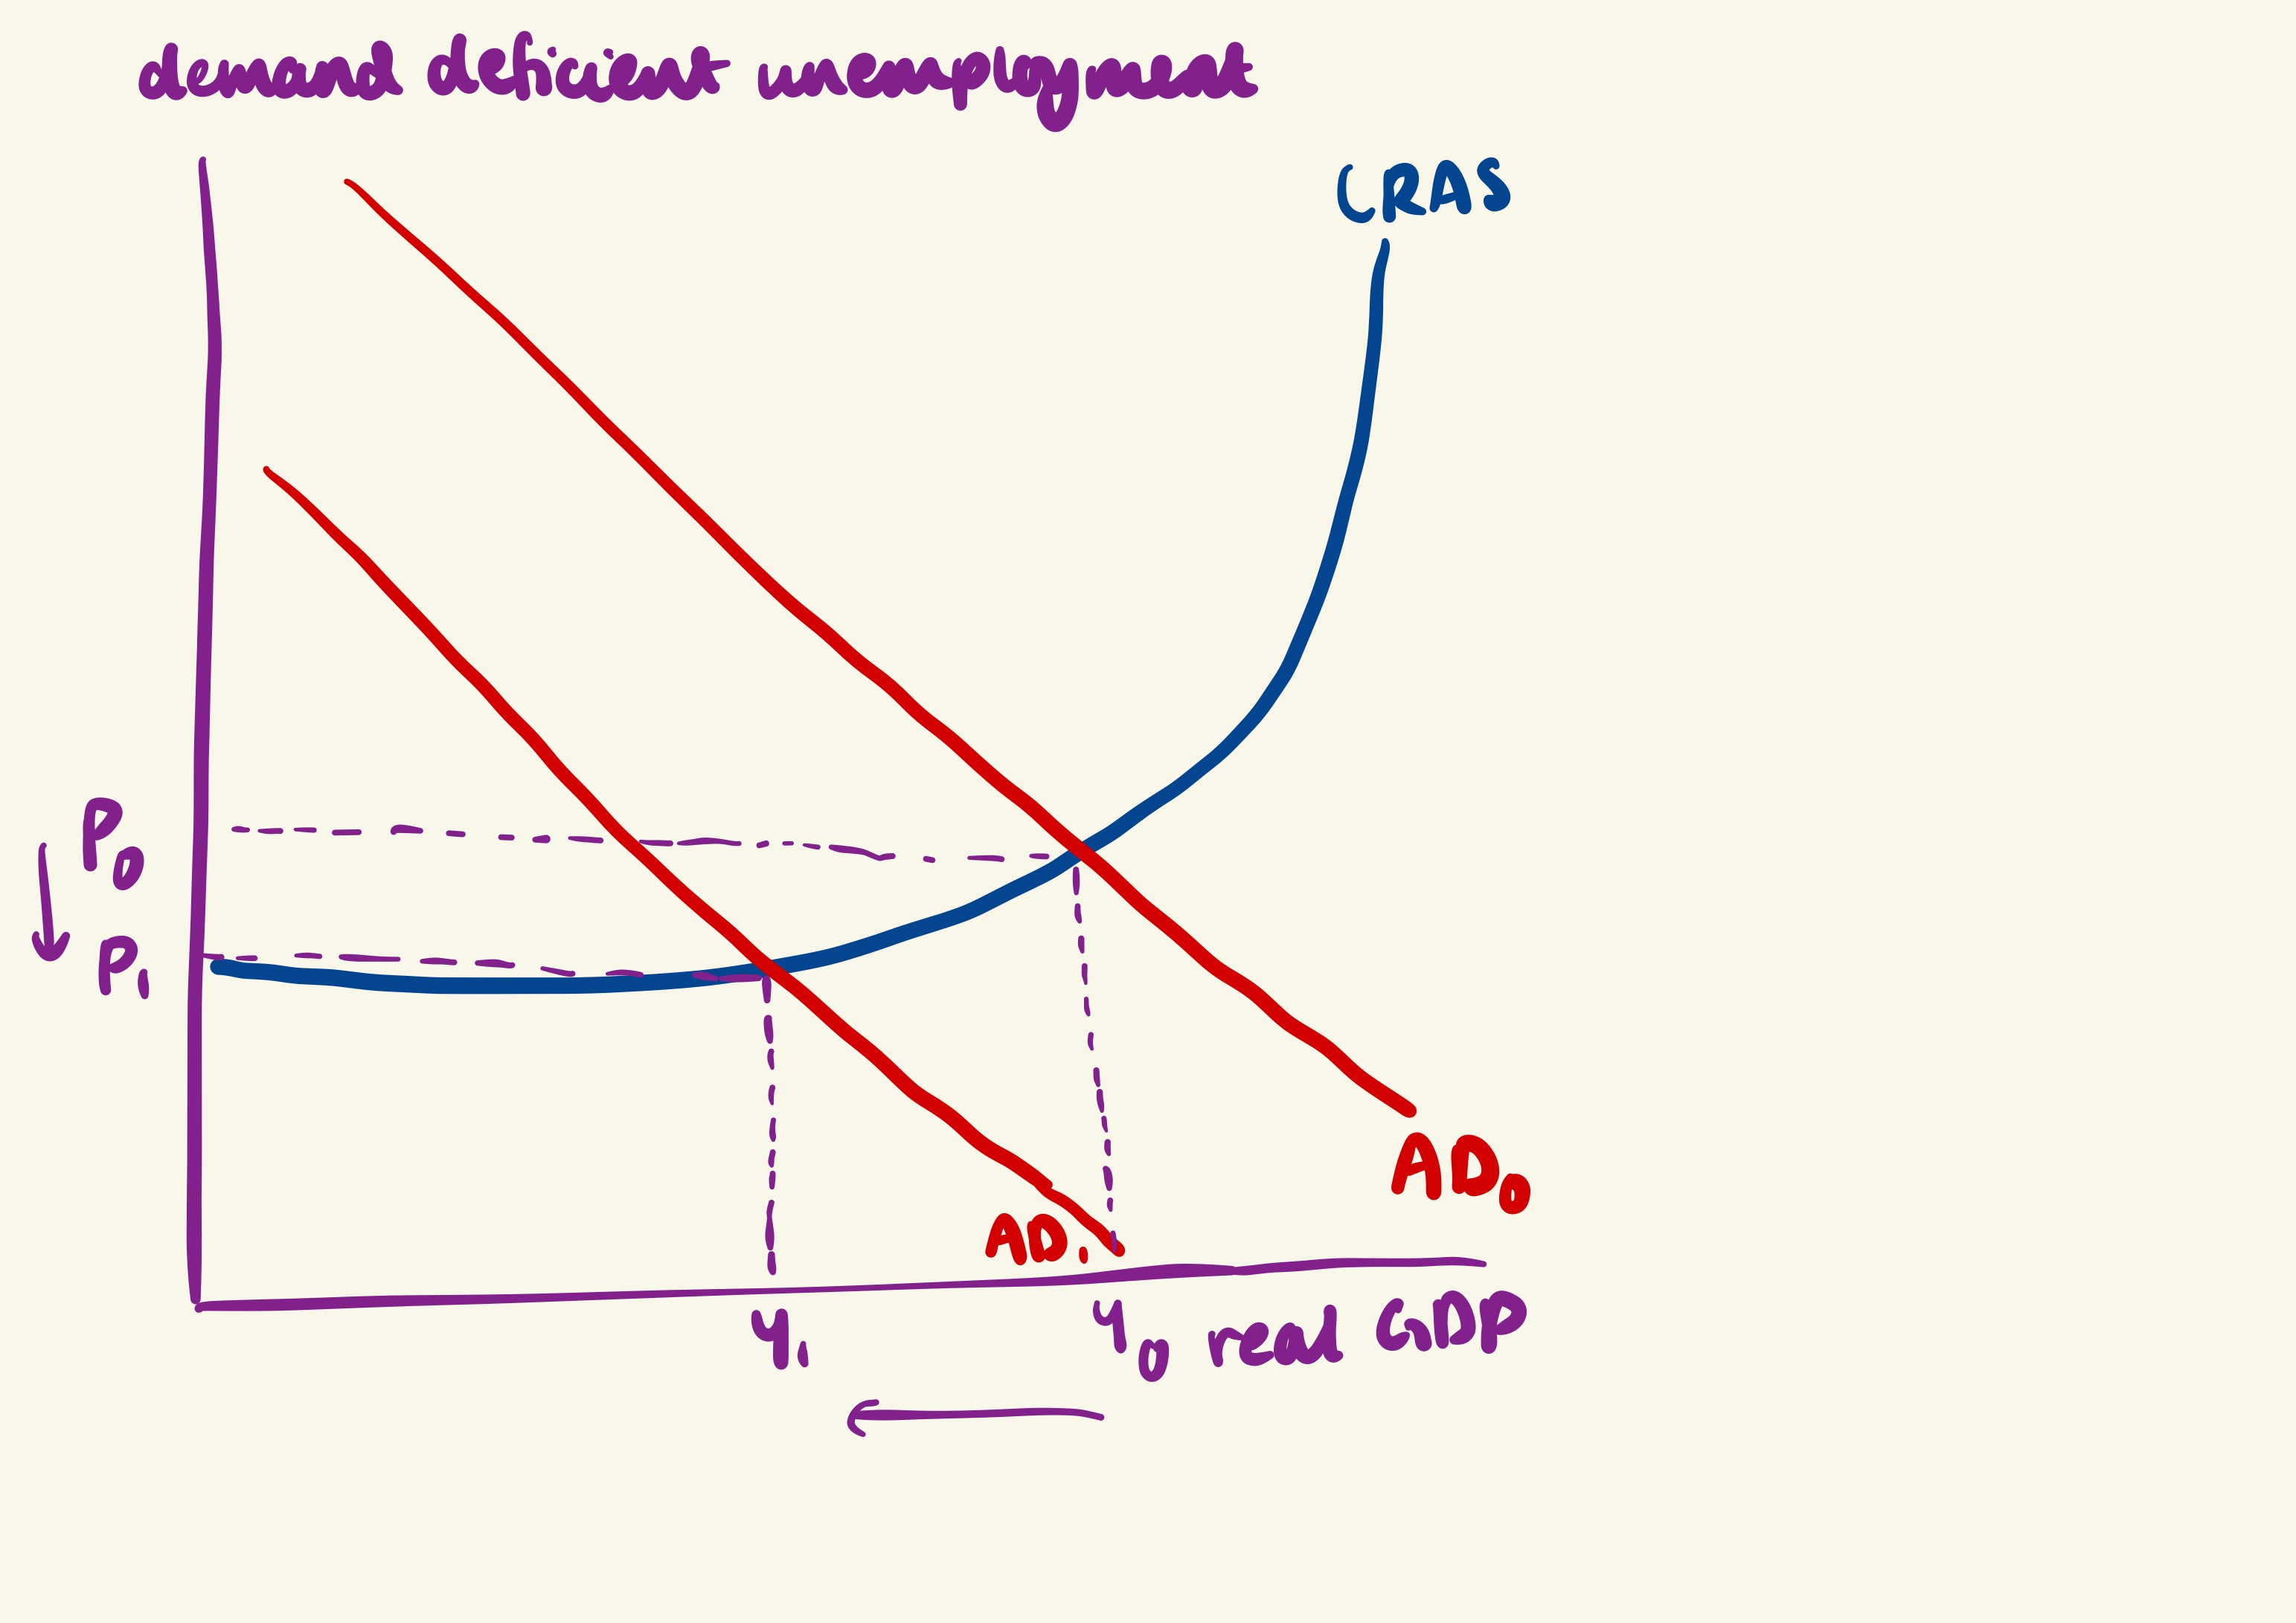
cyclical/demand-deficient unemployment
caused by a fall in AD in an economy. this typically happens during a slow down or recession. the demand for labour is a demand derived from the demand for goods/services. as output falls in the economy, firms lay off workers. As firms cut jobs due to low demand, workers who lose jobs must search for new employment which leads to frictional unemployment during the job search. This could alternatively lead to structural unemployment as if demand remains low for a long time, workers stay unemployed for long periods to the point where their skills become outdated or they lose work experience.
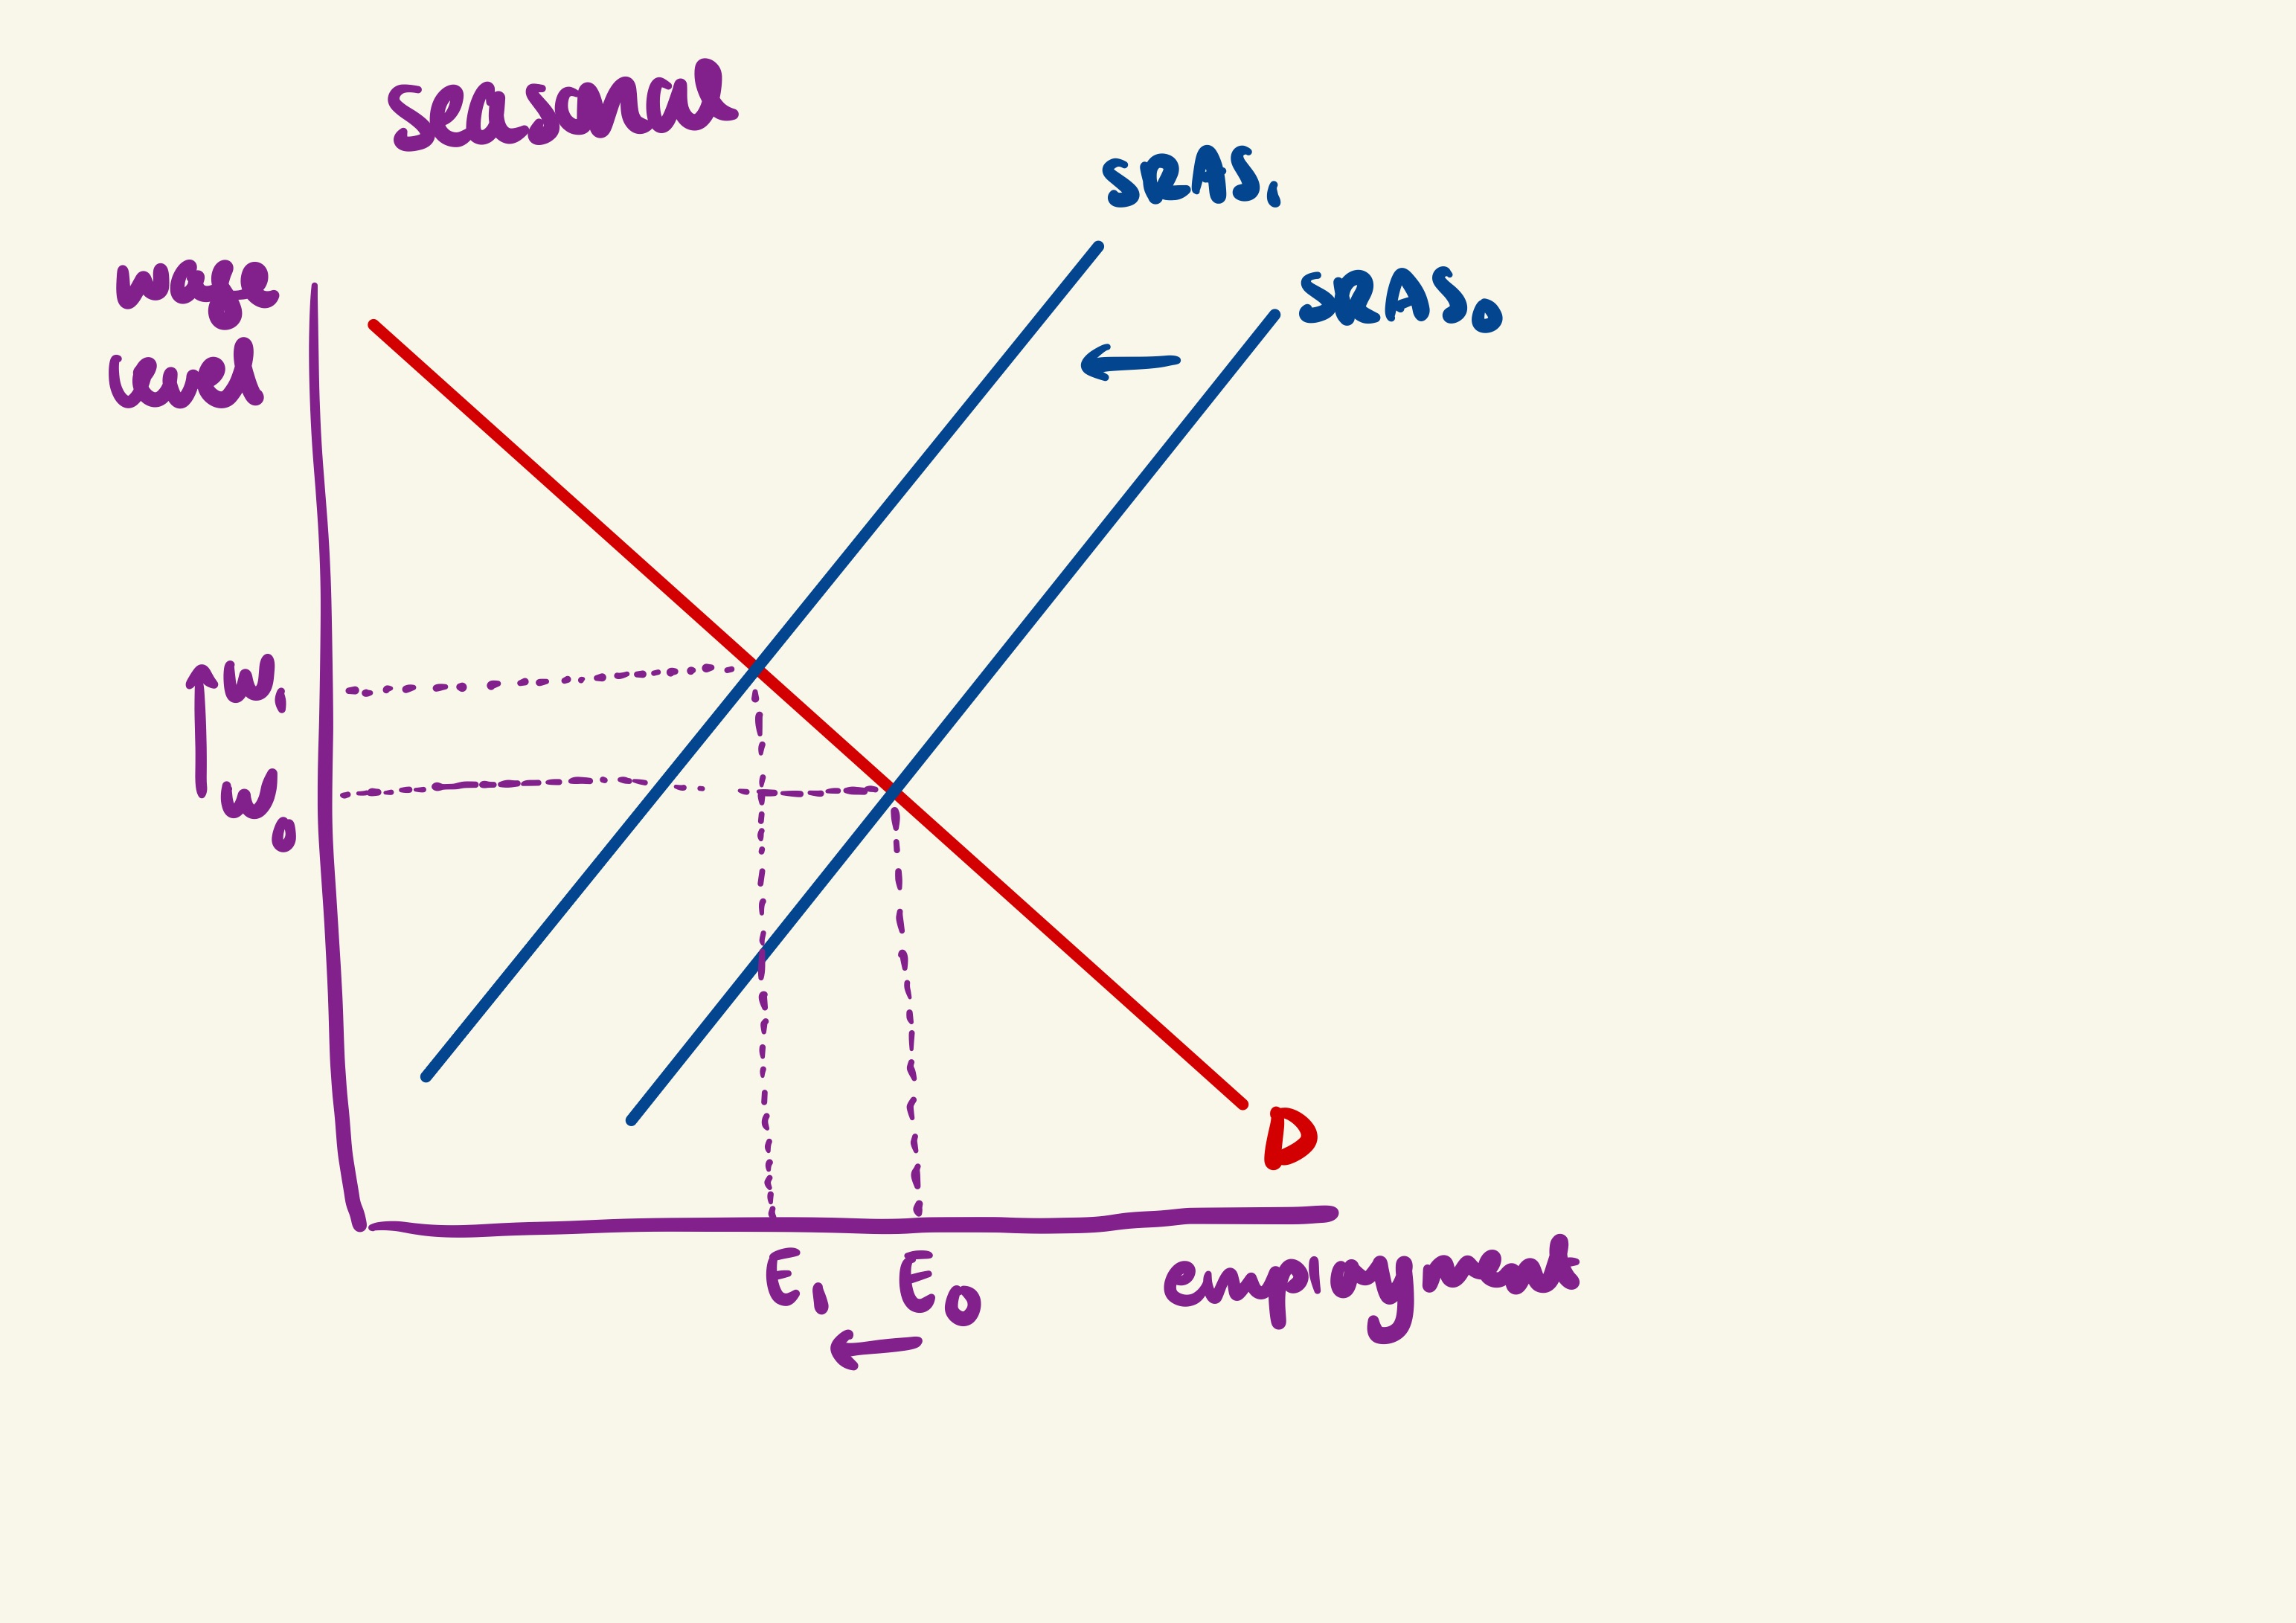
seasonal unemployment
occurs as certain seasons come to an end and labour is not required until the next season. As seasonal layoffs reduce workers’ income in off-peak periods, lower spending reduces AD in the wider economy and other businesses may experience falling sales and lay off workers, leading to demand-deficient unemployment.
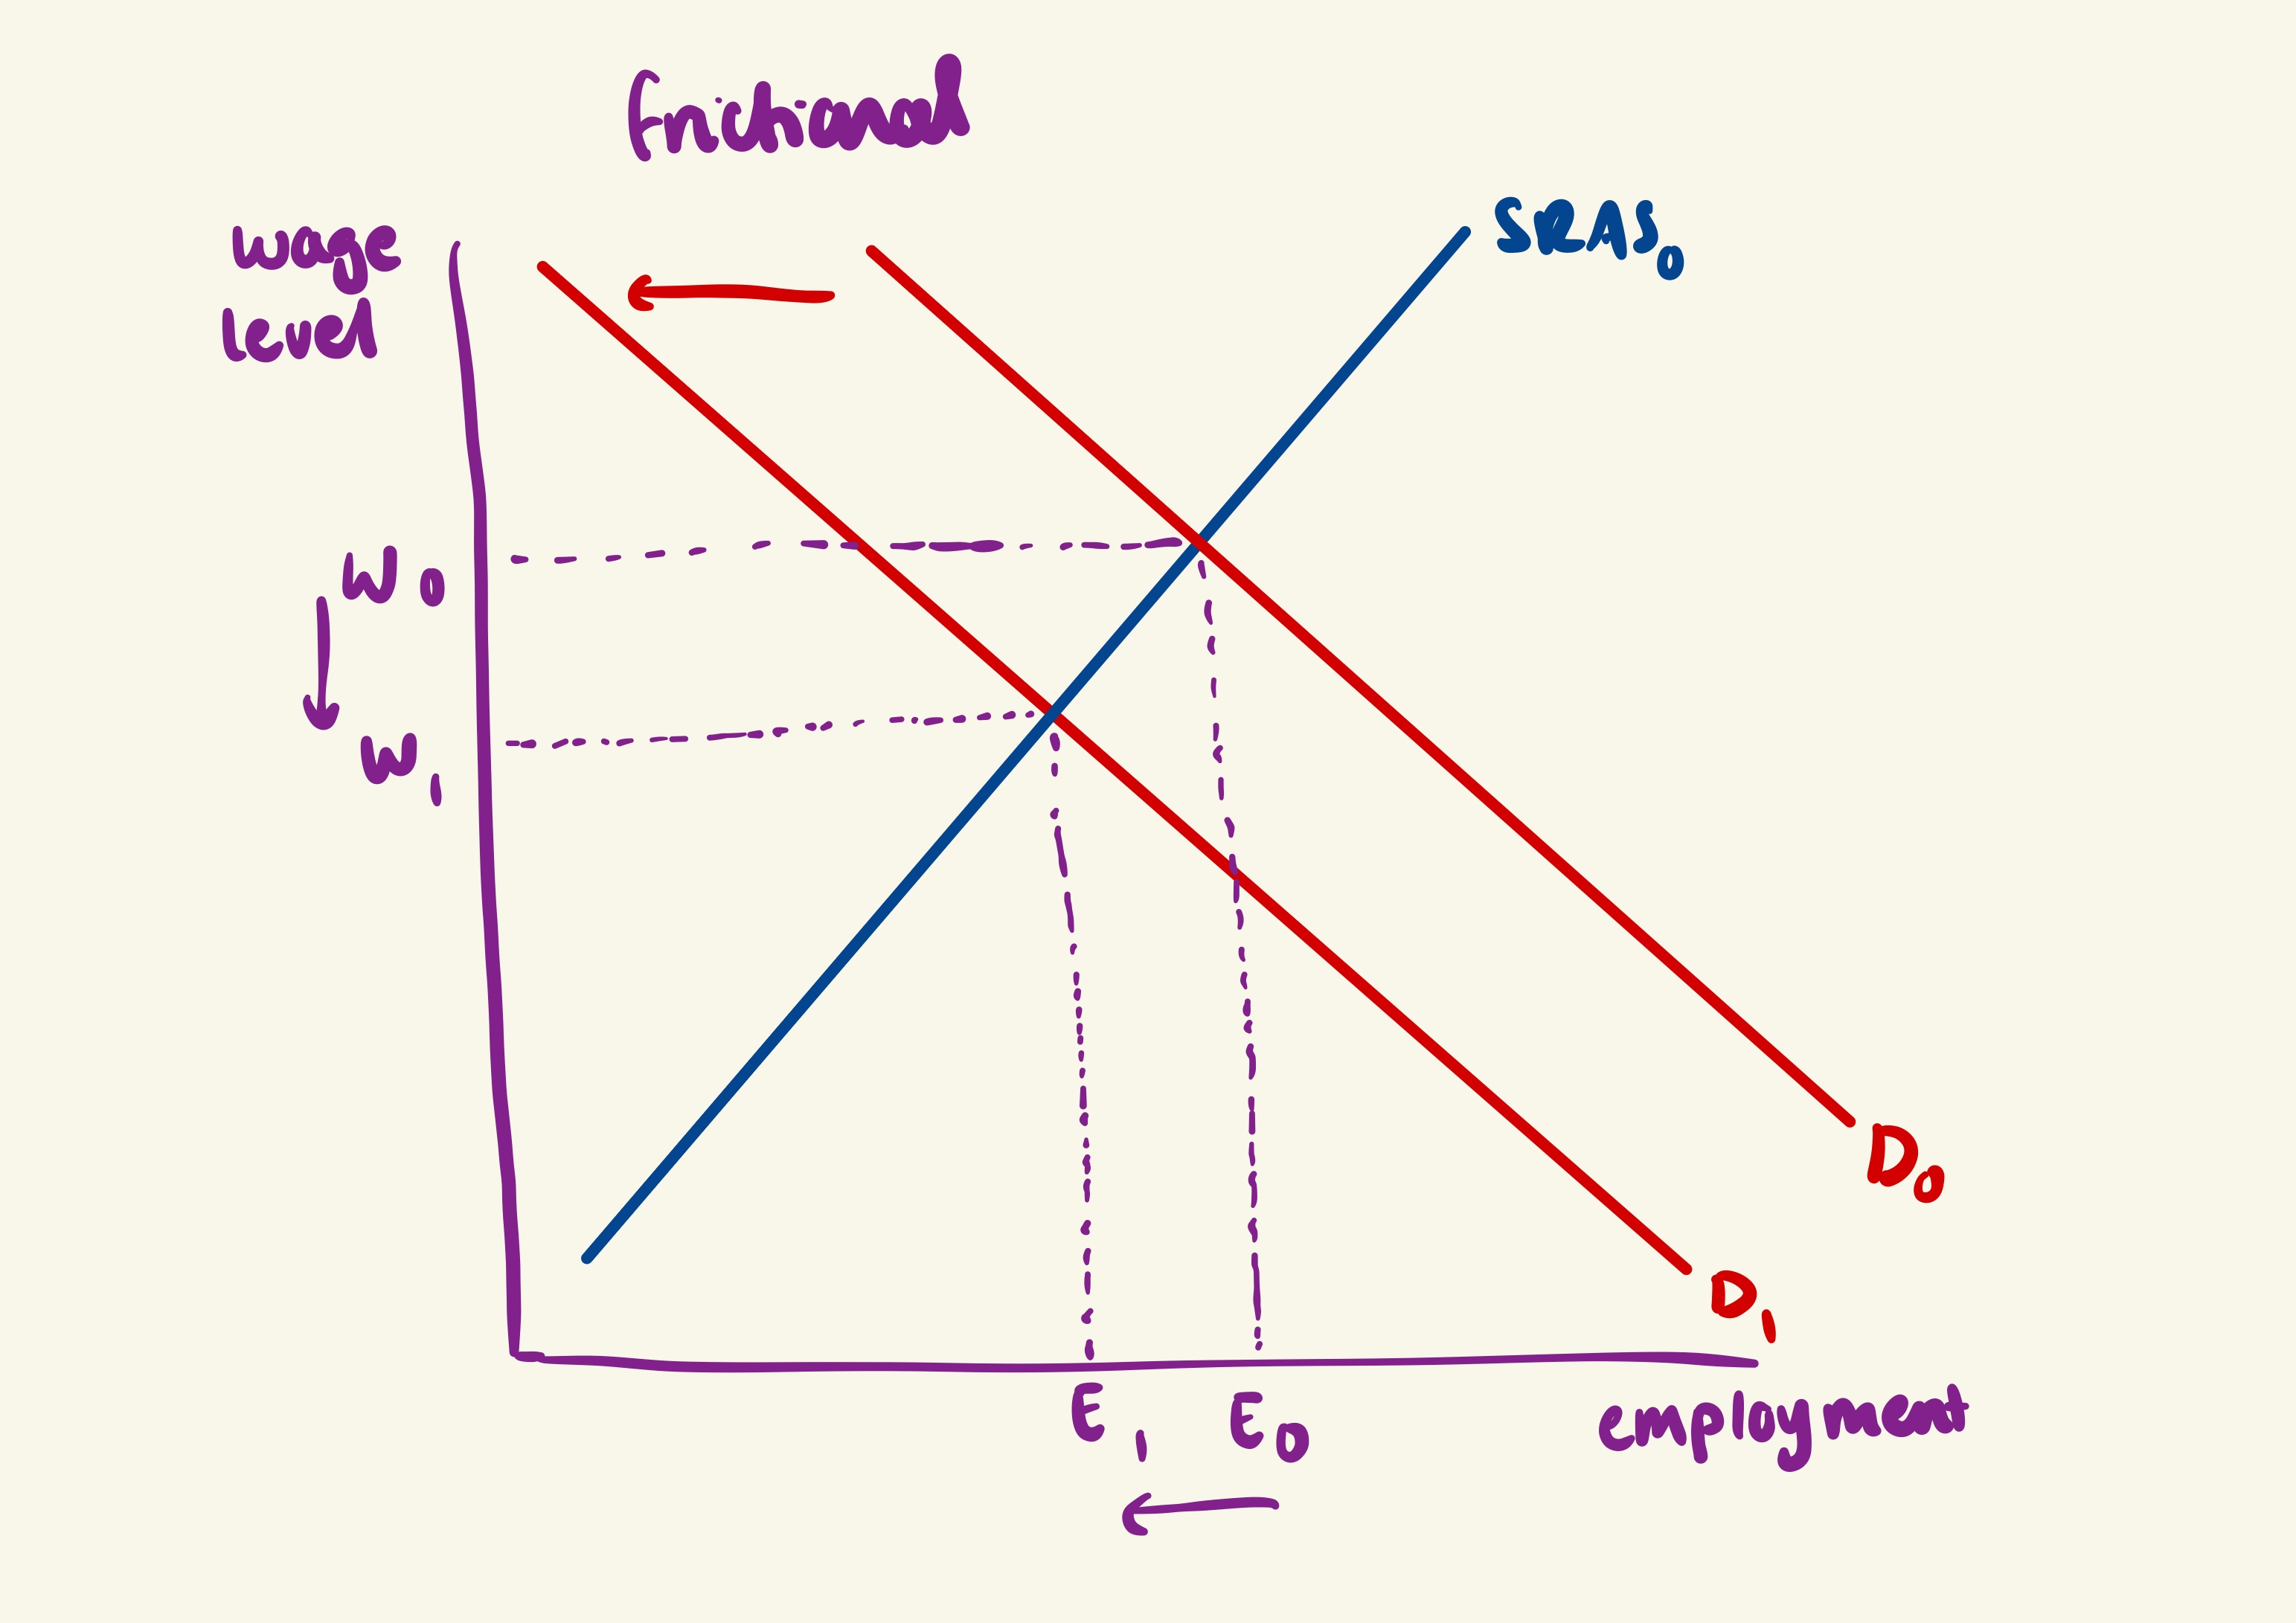
frictional unemployment
occurs when workers are between jobs. this is usually short-term unemployment. workers have voluntarily left their previous job to search for another.
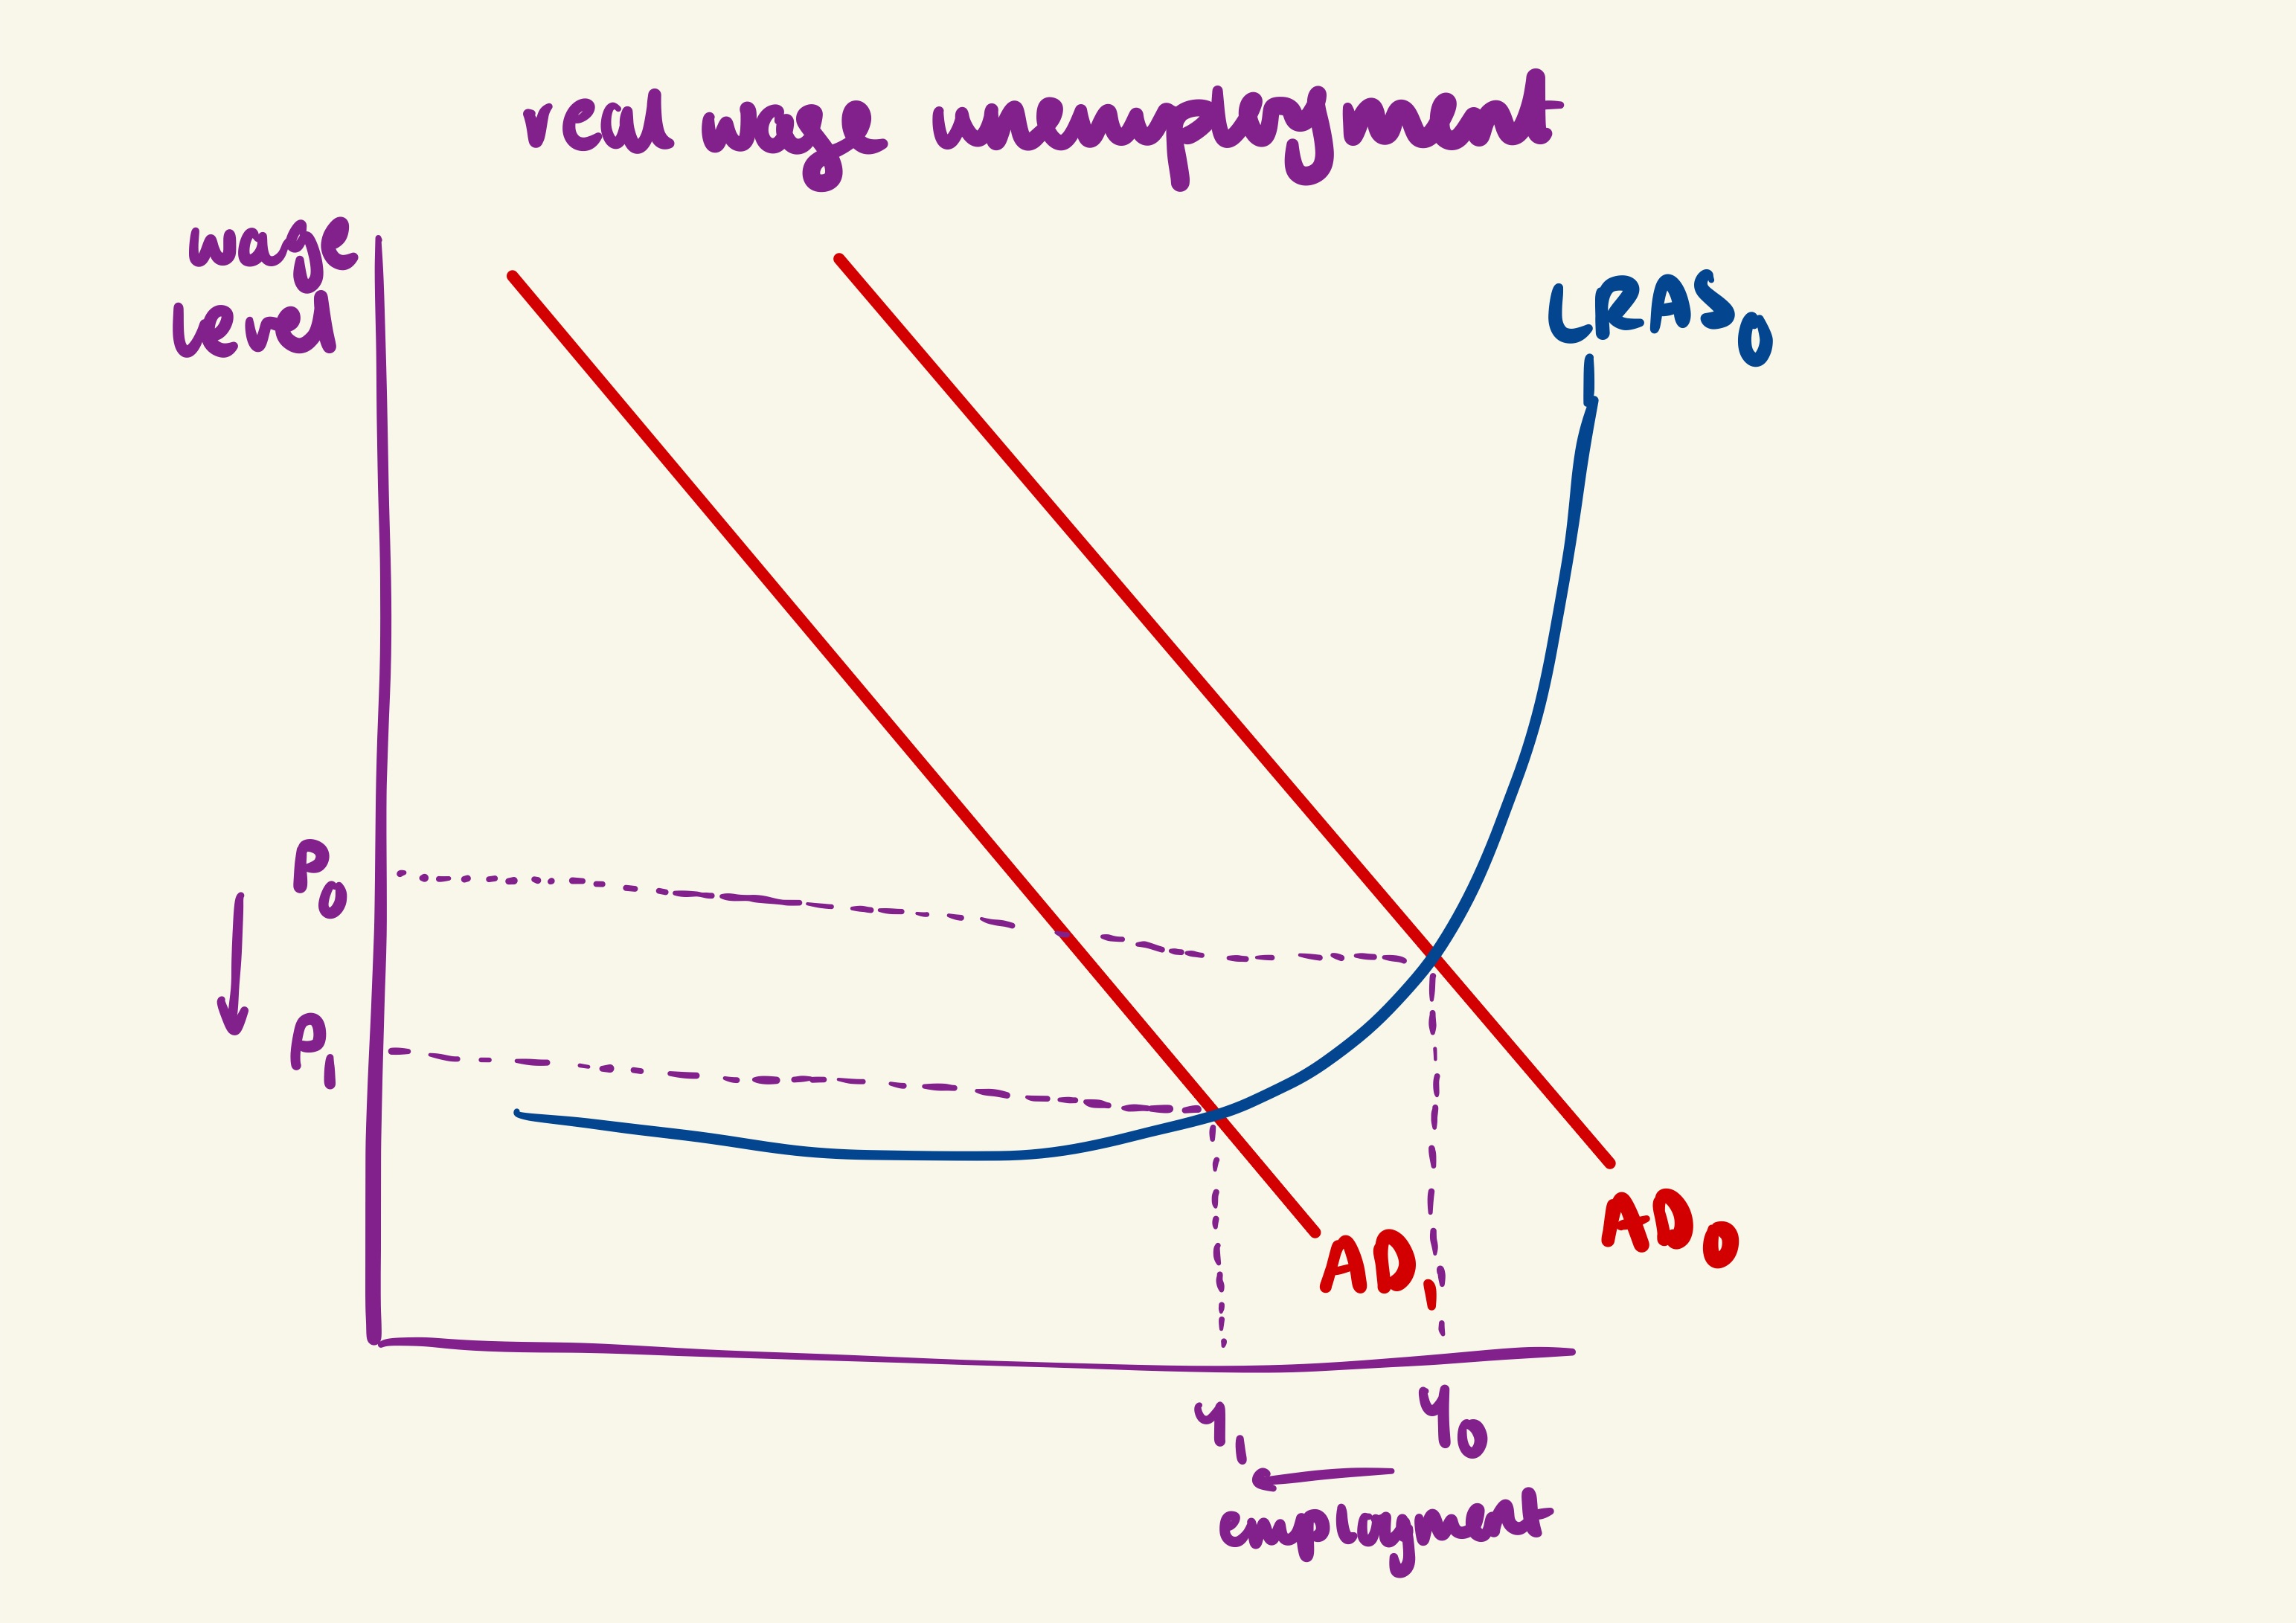
real wage unemployment
occurs when wages are inflexible at a point higher than the free-market equilibrium wage, leading to job cuts or an unwillingness to hire. usually caused by the existence of minimum wage laws. the higher wage creates an excess supply of labour. this excess supply represents real wage unemployment. As firms may replace expensive labour with automation or move production, certain workers’ skills become less demanded which leads to structural unemployment.
How does migration impact employment
Immigrants usually fill vacancies that the local citizens cannot or will not fill. These tend to be manual labour, dangerous, and low-skilled jobs. The increased supply of labour may push down wages in the economy, especially for low-skill jobs. Skills are crucial for employment. A highly skilled workforce is more adaptable and less prone to unemployment in a changing economy. Lower average wages are an incentive for employers to hire more workers and employment may increase as a result. As immigration results in an increased population, consumption in the economy would increase leading to a greater output requiring more labour so it creates more jobs.
How does migration impact unemployment
As immigrants may displace some local workers, this could increase the level of unemployment. The dependents of immigrants may be unable to find work and register as unemployed.
Effects of unemployment on consumers
reduced income → less disposable income → lower consumer spending, which impacts firms
Effects of unemployment on firms
loss of sales revenue, loss of output/production, changes in the skill level in the economy. high unemployment can lead to a larger labour pool, potentially reducing wage pressures
Effects of unemployment on workers
lost income, reduced jobs prospects and psychological stress
Effects of unemployment on government
increased spending on unemployment benefits and lost tax revenue, social issues
Effects of unemployment on society
social unrest, reduced well-being and inequality. also increased home-lessness and increased anti-social behaviour.
Balance of payments
is a record of all the economic transactions between a country and the rest of the world. it is divided into two main components: the current account and the capital and financial account
Current account
records the net income that an economy gains from all transactions related to the goods and services along with payments related to the transfer of primary and secondary income. the current account balance is often expressed as a % of GDP. this allows for easy international comparisons. this includes the balance of trade in goods/services, income balance and current transfers. the UK government has a macroeconomic aim to reduce the current account imbalance to achieve as close to equilibrium as possible.
balance of trades in goods
goods are also referred to as visible exports/imports. it measures the difference between the value of a country’s exports and imports of tangible goods. a trade surplus occurs when when exports exceed imports, and a trade deficit occurs when imports exceed exports.
balance of trade in services
services are also referred to as invisible exports/imporit accounts for the value of services traded internationally, such as tourism, financial services, and consulting. a surplus occurs when a country exports more services than it imports.
income balance
net income or primary, consists of income transfers by citizens and corporations. credits are received from UK citizens who are abroad and send remittances home. debits are sent by foreigners working in the UK back to their countries. this includes earnings from abroad and payments made to foreign investors. a surplus indicates that a country earns more from its foreign investments than it pays to foreign investors.
current transfers
current transfers or secondary income are typically payments at government level between countries. this category includes foreign aid, remittances sent by migrant workers, and other unilateral transfers. it can be positive (inflows) or negative (outflows)
current account deficit
occurs when a country’s imports of goods, services, income and transfers exceeds its exports in those categories. it implies that the country is spending more than it is earning from the rest of the world. usually occurs when the debits from imports > credits from exports. the UK has run a current account deficit since 1985. export-led economic growth would help it become less negative, although realistically this is unlikely for a long time. however, with increasing income and wealth in an economy, the value of imports rises. consumers enjoy the variety of goods/services abroad. rising imports push the balance towards a greater deficit. if the current account is running a deficit, this has a negative impact on AD as X-M is net negative. net exports are a component of AD. if net exports are negative, then AD decreases.
current account surplus
occurs when a country’s exports of goods, services, income and transfers exceed its imports. It implies that the country is earning more than it is spending internationally. usually occurs when the debits from imports < credits from exports
current account imbalances impact on exchange rates
a persistent current account deficit may lead to a depreciation of country’s currency, making exports more competitive and imports more expensive. this can help correct the deficit.
current account imbalances impact on economic growth
a surplus can lead to higher savings and investment, potentially boosting economic growth. however a persistent deficit may lead to unsustainable borrowing
current account imbalances impact on employment
a trade surplus may support job creation in export-oriented industries, while a deficit can lead to job losses in import-competing sectors
current account imbalances impact on inflation
a depreciating currency (due to a deficit) can lead to imported inflation, affecting the domestic price level. to correct the current account deficit, the government could raise tariffs which would likely decrease imports brought by households. firms that rely on imports for raw materials used in production. these higher costs are likely to be passed on to consumers in the form of higher prices and reducing the current account deficit has come at the expense of increased inflation in the economy, there has been a trade-off
interconnectedness of economies through international trade
international trade fosters economic interdependence among countries. one country’s economic policies and developments can have ripple effects globally.
supply chain integration: many products involve components from multiple countries. disruptions in one country can disrupt global supply chains.
benefits of trade: international trade allows countries to specialise in producing what they are most efficient at, leading of efficiency gains and a higher standards of living
AD
the total demand of all goods/services in an economy at any given price level. its value is often calculated using the expenditure approach.
describe the relationship between AD and economic growth
if AD increases then economic growth has occurred and vice versa.
consumption
the total spending on goods/services by consumers(households) in economy
investments
the total spending on capital goods by firms
government spending
the total spending by the government in the economy. it includes public sector salaries, payments for provision of merit and public goods etc., it does not include transfer payments
net exports
difference between the revenue gained from selling goods/services abroad and the expenditure on goods/services abroad and the expenditure on goods/services from abroad. individuals, firms and government export/import
relative importance of the components of AD
depending on the country, the value of each component and its contribution to AD can vary significantly. government spending in Sweden is 48.2% of AD and in the UK, it is 20.9% of AD. the % that each component contributes to AD in the UK is approximately:
consumption: approximately 60% of GDP
investment: around 17% of GDP
government spending: approximately 20.9% of GDP
net exports: approximately -2.9% of GDP, indicating a trade deficit
a 1% increase in consumption or government spending will have a much larger impact on economic growth than a 1% increase on net exports.
AD curve
the relationship between the average price level and the total output in an economy is shown in an AD curve. the AD curve is downward sloping due to three reasons
interest rate effect
wealth effect
exchange rate effect

interest rate effect
at higher average price level, there are likely to be higher interest rates. higher interest rates. higher interest rates reduce investment and are incentive for households to save - and vice versa
wealth effect
As AP increases, the purchasing power of households decreases and the AD falls - and vice versa
Exchange rate effect
As AP falls, interest rates are likely to fall too. Lower interest rates lower the exchange rate. With a lower exchange rate, the economy’s goods/services are more attractive abroad and exports increase, thereby increasing real GDP
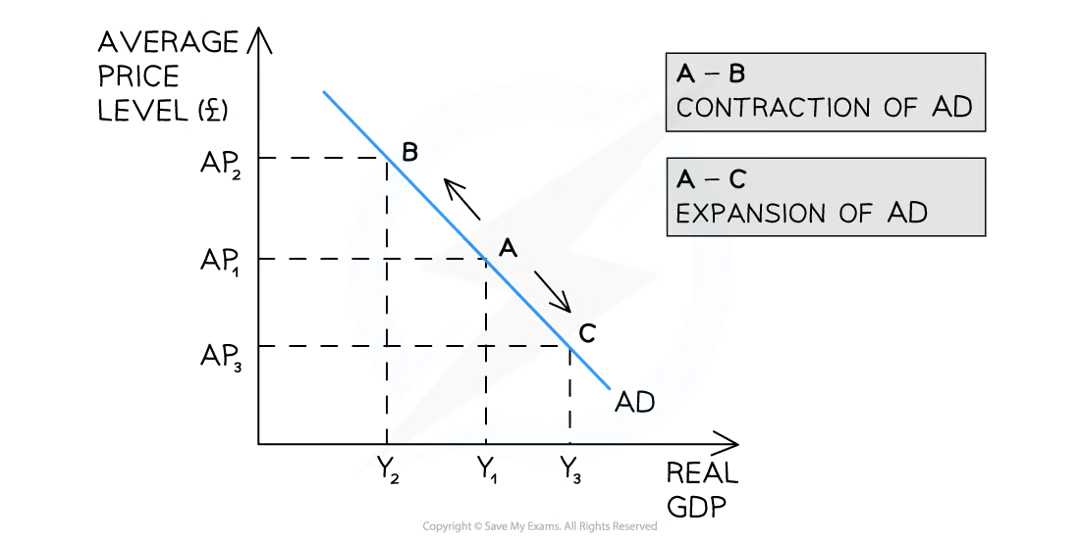
movement along the AD curve
when there is a change in the PL in an economy, there is a movement along the AD curve. An increase in the AP (ceteris paribus) from AP1 → AP2 leads to a movement along the AD curve from A→B. There is a contraction of real GDP from Y1 → Y2. A decrease in the AP (ceteris paribus) from AP1 → AP3 leads to a movement along the AD curve from A → C. There is an expansion of real GDP (output) from Y1 → Y3<
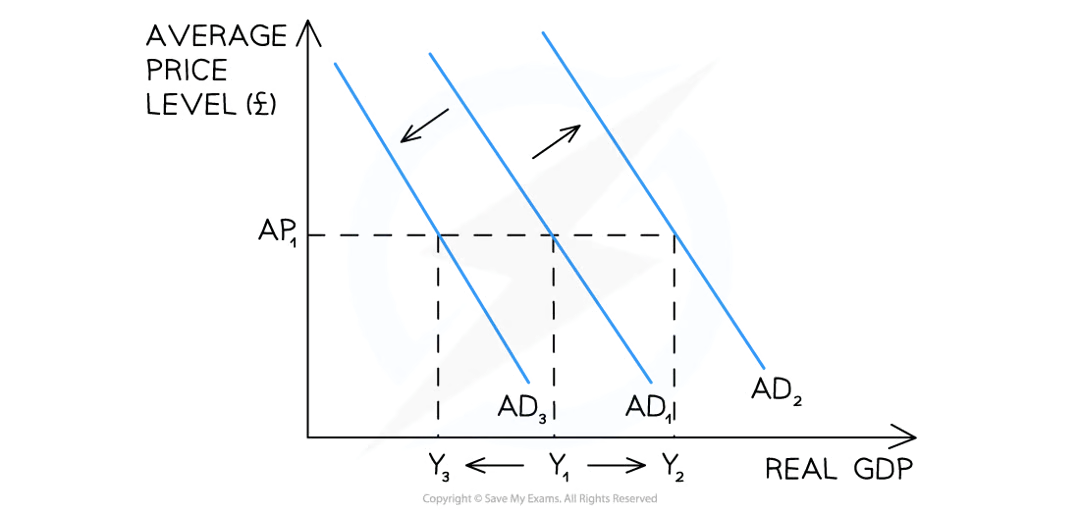
shift of the entire AD curve
whenever there is a change in any of the determinants of AD (C, I, G, X, M) in an economy, there is a shift of the entire AD curve. An increase in any one of the determinants of AD results in a shift right of the entire curve from AD1 → AD2. At every price level, real GDP has increased from Y1 → Y2. A decrease in any one of the determinants of AD results in a shift left of the entire curve from AD1 → AD3. At every price level, real GDP has decreased from Y1 → Y3.
investment
total spending on capital goods by firms. it helps to increase the capacity (production possibilities) of an economy. increased capacity = increased potential economic growth.
Depreciation
decrease in monetary value of a capital good (asset) over time. Replacing old capital goods does not necessarily increase capacity. it can, if the replacement technology means an increase in capacity is possible.
Gross investment
total amount of spending on capital goods. this spending includes replacing old capital goods and purchasing new capital goods.
Net investment
gross investment - depreciation. this metric provides information on the addition of new capital goods to an economy. it gives better indication of the extra production possibilities that have been created through investment by firms.
influences on investment
firms will choose to invest if they feel confident that they will make a good return on their investment. the decision to invest is linked to the business objective of profit maximisation.
rate of economic growth: increasing growth sends a signal that higher output will generate higher profits. the faster the economic growth, the greater the urgency to invest in order to match the level of demand and if it is shrinking, firms will not need to replace their old machines to investment will fall.
most investment by firms is financed through business loans. decreasing interest rates encourage investment. there is a mostly inverse relationship between investment and interest rates
interest rates: higher interest rates means that the cost of borrowing increases, so a business needs to be more confident of good profits in order to cover the extra costs of borrowing. other investment is done through retained profits or savings. a rise in interest rates increases the opportunity cost of a business using retained profits as they are able to get higher interest payments than before.
demand for exports: if demand for exports increases, firms will likely invest to meet the global demand. demand for exports can increase if the exchange rate depreciates. goods/services now seem cheaper to foreigners
influence of government and regulations: government intervention can increase investment e.g. subsidies. government regulation can decrease investment as it raises the cost of production for firms and can lower profits
business expectations and confidence: the longer a period of economic growth, the higher business confidence will be. if growth slows, future expectations of profits will decrease, and investment decisions will become harder
Keynes and animal spirits: John Keynes believed firms exhibit too much optimism in the good times and take too many risks. they run with the mood of the economy and make less rational investment decisions as they follow the herd
access to credit: the easier the access to loanable funds, the higher the levels of investment. some developing economies have low access to credit and this holds back investment
government expenditure
the trade cycle, or business cycle, refers to the fluctuations in economic activity that an economy experiences over a period, typically measured by changes in GDP and other economic indicators.
influences on government expenditure
trade/business cycle: unemployment decreases, with a booming economy, leading to a lower level of means-tested benefit payments and vice versa. tax revenue increases with a booming economy and can be used to pay back government debt or increase expenditure on public/merit goods and vice versa
policy aims: fiscal policy is set once a year and announced during the presentation of the government’s budget. expenditure is directly related to the government’s objectives and policy aims. expansionary fiscal policy is used during recessions to boost economic activity through increased spending and tax cuts. contractionary fiscal policy is used during booms to cool down the economy by reducing spending and increasing taxes.
political factors: government priorities, party policies, and political stability can significantly impact spending decisions
social needs: demographic changes, such as aging populations, can increase expenditure on healthcare and pensions
economic conditions: inflation rates, unemployment levels and economic growth can affect government spending
debt levels: high public debt can constrain government expenditure due to the need for debt servicing.
external factors: international events, trade relations and global economic conditions
real income
the income of individuals or nations adjusted for inflation.
impact on domestic income on real income
if domestic income increases, higher real incomes typically lead to increased consumption including imported goods, potentially worsening the trade balance.
impact on foreign income on real income
if foreign income increases, higher real incomes abroad can boost demand for exports from other countries, improving the trade balance.
exchange rates
value of one currency for the purpose of conversion to another.
depreciation
a weaker domestic currency makes exports cheaper and imports more expensive, potentially improving the trade balance.
appreciation
a stronger domestic currency makes exports more expensive and imports cheaper, potentially worsening the trade balance.
state of the world economy
the overall health and trends of the global economy
impact of global economic growth on the state of the world economy
when the global economy is strong, demand for goods and services increases, benefiting exporting countries.
impact of global recessions on the state of the world economy
during economy downturns, global demand drops, negatively affecting export-dependent countries
protectionism
refers to government actions and policies that restrict international trade to protect local businesses and jobs
high protectionism
tariffs, quotas and other trade barriers can reduce imports, potentially improving the trade balance but also risking retaliatory measures
low protectionism
more open trade policies can increase imports, potentially worsening the trade balance but promoting competition and efficiency
non-price factors
these include aspects other than price that affect trade, such as quality, innovation, branding and trade agreements
impact of quality and innovation on non-price factors
high-quality, innovative products can maintain strong export performance despite price changes.