Air pollution
1/100
Earn XP
Description and Tags
Air pollution
Name | Mastery | Learn | Test | Matching | Spaced | Call with Kai |
|---|
No analytics yet
Send a link to your students to track their progress
101 Terms
Donora smog
•On October 26, 1948, people in Donora, Pennsylvania woke up to a dense fog that lasted 5 days
•The town has a large steel mill that used high-sulfur coal and a plant that roasted sulfur-containing ores
•People complained of difficulty breathing, stomach pain, headaches, nausea, and choking
•Within 1 month, 70 people died and 6,000 got sick
•Mill owners did not think their mills were responsible
Aerosol
microscopic liquid or solid particles (dust, pollen, sea salts, etc.) from land and water
Air pollutants
substances in the atmosphere (gases and aerosols) that have harmful effects
Level of air pollution
•The amount of pollutants entering the air
•The volume into which the pollution is added
•Mechanisms that remove pollutants from the air
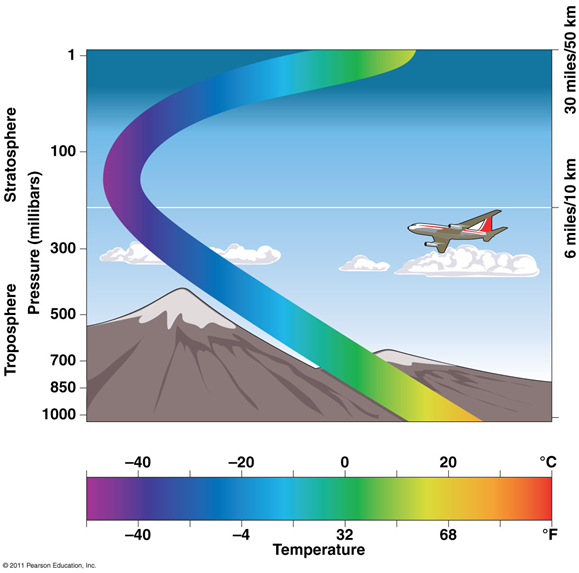
Troposphere
the lower atmosphere
•The site and source of weather, water vapor, clouds
•Pollutants are removed within hours or days
•Pollutants in the upper troposphere can persist for days

Stratosphere
Above troposphere
•Pollutants in the stratosphere are resistant to cleansing
•Ozone-depleting chemicals (chlorine, bromine)
Natural air pollutant
•volcanoes, fires, dust storms
•Plants emit volatile organic compounds
•Mechanisms in the biosphere remove, assimilate, and recycle natural pollutants
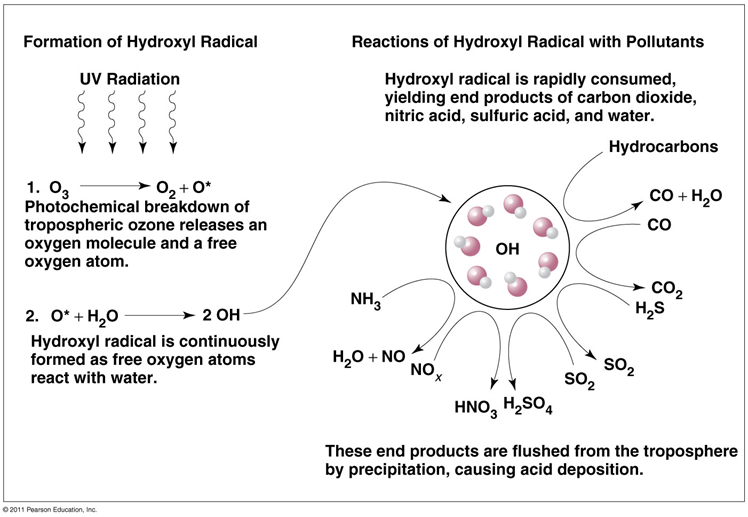
Hydroxyl radical (OH)
a naturally occurring compound
•Oxidizes many gaseous pollutants to harmless products brought to land or water by precipitation
•They also remove anthropogenic pollutants from the air
•Highly reactive hydrocarbons are rapidly oxidized
•Nitrogen oxides (NOX) are oxidized within a day
•Less reactive substances (e.g., CO) take months or years (CH4)
•Atmospheric levels of hydroxyl are determined by levels of anthropogenic air pollutants
•Hydroxyl’s cleansing power is used up
•Pollutants are able to build up
Sea salt
a cleansing agent that helps form raindrops
•Picked up by wind flowing over oceans
Sunlight
Breaks down organic molecules
Industrial Smog
smoke + fog
•An irritating, grayish mix of soot, sulfur compounds, and water vapor
•In industrialized, cool areas that use coal
•China, India, Korea, eastern European countries
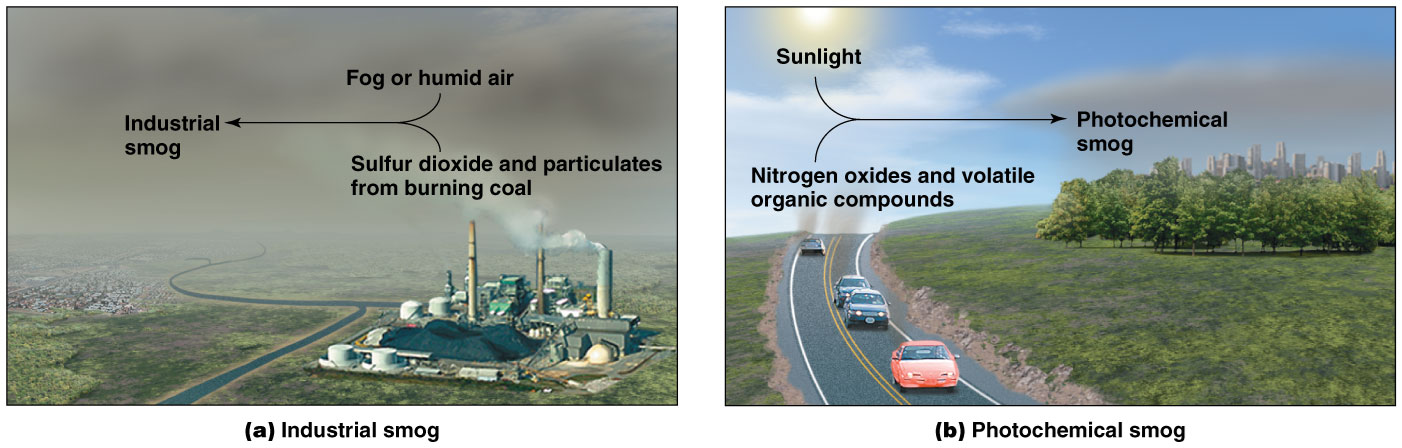
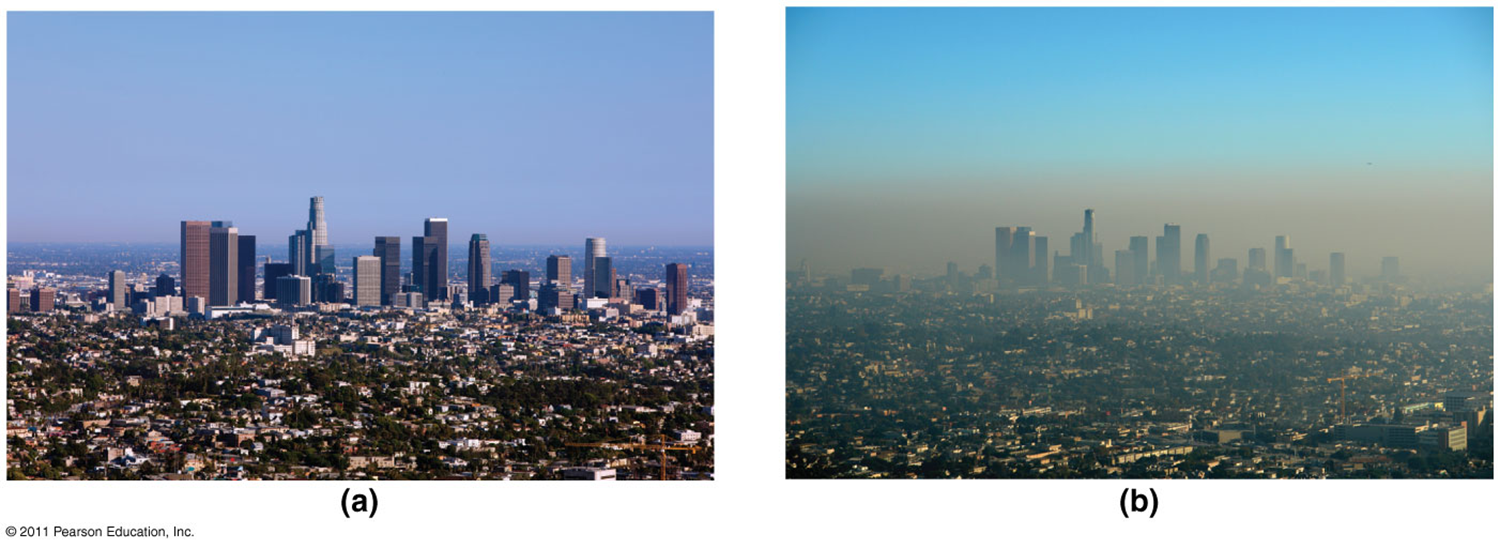
Photochemical smog
•in cities with huge freeway systems
•A brownish, irritating haze in warm, sunny areas
•Arises during the morning traffic
•Pollutants from vehicle exhaust are acted on by sunlight
Nitrogen oxides, volatile organic compounds

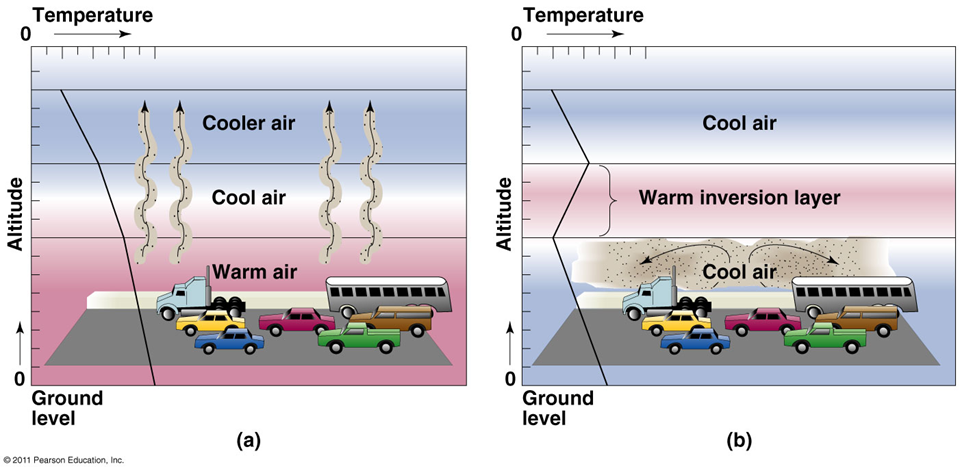
Temperature inversion
warm air overlays cooler air
•Often occurs at night and is usually short-lived
•Sun heats the air and pollutants are carried away
•Cloudy weather prevents heating air so pollutants stay
•Mountains can further trap smog (e.g., Los Angeles)

Impact of temperature inversions
•Long-term temperature inversions allow pollutants to build up to dangerous levels
•People with breathing problems should stay inside
•Smog causes headaches, nausea, eye/throat irritation
•It aggravates asthma, emphysema
•Air pollution disasters: air pollution reaches lethal levels
•Under severe temperature inversions
•In 1952, 4,000 people died in London
Atmospheric brown cloud (ABC)
•relatively new
•1–3 km blanket of pollution over south/central Asia
•Similar to North Temperate Zone’s aerosol pollution
•But persists year round and has a different make up
•ABC: black carbon and soot
•From burning biomass and fossil fuels (coal, diesel)
Impact of atmospheric brown cloud
dimming over large cities, less rainfall, heating of air, decreased reflection of snow and ice
•Weaker Indian monsoons, less crops, health effects
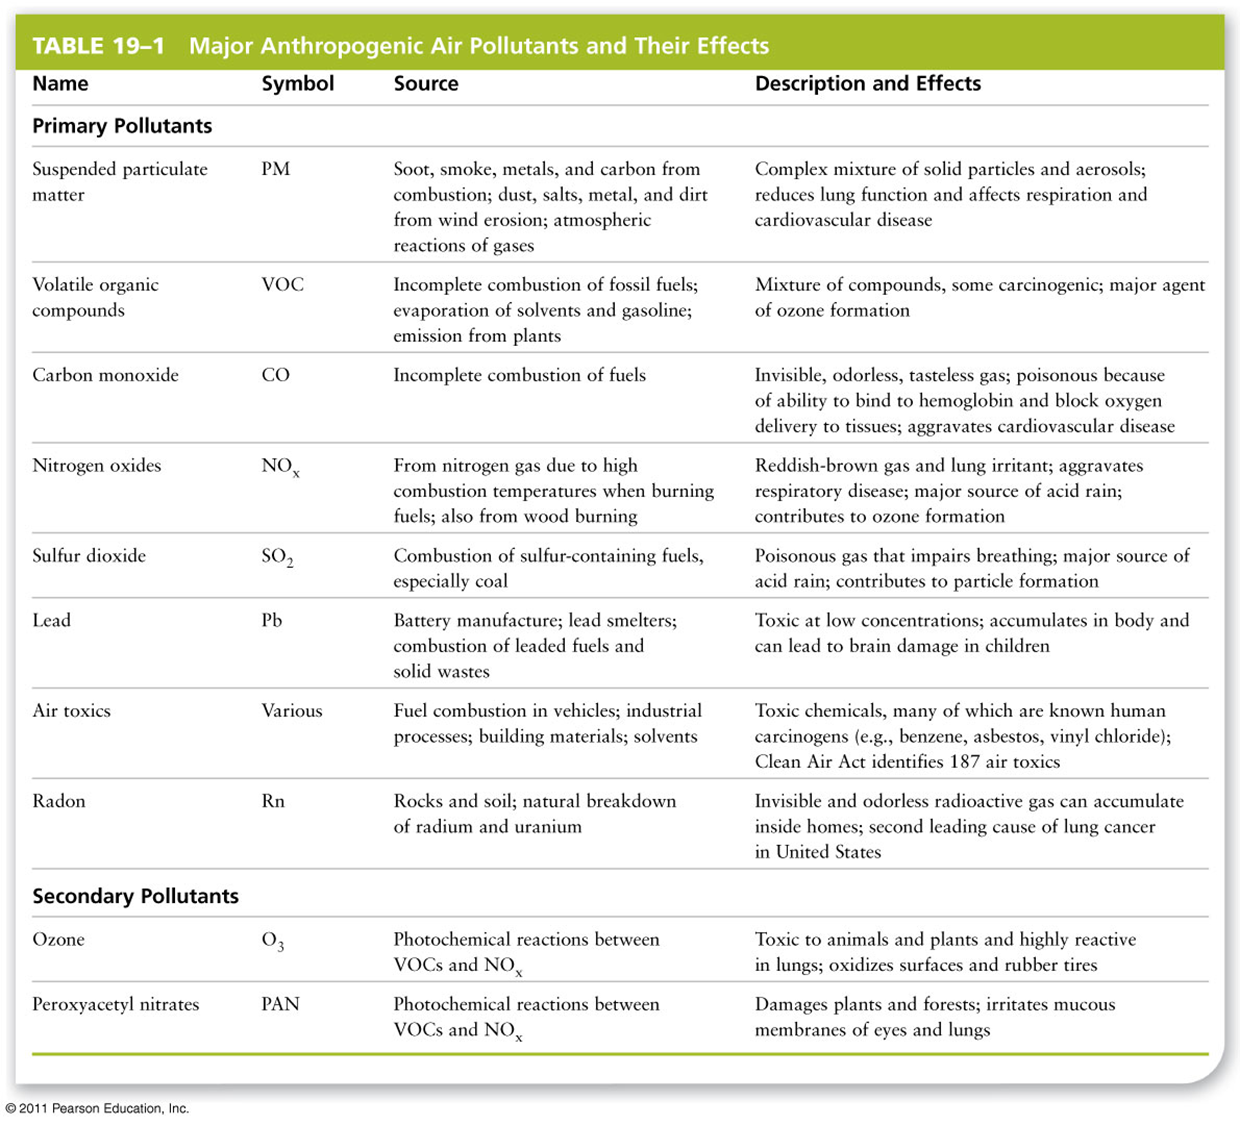
Primary pollutants
•direct products of combustion and evaporation
•Particulates, VOCs, CO, NOx, SO2, lead, air toxics
Secondary pollutants
reactions of primary pollutants in the air
•Ozone, peroxyacetyl nitrates (PANs), sulfuric and nitric acids
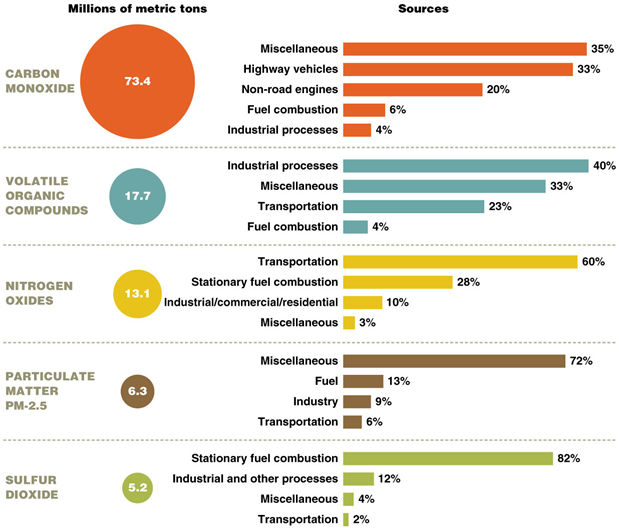
Origins of primary pollutants
•Power plants: are the major source of sulfur dioxide
•Industrial plants: particulates
•Transportation: carbon monoxide, nitrogen oxides
•Burning fossil fuels and wastes: soot, smoke
•Unburned fragments of fuel molecules: VOCs
Origin of nitrogen oxides (NOx)
•nitrogen gas is oxidized to nitric oxide (NO) under high combustion temperatures
•Nitric oxide and oxygen form nitrogen dioxide (NO2; photochemical smog) and nitrogen tetroxide (N2O4)
Clearinghouse for inventories and emissions factors
•Operated by the EPA
•Tracks trends in national emissions of primary pollutants from all sources
Ambient concentrations of pollutants in the ai
•Measured by the EPA
•Thousands of monitoring stations in the U.S.
•2013 air pollution levels in the U.S.: 116 million tons
•1970: 301 million tons
•Shows the success of the Clean Air Act regulations
Air pollutant effects
Impact of clean air act
Comparison of percent reductions in the emission of six criteria air pollutants between 1970 and 2013. PM2.5 comparison values are from 1990, when data were first gathered, and 2013.
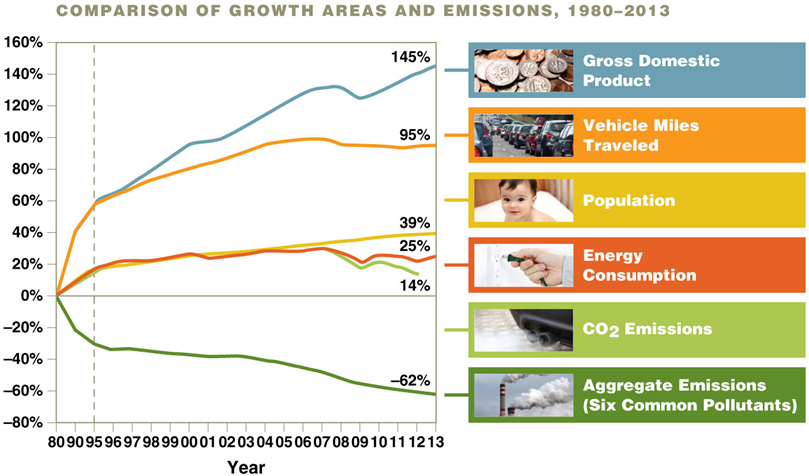
Growth vs. Emissions
Emissions have decreased, despite increased gross domestic product, miles traveled, population, and energy use
Lead
the sixth type of primary pollutant
Far smaller emissions than the first five primary pollutants
•Added to gasoline to reduce engine knock
•Phased out by the EPA during the 1980s and 1990s
•Emissions remained airborne and traveled great distances
•U.S. air concentrations have dropped by 99%
•Decreased emissions in the U.S. and other nations have had a global impact
•Further reductions must come from industry and smelters
Radon
produced by spontaneous decay of fissionable material in rocks and soils
•Escapes naturally
•Seeps into buildings through foundation cracks and basement floors
•May collect in enclosed structures (basements)
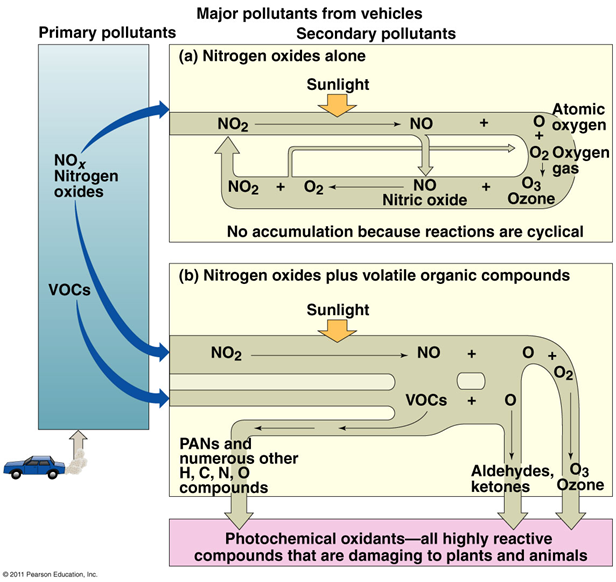
Photochemical oxidants
ozone and other reactive organic compounds formed by nitrogen oxides and VOCs
•Sunlight provides the energy to drive the reactions
Ozone concentrations
•preindustrial times: 10–15 ppb
•Unpolluted, summer air in North America: 20–50 ppb
•Polluted air: 150 ppb or more (very unhealthy)
•Ambient U.S. ozone levels decreased 30% since 1980
•But only a few percent in the 2000s
•Ozone standards are leaders in nonattainment areas
•108 million live in areas not meeting ozone standards
Ozone formation
•Nitrogen dioxide absorbs light energy and splits
•Forms nitric oxide and atomic oxygen
•The oxygen combines with oxygen gas, forming ozone
•Ozone and nitric oxide usually react to form NO2 and O2
•No accumulation of ozone
•When VOCs are present, nitric oxide reacts with them
•Creates highly reactive, damaging peroxyacetyl nitrates (PANs)
•Oxidized PANs produce aldehydes and ketones
•Ozone accumulates
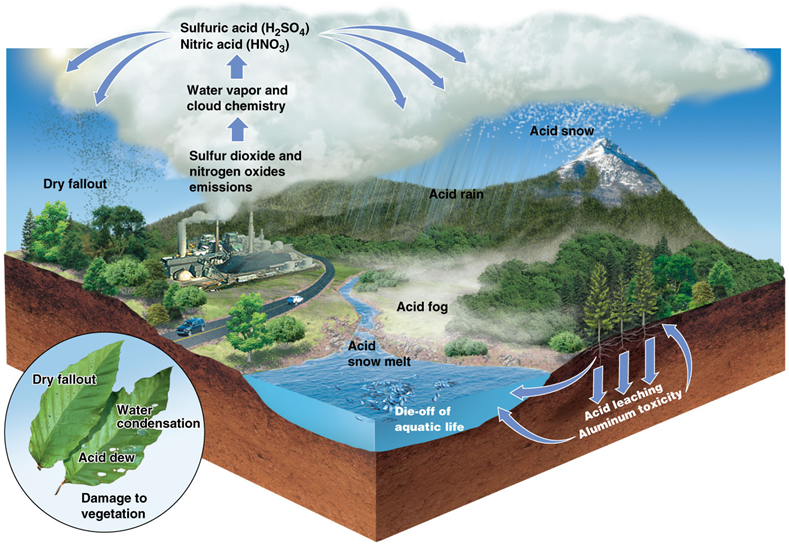
Sulfuric/nitric acid
•Products of sulfur dioxide and nitrogen oxides reacting with atmospheric moisture and oxidants (e.g., hydroxyl)
•The acids in acid rain (acid deposition)
Acid precipitation
any precipitation (rain, fog, mist, snow) more acidic than usual (pH < 5.5)
Acid deposition
acid precipitation plus dry-particle fallout
•Affects broad areas of North America, Europe and other industrialized nations
•Precipitation is 10–1,000 times more acidic than usual
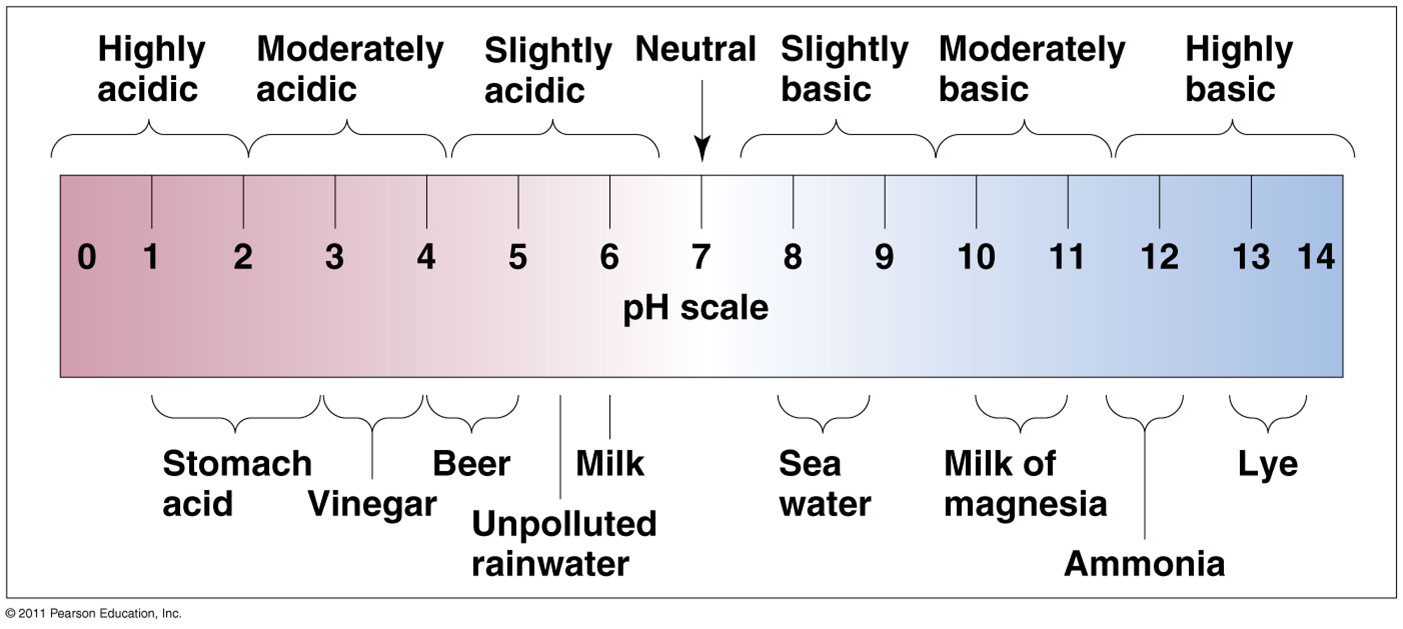
pH scale
pH = -log (H+)
pH = 7 (neutral), when H+ = 10-7; pH = 2, when H+ = 10-2;
Each unit on the scale represents a 10-fold difference in hydrogen concentration.
•Rainfall is normally slightly acidic (pH = 5.6)
Acid precipitation
any precipitation with a pH < 5.5
•Acid precipitation is now the norm over most of the industrialized world
•Eastern North America: rain and snow pH = 4.0
•Polluted air from the Midwest and industrial Canada
•Can be as low as pH = 3.0
•Mountain forests east of Los Angeles have a
pH = 2.8
•1,000 times more acidic than usual
Natural sources of acid deposition
•Sulfuric acid (H2SO4) and nitric acid (HNO3)
•Occurs in a ratio of 2 to 1
•But west U.S. and Canada have more nitric acid
•Burning fuels are oxidized by hydroxyl radicals in the troposphere
•Forming sulfuric and nitric acid
•Natural sources of sulfur dioxide: 50–70 million tons/year (volcanoes, sea spray, microbial processes)
•Natural sources of nitrogen oxides: 30–40 million tons/year (lightning, biomass burning, microbial processes)
Human sources of acid deposition
•Sulfur dioxide: 100–130 million tons/year
•U.S. sources: fuel (coal) combustion
•Nitrogen oxides: 60–70 million tons/year
•Most from transportation
•Anthropogenic sources: concentrated in industrialized areas
•Emissions have increased 6 times since 1900
•Old U.S. coal-burning power plants are reducing emissions
•Deposition has decreased 33–35% in the past 15 years
•Fossil-fuel-burning electric utility plants still emit SO2 and NOx
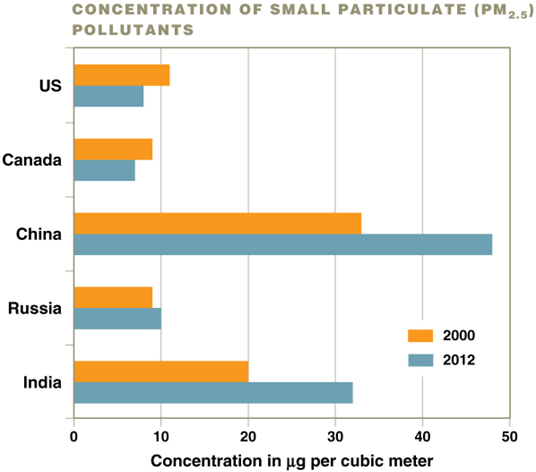
PM pollution changes
Air quality is improving in some countries and worsening in others—particulates present a real danger to human health
Acute exposure
Life threatening exposure
Chronic exposure
long-term exposure that causes gradual deterioration and premature mortality
Carcinogenic pollutants
Contribute to lung cancer
Sulfur dioxide
•impairs lung function and leads to bronchitis (inflammation of the bronchi)
Ozone
leads to inflammation and scarring of the lungs
Carbon monoxide
•reduces the oxygen-carrying capacity of the blood and leads to heart disease
Nitrogen oxide NOx
impair lung function and affect the immune system
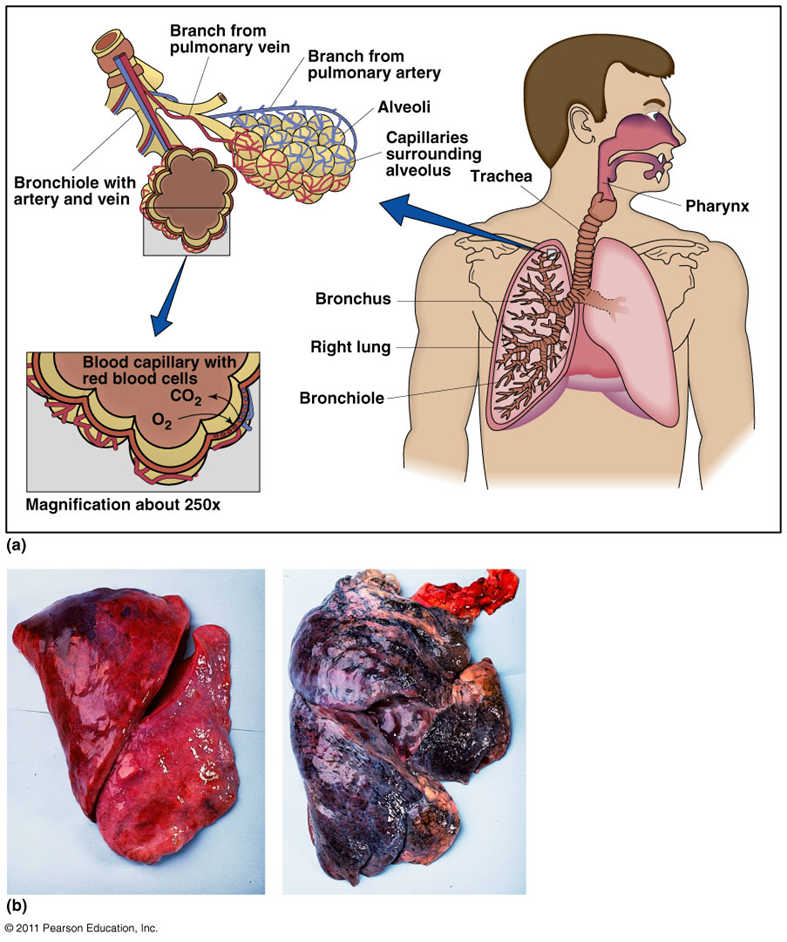
Particulate matter PM
respiratory and cardiovascular pathologies
Chronic obstructive pulmonary disease (COPD)
•A slowly progressive lung disease that makes it hard to breathe
•The 4th leading cause of death: affects 18 million in the U.S.
•Affects 10% of adults over 40 worldwide
•From smoking and burning wood or dung for fuel
•Involves three diseases: emphysema (destruction of the lung alveoli), bronchitis, and asthma
Asthma
an immune disorder
•Impaired breathing caused by constricted airways
•Is triggered by allergens (dust, mites, mold, pet dander)
•Is also triggered by pollution (ozone, particulates, SO2)
•Causes 500,000 hospitalizations/year
•1.8 million visits to emergency departments
•In the last decade, U.S. asthma has doubled (to 23 million)
Air pollution sensitive groups
small children, asthmatics, those with chronic pulmonary or heart disease, the elderly
Impacts of PM
•Studies of thousands of adults show strong evidence of harm caused by fine particulates and sulfur pollution
•Asthma, chronic bronchitis, cardiovascular problems, etc.
•Higher concentrations of fine particles correlate with increased mortality from cardiopulmonary disease and lung cancer
•The EPA used these studies to regulate fine particles
•Fine particles and ozone exceeded California standards
•Meeting standards would save $28 billion/year in avoided health costs, missed work, premature deaths, etc.
Impacts of lead
•Lead poisoning causes mental retardation in children under 5 yr or exposed in utero
•In the 1980s, elevated levels were present in adults and children
•Children: learning disabilities
•Adults: high blood pressure
•The major source of lead: leaded gasoline
•Inhaled, settled on food or other items put in the mouth
•The EPA mandated elimination of leaded gasoline by 1996
•Dramatically reduced lead in the environment
Impacts of mercury
•Power plants & coal are a major source of mercury
•Inorganic mercury salts (e.g. HgCl2) cause renal damage
•Is converted to methylmercury (CH3)2Hg & CH3Hg+ in aquatic systems
•A highly toxic form that bioaccumulates in fish
•Note the recommended daily/weekly intake of selective fish species!
•49% of game fish in lakes and rivers exceed limits
•Methylmercury is a neurotoxicant, causing neurological disorders
•This toxic element binds to key cellular enzymes
•Impairs brain development in fetuses and small children
Impacts of air pollution on humans
•can kill people already suffering from heart or respiratory diseases (COPD, asthma, etc.)
•Lethal doses also occur in accidental poisoning
•Moderate air pollution can change cardiac rhythms
in people with heart disease
•Triggering fatal heart attacks
Diesel exhaust
carcinogen
Benzene
•a leukemogen & lymphomogen
•In motor fuels (2-5%), solvents, explosives, smoke
•Linked to leukemia, Non-Hodgkin lymphomas, blood disorders (Aplastic Anemia), damaged immunity
Impacts of air pollution on the environment
•Plants are more sensitive than humans to air pollution
•Sulfur dioxide from smelters and power plants killed large areas of vegetation
•Ozone damages crops, orchards, and forests
•Ozone enters plants through stomata (pores)
•Symptoms of damage: black flecks, yellow leaves
•Crops vary in their susceptibility to ozone
•Soybeans, corn, wheat are damaged at elevated ambient ozone levels
•Countries lose billions of dollars/year in lower yields
Impact of ozone on forests
•Ponderosa and Jeffrey pines in California were damaged by ozone from the San Francisco-Oakland area
•Trees weakened by ozone were susceptible to pine beetles
•Tree damage starts at 40 ppb ozone
•Intensifies with higher levels
•California and the Appalachians exceed 60 ppb
•Resulting in 30%–50% less stem growth
•Ozone stress disrupts carbon and nutrient metabolism.
•PANs and PBNs likely play a role as well.
Impact of pollution on material
•Particulates turn walls, windows, and surfaces dingy
•Oxidation by ozone: deteriorates rubber
•Sulfur dioxide and sulfur or nitrogen oxides corrode metal
•Weather and deteriorate stonework
•It costs hundreds of millions of dollars/year to clean or replace damaged materials
•Historic statues and carvings are irreplaceable

Impact of pollution on visibility
•Traffic and congestion cause the pollution we are trying to avoid
•National parks and wilderness areas suffer pollution
•Visibility is impaired by “regional haze”
EPA Regional haze rule 1999
aims to improve visibility and reduce emissions in parks and wilderness
Impact of acid deposition
•Acid deposition’s impacts on ecosystems were noted more than 45 years ago
•Impact on aquatic ecosystems: an environment’s pH affects enzymes, hormones, and other proteins
•A low pH overwhelms regulatory mechanisms, killing or weakening the organism. Organisms can regulate their internal pH within limits
•Ponds, lakes, and streams have a natural pH of 6–8
•Eggs, sperm, and developing young are very sensitive to small changes in pH
•A pH below 5 kills organisms or impairs their reproduction
•Acid precipitation can leach heavy metals from soil, which are absorbed by organisms and are highly toxic
•Mercury accumulates in fish in acidic lakes
•Ontario, Canada lost fish in 1,200 lakes
•346 lakes in the Adirondacks in New York lost fish
•The clear, blue lakes look healthy but contain only acid-loving moss growing on the bottom
Buffer substance
a substance that absorbs hydrogen ions
•Maintains the pH at a relatively constant value
•Acid neutralizing capacity (ANC): a system that is protected from changes in its pH
limestone
granitic rock
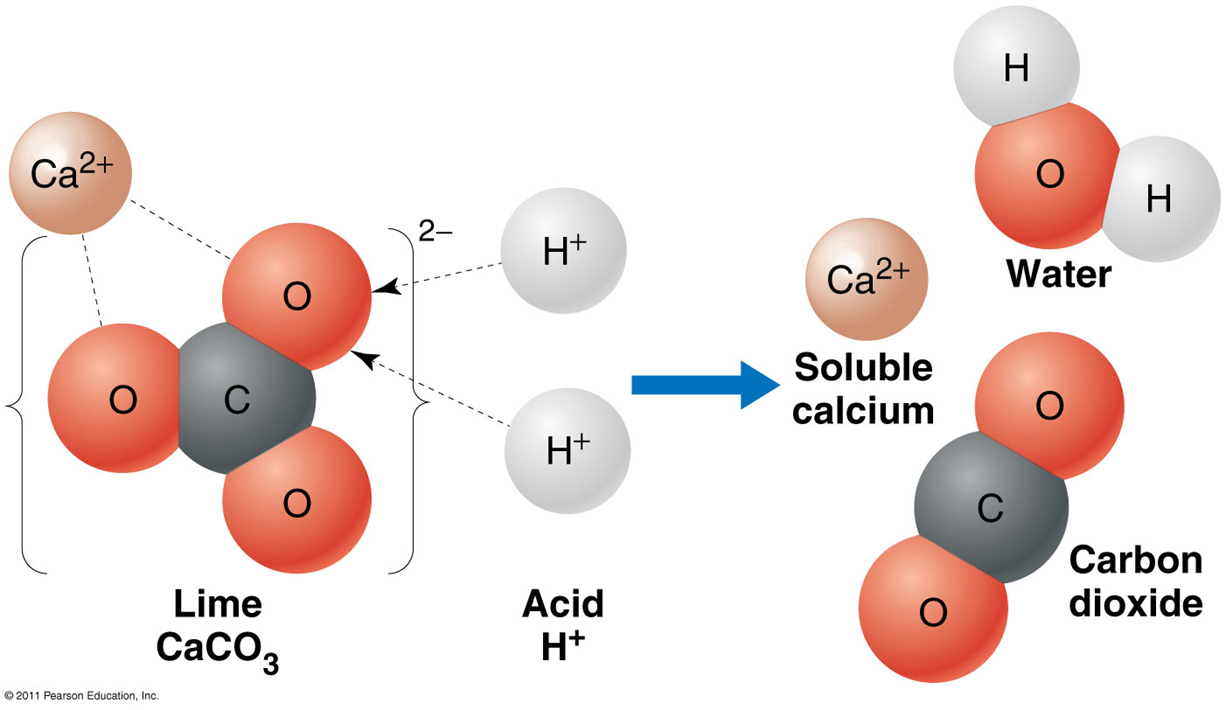
Limestone (CaCO_3)
obtained from soil
•A natural buffer protecting many lakes
Impact of Clean Air Act
reduced SO2 and NOx emissions
•Decreased acid precipitation leads to fewer acidic lakes
Impact of acid deposition on forests
•Forests from Vermont to California died off during the 1980s
•1.3 million acres in New England died
•Trees lose needles and become more susceptible to frost
•Sugar maples suffer 20%–80% losses
•Acid precipitation adds sulfur and nitrogen to soil
•Which normally would stimulate tree growth, but due to:
•But leaching out calcium and magnesium (buffers)
•Toxic aluminum oxides are also leached from the soil
•Results in reduced tree growth.
•Liming the soil restores tree health
Impact of acid deposition on material
•Limestone and marble are used on buildings and monuments (artifacts)
•Acid deposition rapidly erodes these structures
•Hundred- or thousand-year-old structures are crumbling
•It costs billions of dollars/year to replace or repair structures
•Destruction of buildings also reminds us of how we are decreasing the buffering capacities of ecosystems
•Acid deposits cross national and political boundaries
Chlorofluorocarbons CFC
•destroy the ozone layer
•halogenated hydrocarbons
•Nonreactive, nonflammable, nontoxic organic molecules
•Chlorine and fluorine atoms in place of hydrogen atoms
•Normally gaseous, but liquefy under some pressure
•Used in refrigerators, air conditioners, heat pumps
•Production of plastic foams
•Cleaning computer parts
Pressuring agent in aerosol cans
Light energy
•Sunlight has particle nature and wave nature (the duality of light). Sunlight is comprised of light of many different wavelengths.
•You can see this effect with a light prism or in a rainbow before or after a rainstorm.
•Light is refracted differently because of its wave nature.
•Shorter wavelengths of light have higher energy.
Electromagnetic spectrum
The wave nature of light is represented by the electromagnetic spectrum and is characterized by its frequency (number of waves/second) and wavelength (“λ” - distance between wave crests).
•In chemical reactions, light behaves as particles (the particle nature of light) called Photons whose energy is inversely proportional to wavelength.
•The shorter the wavelength, the higher the energy.
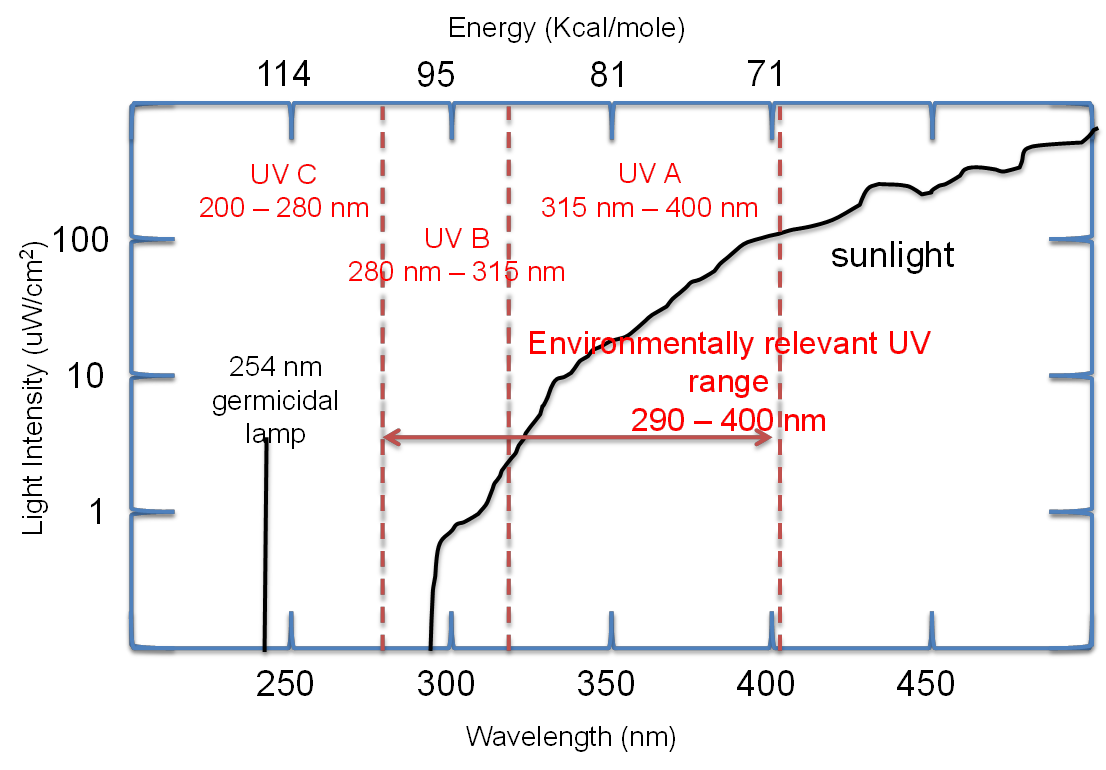
Wavelength
Distance between 2 wave crests
Only light with wavelengths greater than 290 nm (Energy of about 95 kcal/mol) reaches the surface of the earth. Lower wavelengths of light (more energetic) are filtered out by the ozone layer.
Ozone shield
•stratospheric ozone that absorbs most (99%) UV radiation
•The 1% UVB radiation causes skin cancer, cataracts, skin aging, and damages crops and other life forms
Ozone formation
formed in the stratosphere:
•UV radiation splits O2 molecules into free oxygen (O)
O2 + UVB → O + O
•Some O combines with O2 to form ozone (O3)
O + O2 → O3
Rowland and Molina nobel prize
•Concluded that CFCs could damage stratospheric ozone through the release of chlorine atoms
•Increased UV radiation would cause more skin cancer
•Strong UV (<240 nm) radiation breaks CFCs apart
CFCl3 + UV → Cl + CFCl2
•Chlorine atoms (Cl) attack ozone, forming chlorine monoxide (ClO) and molecular oxygen (O2)
Cl + O3 → ClO + O2
•Two molecules of ClO react and release more Cl and O2
ClO + ClO → 2 Cl + O2
Ozone hole
a “thinner” layer of ozone.
•Halocarbons and chlorofluorocarbons in particular can deplete ozone catalytically.
•They add destruction pathways for both oxygen atoms and ozone.
•They reduce the steady state concentration of ozone.
Chlorine catalytic cycle
•chlorine is regenerated
•Chlorine acts as a catalyst—promoting a chemical reaction without being used up
•Every chlorine molecule lasts 40–100 years in the air
•It can break down 100,000 O3 molecules
Bromine (methyl bromide)
•a soil fumigant and pesticide, depletes ozone
It is 16 times as potent as Cl
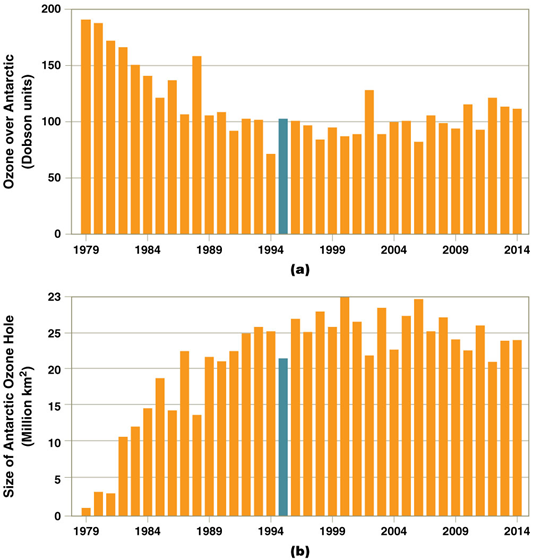
Antarctic ozone hole
•In 1985, scientists noticed a hole (serious thinning) in the stratospheric ozone layer over the South Pole
•Ozone levels were 50% lower than normal
•In summer: gases (NO2, methane) trap Cl, preventing ozone depletion
•The Antarctic winter (in June) creates a vortex that traps stratospheric gases
•Extremely cold temperatures create stratospheric clouds
•Cloud surfaces allow chemical reactions to release Cl2
•Spring sunlight breaks up the stratospheric clouds
•UV light attacks molecular chlorine
•Initiating the chlorine cycle, which destroys ozone
•Summer (November) breaks up the vortex
•Ozone-rich air returns to the are
•Ozone-poor air has spread over the Southern Hemisphere
•Queensland, Australia: two out of three are expected to develop skin cancer
•The ozone hole is now the size of North America
•The Arctic does have 25% depletion, but no ozone hole
Ozone depletion
•Worldwide ozone losses of 3.5%–6% from 2006 to 2009
•Ozone losses of the 1980s will have caused 12 million people in the U.S. to develop skin cancer
•More UVB radiation than ever reached Earth
•But long-lived ODS (ozone depleting substances) will continue to deplete ozone
Montreal protocol
•194 nations agreed to scale back CFC production 50% by 2000
•Amendments moved the date for phaseout to 1996
•All manufacturing of CFCs was to stop by 2005
Air pollution control act 1955
the first federal legislation involving air pollution
Clean Air act 1970
•calls for identifying widespread pollutants
•Sets ambient standards for five criteria pollutants
•Establishes control methods to meet the standards
•Amended in 1977 and 1990
•Is administered by the EPA
•The foundation of U.S. air-pollution control efforts
•Ambient standards: levels protecting human health and the environment
National Ambient Air Quality Standards (NAAQS)
•set primary standards for criteria pollutants (PM10/PM2.5, SO2, CO, NOx, ozone, lead)
•The highest levels that should not cause harm
•Set long- and short-term levels to protect against adverse health effects
The EPA lowered ozone and lead standards in 2008
•The EPA is required to review pollutants every 5 years
•Then make adjustments based on science
•The NAAQS has far-reaching impacts on regulations
•Proposed changes always generate controversies
National Emission Standards for Hazardous Air Pollutants (NESHAPs)
•Established under the CAA’s 1980 amendments
•The EPA must track and regulate 187 toxic pollutants
National emission inventory
database of criteria and hazardous air pollutants the EPA uses to regulate pollutants
Command and control approach
•regulations requiring industry to achieve a set limit on each pollutant using specific control equipment
•The basic strategy of the CAA to keep criteria pollutant emissions below primary standard levels
•Assumes improved health through lower pollution
•A region in violation of the standards has to come back into compliance
•It is hard to implement this strategy: states and cities are unable or unwilling to enforce control
Clean Air Act ammendments (CAAA) 1990
•targeted specific pollutants more directly
•Enforced aggressive compliance through sanctions
State implementation plan (SIP)
•states must still carry out the mandates of the 1990 Act
•Requires public comment before submitting to the EPA
•Designed to reduce emissions of every NAAQS pollutant whose control standard has not been reached
•, polluters must apply for a permit identifying the type, level, and reduction steps for a pollutant
•Permit fees fund state air pollution control strategies
•The SIP is more flexible than command and control
•Polluters can choose the most cost-effective strategy
•The market system allocates pollution among utilities
Attainment plans
•submitted by areas of the U.S. that have not reached the required pollution levels through reasonably available control technology (RACT)
•Offending regions must reach standards in a set time frame
PM Standards
•The EPA added new ambient air quality standards for particulates (PM2.5) in 1997
•Particulates smaller than 2.5 micrometers (microns) are the most dangerous to the lungs
•Larger particulates impact the bronchus and upper airway
•In February 2009, a federal appeals court ruled the standards were inadequate and contrary to scientific data
•24-hour primary standards were lowered in 2012
•Saving $9–$75 billion/year in health benefits
But the annual standard was not lowered
Maximum achievable control technology (MACT)
developed by the EPA
•Substitution by nontoxics gives industry flexibility in meeting goals
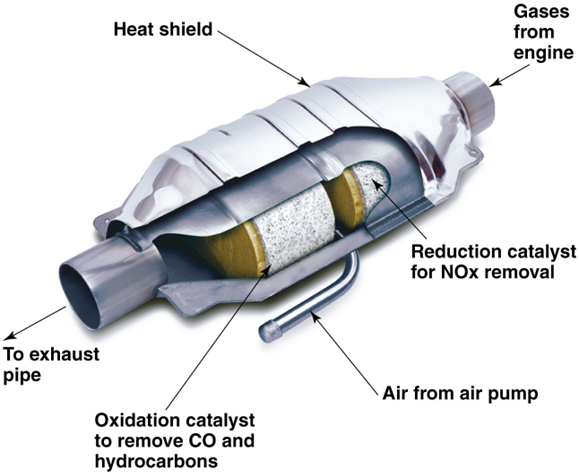
Catalytic converter
Catalysts in the converter promote chemical reactions that change pollutants to less harmful gases
CAAA changes
•Failure to meet air quality standards required that
•New cars emit less VOCs and NOx
•Buses and trucks had to meet more stringent standards
•The EPA could control all non-road engines (boats, etc.)
•Regions with high CO had to add oxygen to gasoline
•More vehicle inspection stations have to be able to measure emissions
•Fuel efficiency and consumption are negatively impacted by higher speed limits and larger, less efficient vehicles
Energy policy and conservation act 1975
the National Highway Traffic Safety Administration sets CAFE standards for motor vehicles
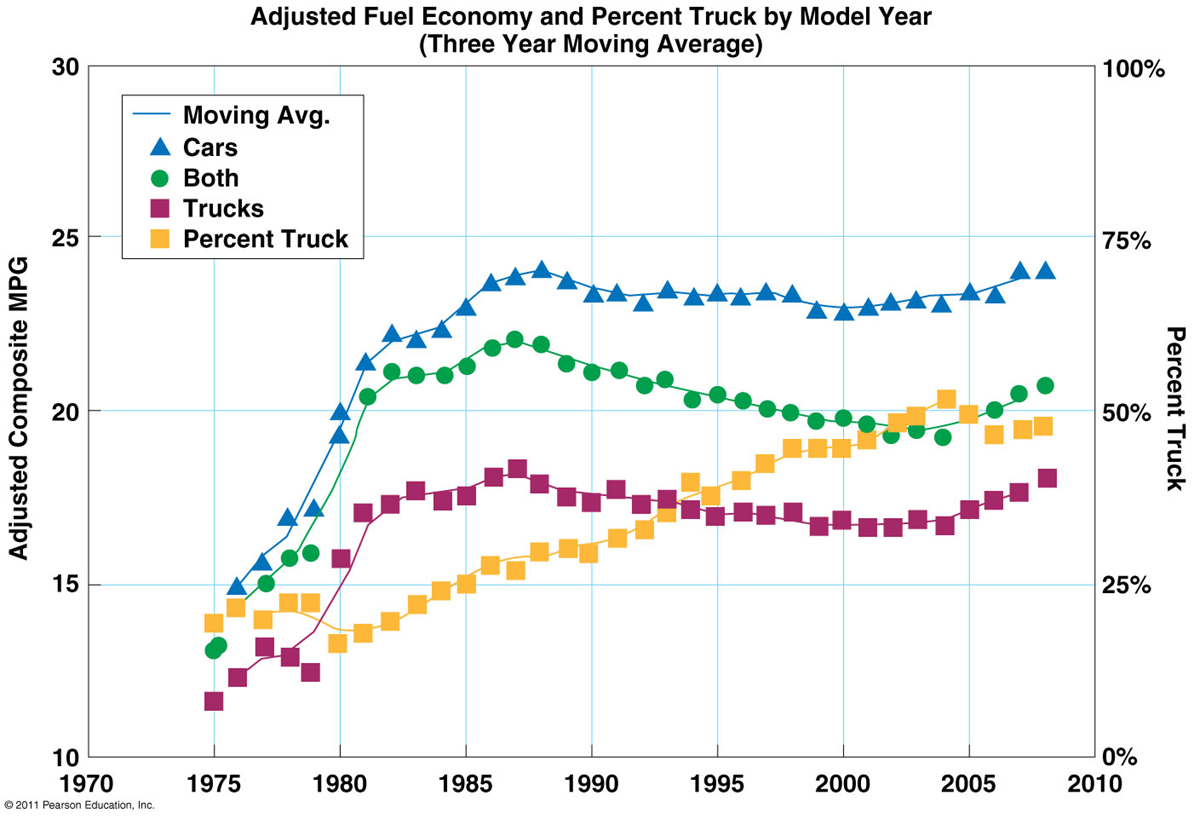
Corporate Average Fuel Economy (CAFE)
•Saves oil, helps energy security, decreases air pollution
•2009 CAFE standards increased fuel efficiencies
54.5 mpg and 163 g/mile CO2 emissions by 2025
Energy independence and security act 2007
•Raises all vehicle standards to 35 mpg by 2020
Hybrid electrical vehicles
have a gasoline motor and a battery-powered electric motor (Toyota Prius averages 46 mpg)
Goals to manage ozone
•address the VOCs and NOx that form it
•Reducing emissions of VOCs from motor vehicles, point sources (industries), and area sources (dry cleaners, print shops, household products)
•Since the CAAA, emissions have declined 24%
•The 1997 revised ozone standard was strongly opposed by industry, but the Supreme Court upheld the EPA
•Implementation was delayed until 2004
•Health benefits far outweighed compliance costs
Tier 2 standards for NOx
•emissions from all SUVs, trucks, passenger vans are held to the same standard as cars
•They are not being met due to older, polluting cars
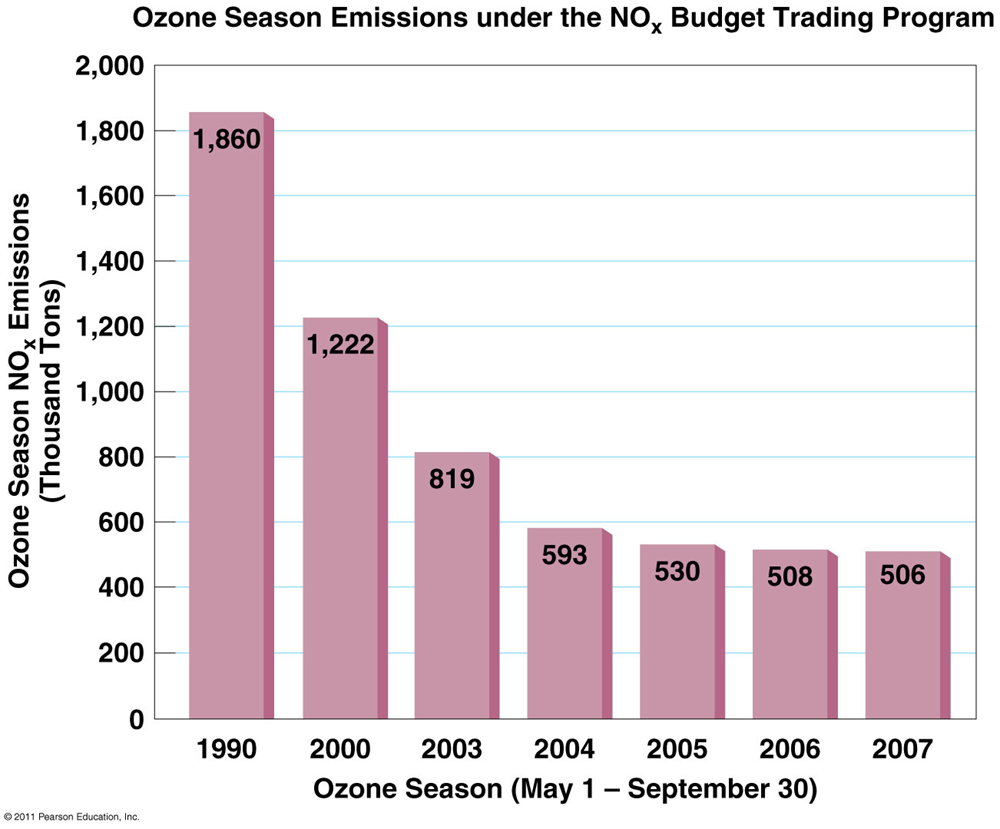
NOx budget training program NBP
the EPA establishes a market-based “cap and trade” system
•By 2012, SO2 was reduced by 68% and NOX by 53%
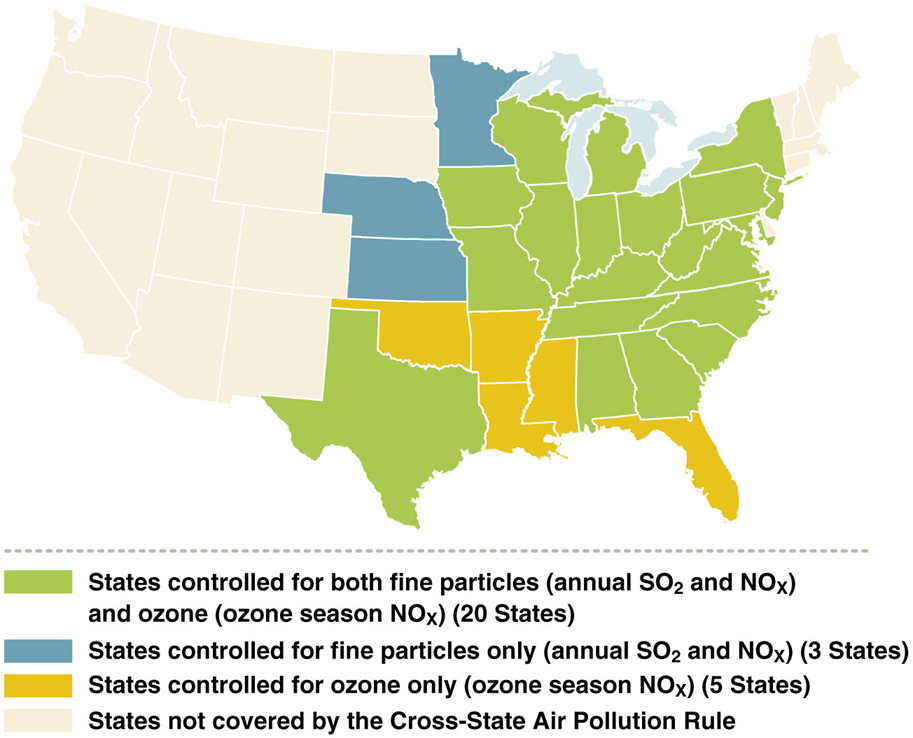
Cross state air pollution rule 2011
•Replaced CAIR (Clean Air Interstate Rule that set lower caps on SO2 and NOx in 28 states)
•Adds several Midwest states
•Requires reduced NOx and SO2 from power plants
•Improved how upwind states must protect downwind states
•It was challenged in 2012, but the Supreme Court upheld it
•In 2015, the EPA rolled out a new schedule for power plant compliance