PSY295 Final Exam
1/72
Earn XP
Description and Tags
Name | Mastery | Learn | Test | Matching | Spaced |
|---|
No study sessions yet.
73 Terms
A researcher uses an anonymous survey to investigate the study habits of American college students. A group of American college students is administered the survey. This is an example of a ____
sample
statistic
population
parameter
Sample
A characteristic, usually a numerical value, that describes a population is called a _____
Parameter
statistic
variable
constant
Parameter
A recent study reports that elementary school students who were given a nutritious breakfast each morning had higher test scores than students who did not receive breakfast. For this study, what is the dependent variable?
the students who were given the nutritious breakfast
the students who were not given the nutritious breakfast
whether or not a breakfast was given to the students
the test scores for the students
the test scores for the students
Using letter grades (A, B, C, D, and F) to classify student performance on an exam is an example of measurement on a(n) ______ scale of measurement
nominal
ordinal
interval
ratio
Ordinal
what additional information is obtained by measuring on an interval scale compared to an ordinal scale?
whether the measurements are the same or different
the direction of the differences
the size of the differences
none of these
The size of the differences
what is the value of (ΣX²) for the following scores? Scores: 3,0,5,2
20
38
100
400
38
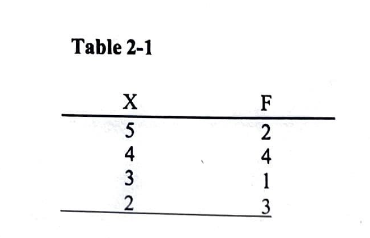
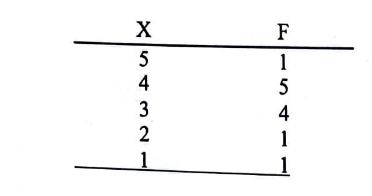
For the frequency distribution in table 2-1, what is the proportion associated with X=3?
0.10
0.20
0.30
0.40
0.10
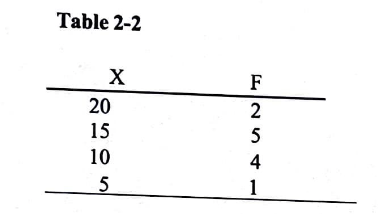
For the distribution in table 2-2. how many people had scores less than X=20?
5
10
12
cannot be determined
10
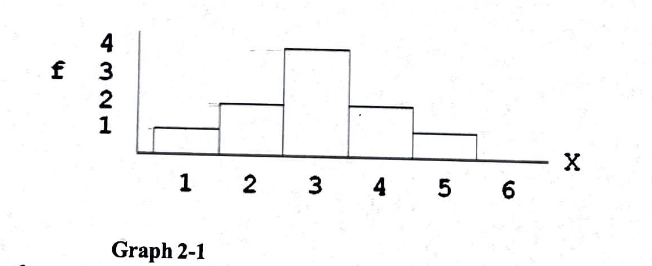
For the distribution in graph 2-1, what is the value of ΣX?
15
21
30
cannot determine
30
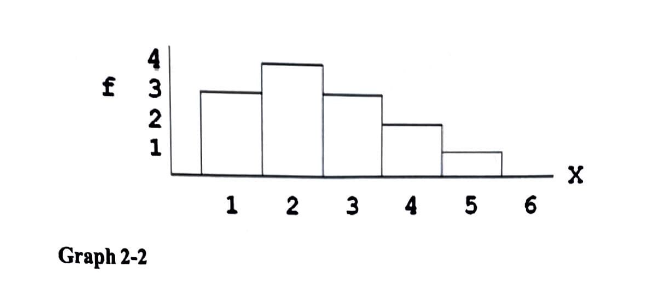
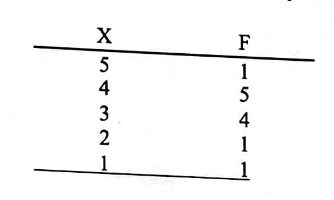
the mode of the distribution graph in 2-2 is?
1
2
4
cannot determine
2
what is the shape of the distribution for the following set of data?
Scores: 1, 2, 2, 2, 2, 3, 3, 4, 5, 60
symmetrical
positively skewed
negatively skewed
rectangular
Positively skewed
what is the mean for the following scores?
Scores: 1, 6, 14
3
6
7
10.5
7
a population with a mean of µ=8 has ΣX=40. How many scores are in the population?
N = 5
N = 320
N = 6
cannot be determined from the information given
N = 5
For the sample shown in the frequency distribution table, the median is:
3
3.5
4
15/2 = 7.5
3.5
for the sample shown in the frequency distribution table, the mode is:
3
3.5
4
5
4
what value is obtained if you add all the deviation scores (X-µ) for population, then divide the sum by N?
the population variance
the population standard deviation
you always will get zero
none of the other choices is correct
you will always get zero
what is the value of SS (sum of squared deviations) for the following population?
population: 1, 1, 1, 5
3
7
12
28
12
the sum of the squared deviation scores is SS = 20 for a population of N = 5 scores. what is the variance for this population?
4
5
80
100
4
a population of scores has µ = 50 and σ = 10. if every score in the population is multiplied by 2, then the new mean and standard deviation would be
µ = 50 and σ = 10
µ = 100 and σ = 10
µ = 50 and σ = 20
µ = 100 and σ = 20
µ = 100 and σ = 20
what are the values for SS and variance for the following sample of n = 4 scores?
sample: 1, 1, 0, 6
SS = 12 and variance = 4
SS = 12 and variance = 3
SS = 22 and variance = 7.33
SS = 22 and variance = 5.5
SS = 22 and variance = 7.33
which of the following symbols identifies the sample variance?
s
s²
σ
σ²
s²
which of the following z-score values represents the location closest to the mean?
Z = +0.50
Z = +1.00
Z = -1.00
Z = -2.00
Z = +0.50
for a population with µ = 80 and σ = 10, what is the z-score corresponding to X = 95?
+0.25
+0.50
+0.75
+1.50
+1.50
for a population with µ = 80 and σ = 10, what is the X value corresponding to z = -0.50?
40
85
75
79.5
75
If an entire population with µ = 60 and σ = 8 is transformed into z-scores, then the distribution of z-scores will have a mean of ____ and a standard deviation of ____
0 and 1
60 and 1
0 and 8
60 and 8
0 and 1
what proportion of a normal distribution is located in the tail less than z = -1.00?
0.8413
0.1587
-0.3413
-0.1587
0.1587
a normal distribution has a mean of µ = 40 with σ = 10. proportion of the scores in this distribution are greater than X = 55?
0.3085
0.6915
0.0668
0.9332
0.0668
probabilities are numbers that describe the likelihood of an event and must always be between
-1 and 1
0 and 100
0 and 1
-100 and 100
0 and 1
what proportion of a normal distribution is located between z = -1.50 and z = +1.50?
0.9332
0.0668
0.4332
0.8664
0.8664
What z-score value separates the top 10% of a normal distribution from the bottom 90%?
z = 1.28
z = 0.25
z = -1.28
z = -0.25
z = 1.28
John drives to work each morning and the trip takes an average of µ = 38 minutes. the distribution of driving times is approximately normal with a standard deviation of σ = 5 minutes. For a randomly selected morning, what is the probability that John’s drive to work will take less than 35 minutes?
0.6554
0.3446
0.7257
0.2743
0.2743
a correlational study is used to examine the relationship between two variable so that you can determine whether it there is a cause-and-effect relationship between two variables
true
false
false
a recent report concluded that participants assigned to a regular exercise program had lower depression scores than participants who were not allowed to exercise regularly. For this study, whether or not people are assigned to the exercise program is the independent variable
true
false
True
the participants in a research study are classified as high, medium, or low in self-esteem. this classification involves measurement on an ordinal scale
true
false
true
a researcher records the sex of each child born in the county hospital during the month of june. this researcher is using a nominal scale of measurement
true
false
True
the dependent variable in an experiment is what the researcher manipulates
true
false
false
changing a score in a distribution will always change the value of the median
true
false
false
Normal distributions are skewed distributions
true
false
false
it is possible for more than 50% of the scores in a distribution to have values greater than the median
true
false
false
it is possible for a distribution to have more than one mode
true
false
true
extreme scores in a distribution are more likely to affect the value of the mean than the value of the median
true
false
true
if an entire population with µ = 100 and σ = 20 is transformed into z-scores, then the distribution of z-scores will have a mean of ___ and a standard deviation of ___
0 and 1
100 and 1
0 and 20
100 and 20
0 and 1
a sample of n = 9 scores has SS = 200. what is the variance for this sample?
25
5/3
25/9
5
25
what term is used to refer to the mean of the distribution of sample means?
the expected value of M
the standard error of M
the sample mean
the central limit mean
the expected value of M
what term is used to refer to the standard deviation of the distribution of sample means?
the expected value of M
the standard error of M
the sample mean
the central limit mean
the standard error of M
on average, what value is expected (most likely) for the t statistic when the null hypothesis is true?
0
1
1.96
t > 1.96
0
what is measured by the estimated standard error, Sm?
how spread out the scores are in the sample
how spread out the scores are in the population
the average difference between a score and the sample mean
the average difference between a sample mean and the population mean
the average difference between a sample mean and the population mean
A sample of n = 25 scores is selected from a population with µ = 100 with σ = 20. On average, how much error would be expected between the sample mean and the population mean?
25 points
20 points
4 points
0.8 points
4 points
what happens to the standard error of M as sample size increases?
it increases
it decreases
it stays constant
it is impossible to know without more information
it decreases
which combination of factors will produce the smallest value for the standard error?
a large sample and a large standard deviation
a small sample and a large standard deviation
a large sample and a small standard deviation
a small sample and a small standard deviation
a large sample and a small standard deviation
a sample of n = 9 scores is obtained from a population with µ = 70 and σ = 18. if the sample mean is M = 76, then what is the z-score for the sample mean in the distribution of sample means?
z = 0.33
z = 0.50
z = 1.00
z = 3.00
z = 1.00
A random sample of n = 4 scores is obtained from a normal population with µ = 20 and σ = 4. what is the probability that the sample mean will be greater than M = 22?
0.50
1.00
0.1587
0.3085
0.1587
a random sample of n = 16 scores is obtained from a normal population with µ = 40 and σ = 8. what is the probability that the sample mean will be within 2 points of the population mean?
0.3830
0.6826
0.8664
0.9544
0.6826
a sample is obtained from a population with µ = 100 and σ = 20. which of the following samples would produce the most extreme (largest) z-score for the sample mean?
a sample of n = 25 scores with M = 102
a sample of n = 100 scores with M = 102
a sample of n = 25 scores with M = 104
a sample of n = 100 scores with M = 104
a sample of n = 100 scores with M = 104
which of the following accurately describes a hypothesis test?
a descriptive technique that allows researchers to describe a sample
a descriptive technique that allows researchers to describe a population
an inferential technique that uses the data from a sample to draw inferences about a population
an inferential technique that uses information about a population to make predictions about a sample
an inferential technique that uses the data from a sample to draw inferences about a population
what is a type 1 error?
concluding that a treatment has an effect when it really does
concluding that a treatment has no effect when it really has no effect
concluding that a treatment has no effect when it really does
concluding that a treatment has an effect when it really has no effect
concluding that a treatment has an effect when it really has no effect
what is a type II error?
concluding that a treatment has an effect when it really does
concluding that a treatment has no effect when it really has no effect
concluding that a treatment has no effect when it really does
concluding that a treatment has an effect when it really has no effect
concluding that a treatment has no effect when it really does
which alpha level provides the greatest risk of committing a type 1 error?
a = .01
a = .025
a = .05
a = .10
a = .10
a researcher reports t(21) = 5.30, p < 0.01 for a related-samples (repeated measures) t-test. how many individuals participated in the entire experiment?
20
21
22
none of the above
22
a sample size, n, increases __
the value of df also increases
the t distribution becomes more like a normal distribution
the critical values of t get smaller
all of the above options are true as sample size increases
all of the above options are true as sample size increases
A sample of n = 4 scores has SS = 48. what is the estimated standard error for the sample mean?
2
4
8
16
2
which set of sample characteristics is most likely to result in the rejection of the null hypothesis?
a large sample size and a small sample variance
a large sample size and a large sample variance
a small sample size and a small sample variance
a small sample size and a large sample variance
a large sample size and a small sample variance
which combination of factors produces the smallest risk of a type II error?
a = .01, a large sample size and a small sample variance
a = .01, a small sample size and a large sample variance
a = .05, a large sample size and a large sample variance
a = .05, a large sample size and a small sample variance
a = .05, a large sample size and a small sample variance
with a = .05, what are the critical t values for a two-tailed single sample t test with n = 25?
t = ± 1.711
t = ± 2.064
t = ± 2.708
t = ± 2.060
t = ± 2.064
A sample of n = 25 scores produces a t statistic of t = -2.062. if the research is using a two-tailed test,
the researcher can reject the null hypothesis with a = .05 but not with a = .01
the researcher can reject the null hypothesis with either a = .05 or a = .01
the researcher must fail to reject (retain) the null hypothesis with both a = .05 and a = .01
it is impossible to make a decision about H0 without more information
the researcher must fail to reject (retain) the null hypothesis with both a = .05 and a = .01
a sample is selected from a population with µ = 60 and a treatment is administered to the sample. after treatment, the sample mean is M = 66 with a sample variance of s² = 100. based on this information, the size of the treatment effect, as measured by Cohen’s d is __
d = 0.06
d = 0.60
d = 0.66
Cohen’s d cannot be computed without knowing the sample size
d = 0.60
in a single sample t-test, what must be true if t = 0?
the statistical conclusion is to reject the null hypothesis
the statistical conclusion is to fail to reject (retain) the null hypothesis
the sample standard deviation is equal to the population standard deviation
the estimated standard error is zero
the statistical conclusion is to fail to reject (retain) the null hypothesis
which of the following accurately describes a design that would use an independent samples t-test?
there are two groups of participants for the two treatment conditions being compared
there is one group of participants in all of the treatment conditions being compared
there is one group of participants to evaluate a hypothesis about one population mean
none of the other alternative is correct
there are two groups of participants for the two treatment conditions being compared
which of the following is the correct null hypothesis for an independent-samples t test?
H0: µ1-µ2 = 0
H0: M1-M2 = 0
H0: µ1-µ2 ≠ 0
H0: M1-M2 ≠ 0
H0: µ1-µ2 = 0
An independent-measures study comparing two treatment conditions produces a t statistic with df = 18. if the two samples (groups) are the same size, how many participants were in each of the groups?
9
10
19
20
10
for an independent samples t-test, one sample has n = 8 and SS = 21 and a second sample has n = 8 and SS = 35. what is the pooled variance for the two samples?
28
56
56/16
56/14
56/14
the data from an independent-measures research study produce a sample mean difference of 4 points and a pooled variance of 16. if there are n = 8 scores in each sample, then what is the estimated standard error for the sample mean difference?
2
4
16
128
2
in hypothesis testing, what is measured by Cohen’s d or r²?
the risk of a Type 1 error
the risk of a Type II error
the size of the effect
whether the difference between the two treatments is likely to have occurred by chance
the size of the effect