Second Class - Frequency Distribution
1/6
There's no tags or description
Looks like no tags are added yet.
Name | Mastery | Learn | Test | Matching | Spaced |
|---|
No study sessions yet.
7 Terms
Relative Frequency is found by….
Dividing frequency with the total.
(Total frequency needs to add up to 1)
Approximate Data Width
is the range divided by the number of classes.
Larges Value - Smallest value / by the number of classes
Cumulative Frequency Distribution
is a table or graph that displays the total number of observations below or above certain values in a dataset. It helps to understand the accumulation of frequencies.
Count occurancesfor each class interval until the last.
You use a Histogram to illustrate…
A Frequency Distribution
Histograms provide useful information about….
The shape of the distribution, can be symmetric, or can be skewed
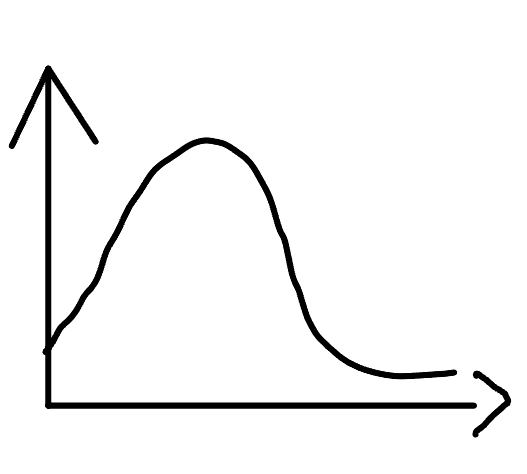
This Image is skewed…
To the right
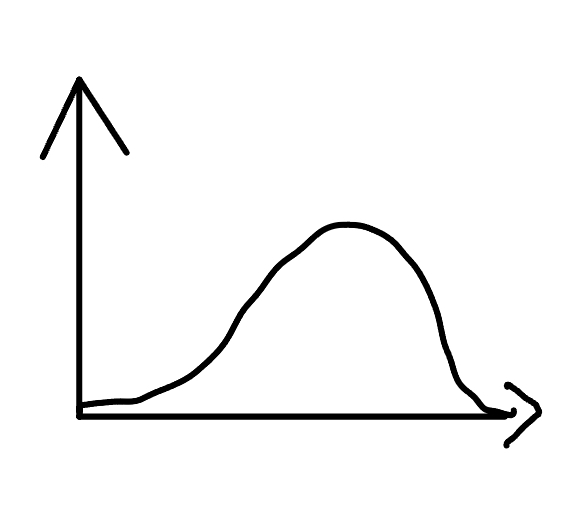
This image is skewed…
To the left