STATS 1123: PROBABILITY AND CHI-SQUARE
1/17
There's no tags or description
Looks like no tags are added yet.
Name | Mastery | Learn | Test | Matching | Spaced | Call with Kai |
|---|
No analytics yet
Send a link to your students to track their progress
18 Terms
univariate data
sinlge quantitative data
stemplot, histogram, boxplot
sample mean, standard deviation/ IQR
categorical variable
pie chart, bar graph
sample proportion
bivariate data
quantitative variables:
scatterplot
sample correlation coefficient
categorical variables:
side-by-side bar graph
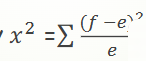
chi-square statistic
chi square analysis
2 categorical variables
how independent the relationship between 2 variables is
x²
two-way table
columns x rows (frequency)
chi-square statistic formula
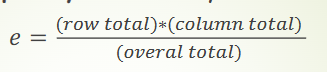
expected frequency formula
*The results of the chi-square analysis will not be accurate when one or
more of the expected frequencies are under five
*assume both variables are independent from eachother
steps to doing chi-square analysis
null hypothesis and alternative hypothesis
the X-variable and the Y-variable are independent to
each other among all subjects in the population.
• Alternative hypothesis: the X-variable and the Y-variable are
not independent to each other among all subjects in the populationx² compared to DP using DF=(r-1)(c-1)
x² > DP → enough statistical evidence to reject null hypothesis and conclude that x and y are not significantly independent to e/o among all subjects in the population
x² < DP → do not have enough statistical evidence to reject null hypothesis and conclude that the two categorical variables are not significantly independent in the population
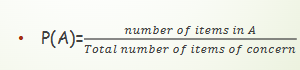
sample space
set of all possible outcomes for a random experiment
event
a subset of the sample space
event a formula
complement
event containing all outcomes not in A
P(A) = 1- P(Ac)
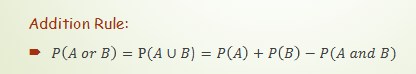
event A or event B
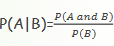
P(A|B) meaning
probability of A given B
P(A|B)=P(A) and vice versa if it’s independent
P(A and B)
P(A) x P(B) when A and B are independent
P(A and B) = 0 → mutually exclusive

mutually exclusive
P(A and B) = 0
P(A) x P(B) = 0
discrete and continuous random variable
discrete: 1,2,3,4,5
continuous: 1-10
expected value for discrete probability
E(X)= sum (x*f(x))
when the experiment of (a scientific experiment) is repeated infinite # of times (long run), the average amount a person would gain/lose
standard deviation for discrete probability
sigma = sqrt(sum((x-u)² x f(x))