Unit 5.1 Population Ecology
0.0(0)
Card Sorting
1/128
Earn XP
Description and Tags
Last updated 7:17 PM on 12/3/22
Name | Mastery | Learn | Test | Matching | Spaced | Call with Kai |
|---|
No analytics yet
Send a link to your students to track their progress
129 Terms
1
New cards
Population Ecology
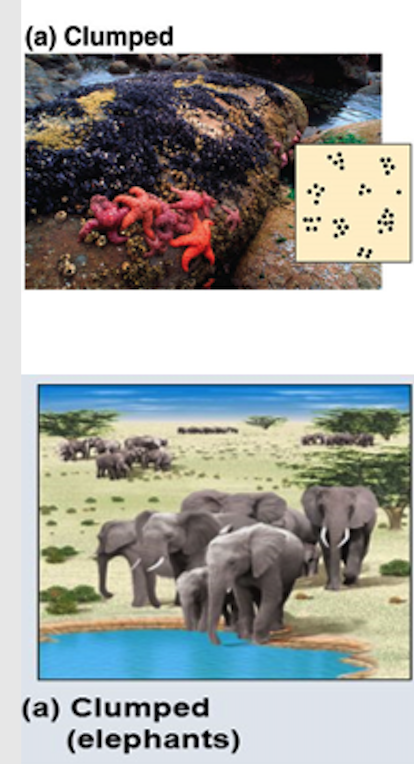
1. Processes influencing density, dispersion, and demographics
- Density & Dispersion
- Demographics
a. Life tables
b. Survivorship curves
c. Reproductive rates
2. Exponential model
- Per capita rate of change
- Exponential population growth
3. Logistical model
- Logistic growth model
- Logistic model & real populations
3. Life history traits
- Diversity of Life Histories
a. When Reproduction Begins
b. Frequency of Reproduction
c. Number of Offspring per Episode
- “Trade-offs” and Life Histories
a. Trade-offs
b. Selection of traits
4. Density-Dependent Factors
- Population Change & Density
- Mechanisms of Density-Dependent
Population Regulation
a. Competition for resources
b. Disease
c. Territoriality
d. Intrinsic factors
e. Toxic wastes
- Population Dynamics
a. Stability & Fluctuation
b. Population Cycles: Scientific Inquiry
c. Immigration, Emigration, and Metapopulations
5. Increase of human population
- The Global Human Population
a. Regional Patterns of Population Change
b. Age Structure
c. Infant Mortality & Life Expectancy
- Global Carrying Capacity
a. Estimates of Carrying Capacity
b. Limits on Human Population
Size
- Density & Dispersion
- Demographics
a. Life tables
b. Survivorship curves
c. Reproductive rates
2. Exponential model
- Per capita rate of change
- Exponential population growth
3. Logistical model
- Logistic growth model
- Logistic model & real populations
3. Life history traits
- Diversity of Life Histories
a. When Reproduction Begins
b. Frequency of Reproduction
c. Number of Offspring per Episode
- “Trade-offs” and Life Histories
a. Trade-offs
b. Selection of traits
4. Density-Dependent Factors
- Population Change & Density
- Mechanisms of Density-Dependent
Population Regulation
a. Competition for resources
b. Disease
c. Territoriality
d. Intrinsic factors
e. Toxic wastes
- Population Dynamics
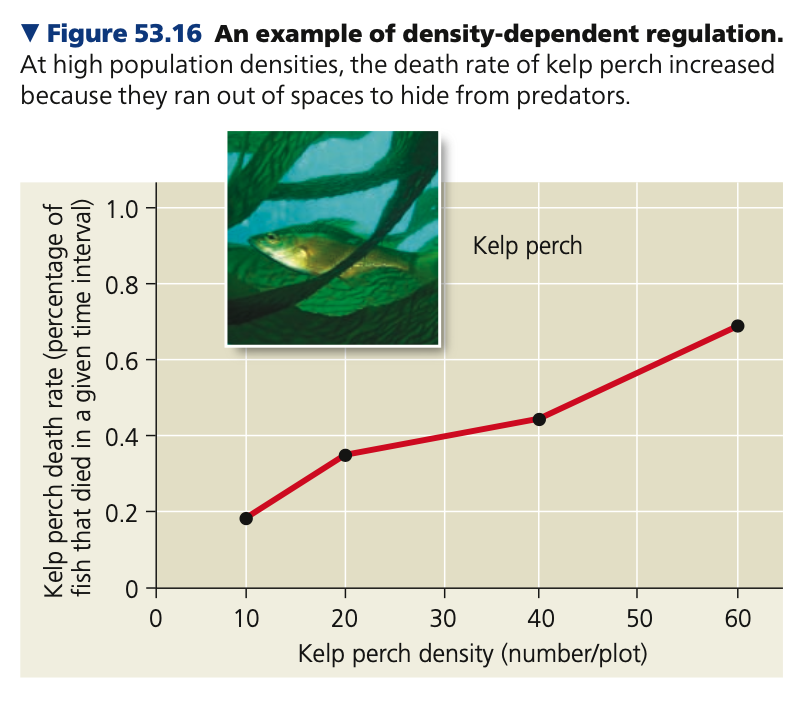
a. Stability & Fluctuation
b. Population Cycles: Scientific Inquiry
c. Immigration, Emigration, and Metapopulations
5. Increase of human population
- The Global Human Population
a. Regional Patterns of Population Change
b. Age Structure
c. Infant Mortality & Life Expectancy
- Global Carrying Capacity
a. Estimates of Carrying Capacity
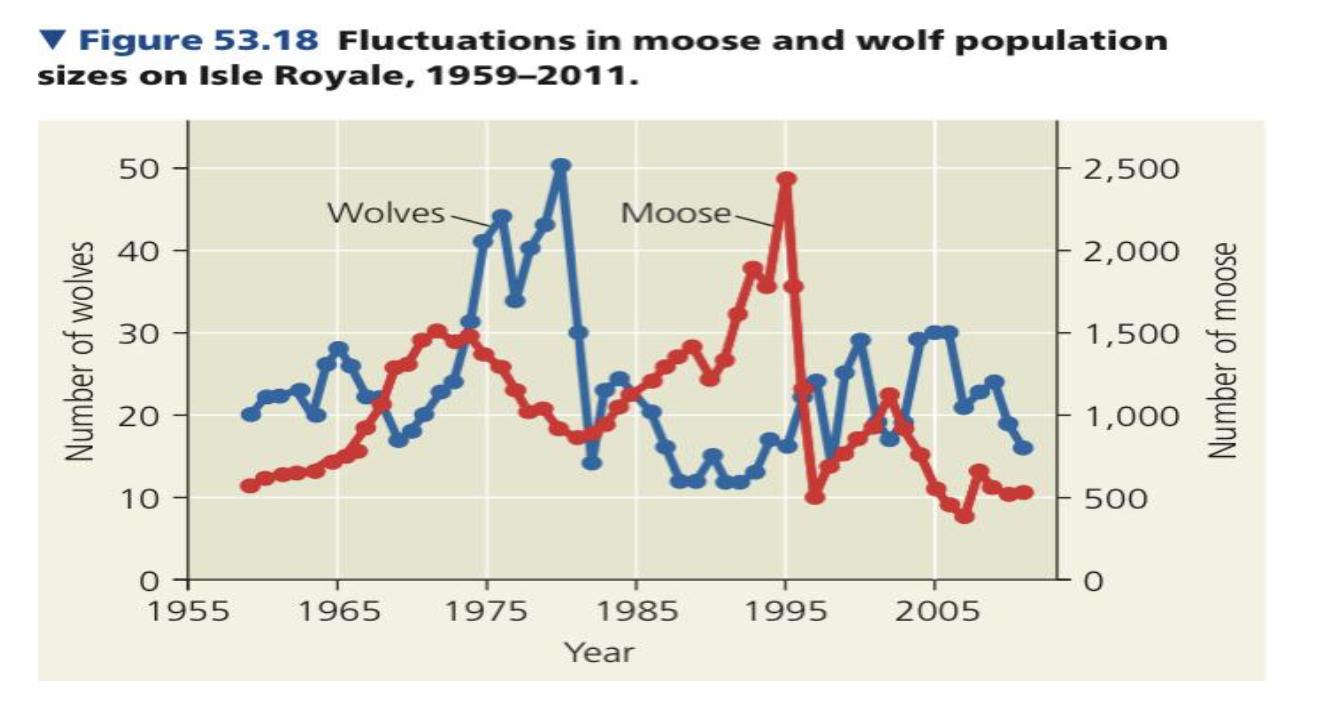
b. Limits on Human Population
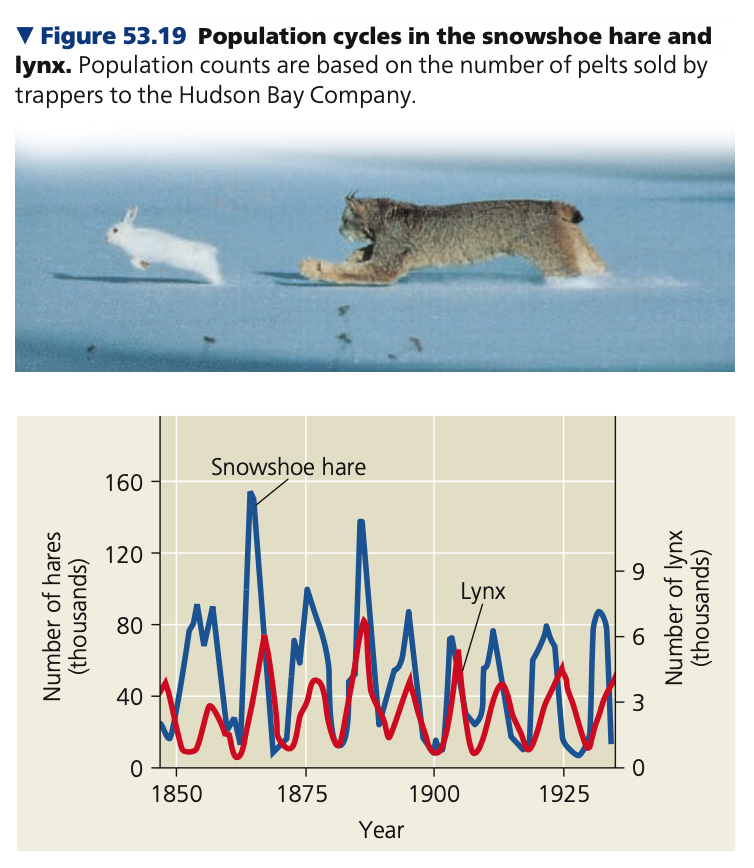
Size
2
New cards
Processes influencing density, dispersion, and demographics
- Density & Dispersion
- Demographics
- Demographics
3
New cards
Abundance
- population size
4
New cards
Density
- number of individuals per unit area or
volume
volume
5
New cards
counting, average, homogeneous, mark, initially, second, total
Density & Dispersion
How is density determined?
1) _______ all individuals within the
boundaries of the population
2) calculating the _______ density in the plots, and then extending the estimate to the population size in the entire area
○ accurate when the habitat is fairly ________
3) ____-recapture method for wildlife
populations
○ marking an initial random sample of individuals in the population then capturing a second set of individuals after a few days or
weeks
○ population size, N = sn/x
where
s = # of individuals _____ marked and released
x = # of marked individuals captured in ______ sampling
n = _____ # of captured individuals in second sampling
6
New cards
static
Density & Dispersion
- Density is not a _____ property but changes as individuals are added to or removed from a population.
- Density is not a _____ property but changes as individuals are added to or removed from a population.
7
New cards
add
Births and immigration ___ individuals to a population.
8
New cards
birth
all forms of reproduction
9
New cards
Immigration
influx of new individuals from other areas
10
New cards
remove
Mortality and emigration ______ individuals from a population.
11
New cards
mortality
death
12
New cards
emigration
movement of individuals out of a population and into other locations
13
New cards
Dispersion
- pattern of spacing among individuals within the boundaries of the population
- spatial relationship bet. members of a population within habitat
- spatial relationship bet. members of a population within habitat
14
New cards
Habit
- growing patterns
15
New cards
Dispersion
1. Clumped
2. Uniform
3. Random
2. Uniform
3. Random
16
New cards
Clumped
individuals are aggregated in patches
e.g. Sea stars group together where food is abundant.
e.g. Sea stars group together where food is abundant.
17
New cards
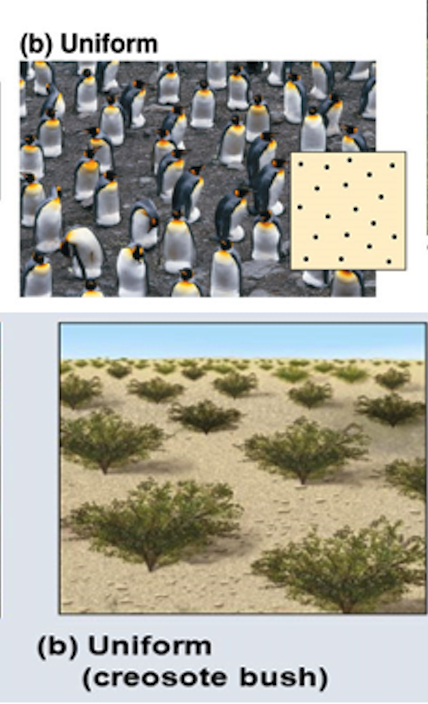
Uniform
evenly spaced
e.g. Nesting king penguins exhibit nearly uniform spacing, maintained by aggressive interactions between neighbors.
e.g. Nesting king penguins exhibit nearly uniform spacing, maintained by aggressive interactions between neighbors.
18
New cards
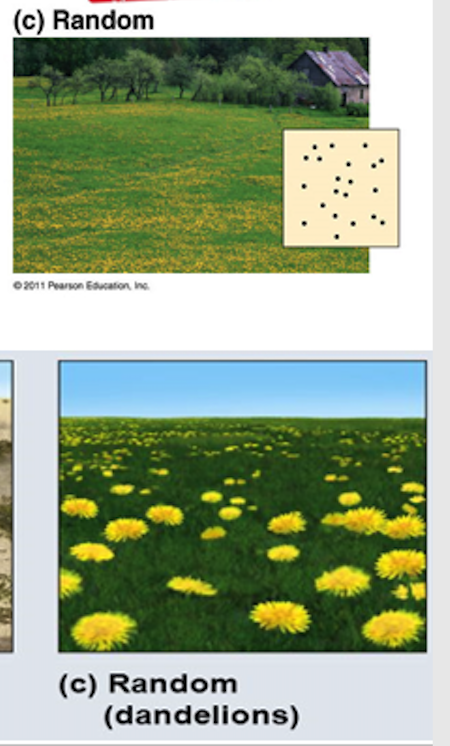
Random
unpredictable spacing
e.g. Dandelions grow from windblown seeds that land at random and later germinate.
e.g. Dandelions grow from windblown seeds that land at random and later germinate.
19
New cards
Demography
study of vital statistics of populations and how they change over time
20
New cards
Demographics
1. Life tables
2. Survivorship curves
3. Reproductive rates
2. Survivorship curves
3. Reproductive rates
21
New cards
rates, age, cohort, females
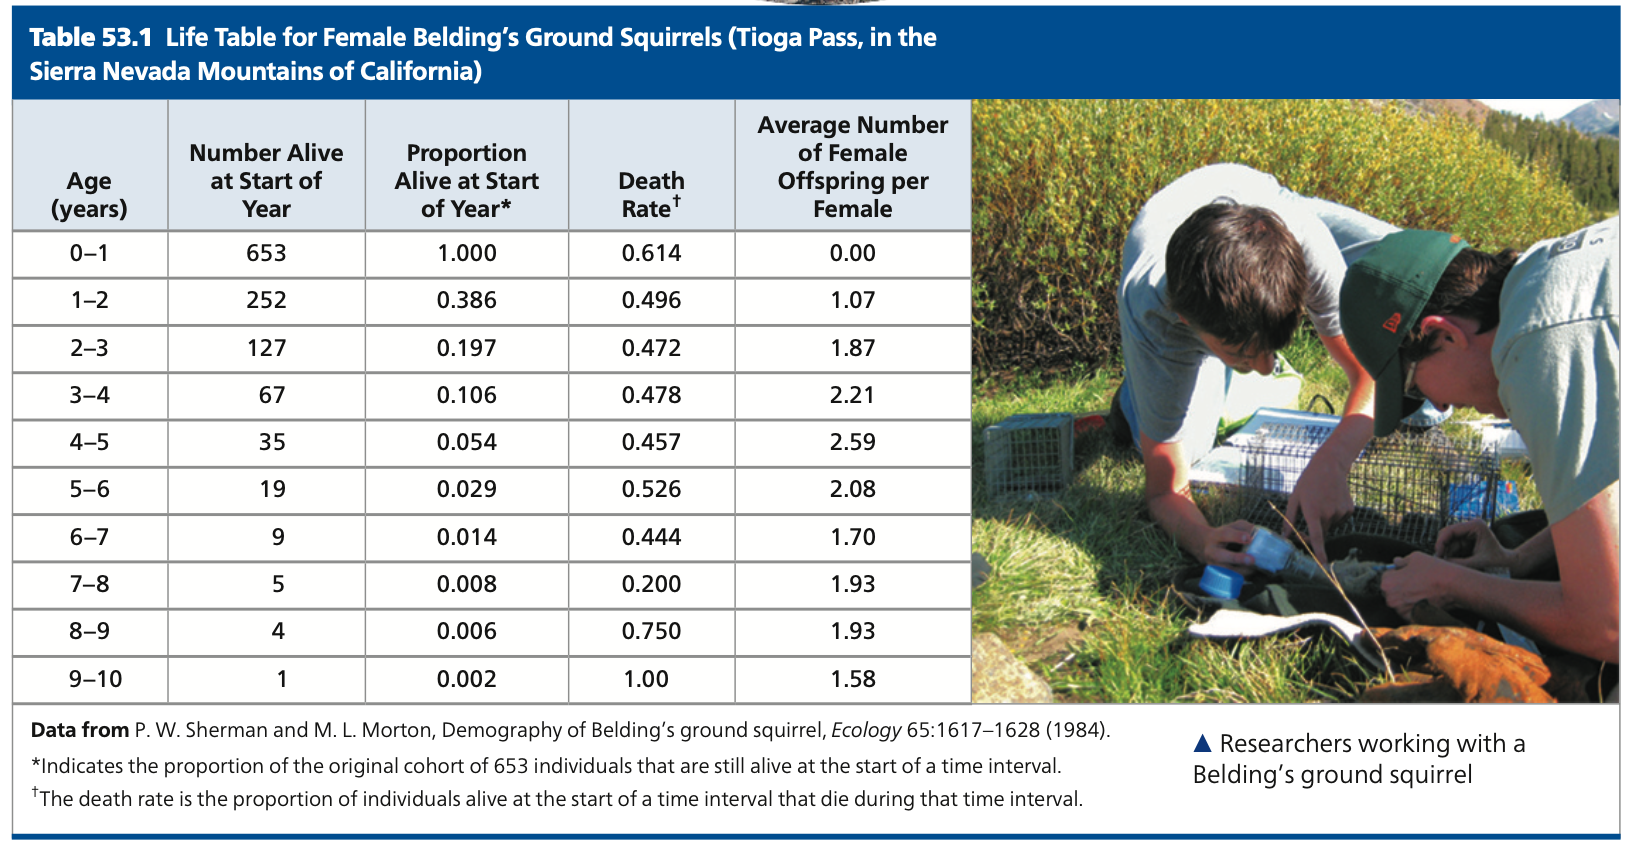
Life tables
● summarizes the survival and reproductive ______ of individuals in specific ___-groups within a population
○ follows the fate of a ____ from birth until all of the individuals are dead
Demographers who study sexually reproducing species often ignore the males and concentrate on the ______ in a population because only females produce offspring.
22
New cards
Life tables
1. Age (years)
2. Number alive at start of year
3. Proportion alive at star of year (proportion of the original cohort of 653 individuals that are still alive at the start of a time interval)
4. Death rate (proportion of individuals alive at the start of a time interval that die during that time interval)
5. Average number of female offspring per female
23
New cards
Cohort
➔ a group of individuals of the same age
24
New cards
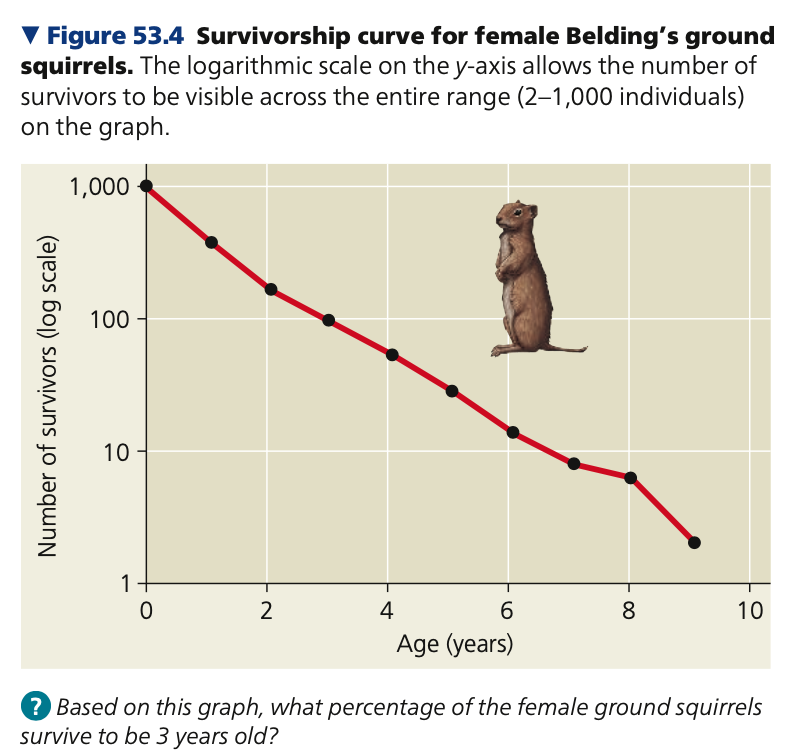
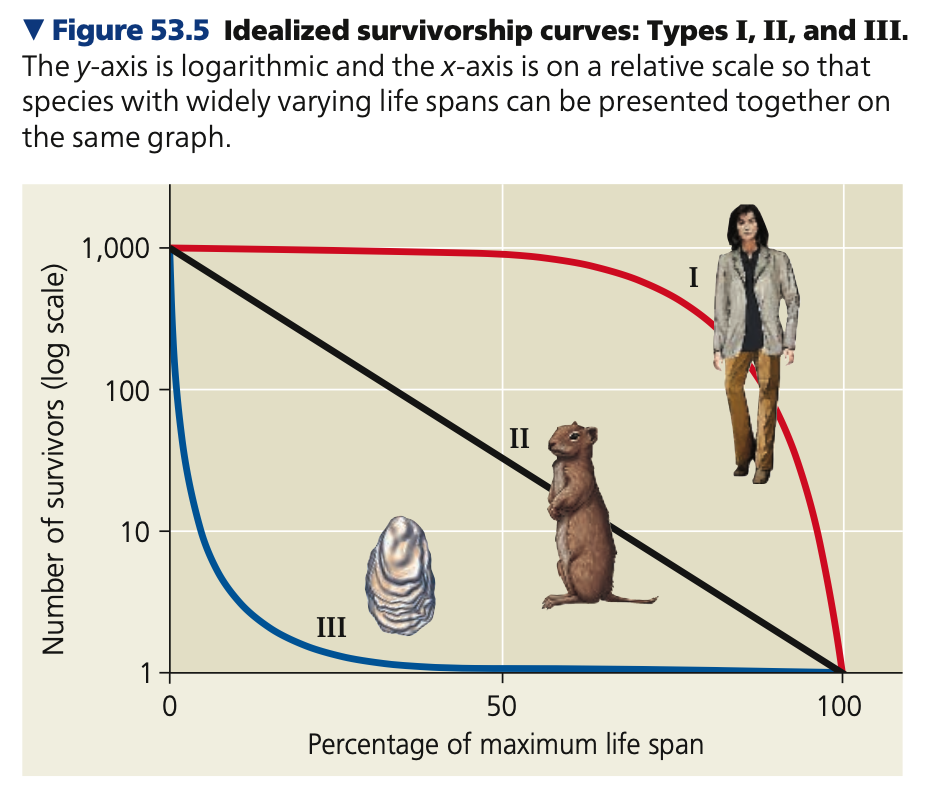
Survivorship curves
● shows the proportion or numbers in a cohort still alive at each age
1. Type 1
2. Type 2
3. Type 3
1. Type 1
2. Type 2
3. Type 3
25
New cards
low, elephants
Type 1
○ ___ death rates during early and
middle life, increase in death rates
among older age-group
○ Ex. organisms that produce few
offsprings but provide good care such as humans and ______
○ ___ death rates during early and
middle life, increase in death rates
among older age-group
○ Ex. organisms that produce few
offsprings but provide good care such as humans and ______

26
New cards
constant, annual
Type 2
○ _______ death rate over the organism’s life span
○ Ex. rodents, invertebrates, lizards
and _____ plants
○ _______ death rate over the organism’s life span
○ Ex. rodents, invertebrates, lizards
and _____ plants
27
New cards
high
Type 3
○ very ____ death rates for the young,
decline in death rates for those that
survive the early die-off
○ Ex. organisms that produce very large numbers of offsprings but provide little or no care such as long-lived plants, fishes and many marine invertebrates
○ very ____ death rates for the young,
decline in death rates for those that
survive the early die-off
○ Ex. organisms that produce very large numbers of offsprings but provide little or no care such as long-lived plants, fishes and many marine invertebrates

28
New cards
between, birds, stair, molts, species
* Many species fall somewhere ______ these basic types of survivorship or show more complex patterns.
* In _______, mortality is often high among the youngest individuals (as in a Type III curve) but fairly constant among adults (as in a Type II curve).
* Some invertebrates, such as crabs, may show a “___-stepped” curve, with brief periods of increased mortality during ____, followed by periods of lower mortality when their protective exoskeleton is hard.
* In addition to such variation among species, survivorship curves also can differ among the populations of a single _____.
29
New cards
breeding, genetic
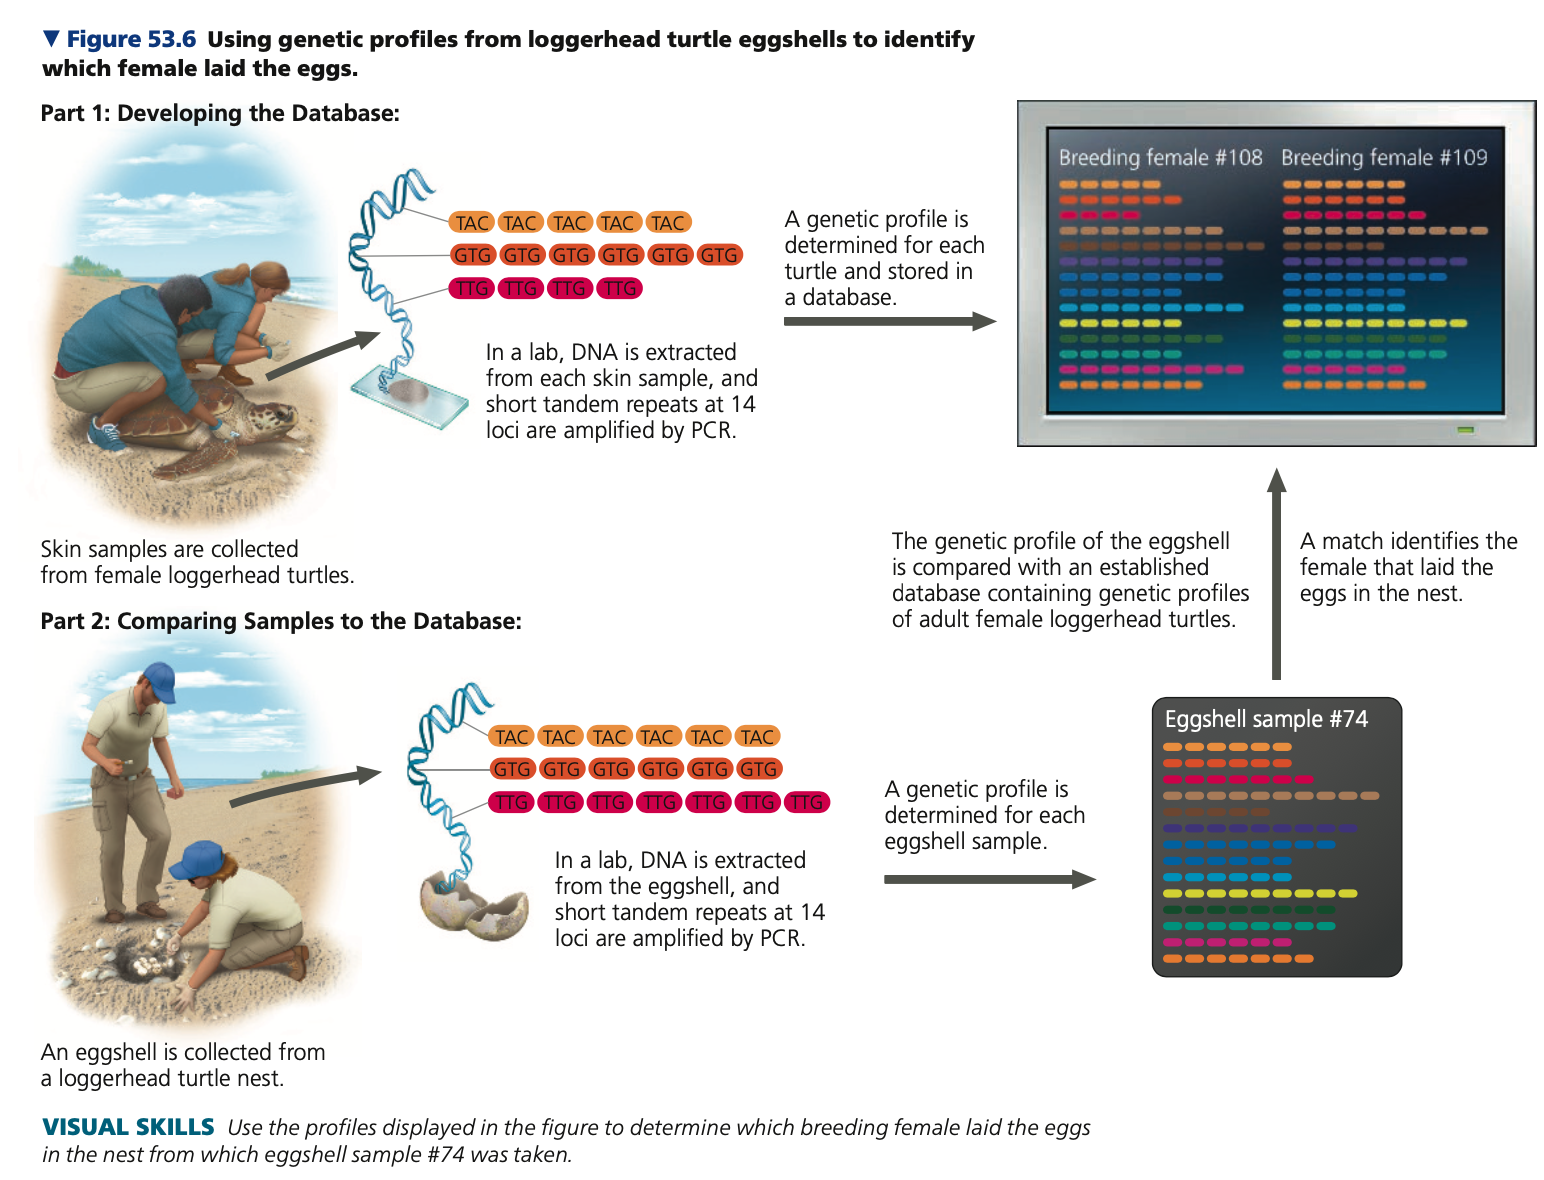
Reproductive rates
● The simplest way to describe the reproductive pattern of a population is to identify how reproductive output varies with the number of ______ females and their ages.
● Approaches:
1. direct counts
2. mark-recapture method
3. molecular method
■ Ex. using _____ profiles from loggerhead turtle eggshells to identify which female laid the eggs
30
New cards
sexual, average, squirrels
Reproductive rates
● Reproductive output for ______ organisms such as birds and mammals is typically measured as the _____ number of female offspring produced by the females in a given age-group.
○ For some organisms, the number of offspring for each female can be counted directly; alternatively, molecular methods can be used
■ Researchers directly counted the offspring of the Belding’s ground _____, which begin to reproduce at age 1 year.
■ The squirrels’ reproductive output rises to a peak at 4–5 years of age and then gradually falls off in older females (see Table 53.1).
31
New cards
Age, growth
● ___-specific reproductive rates vary considerably by species.
○ Squirrels, for example, have a litter of two to six young once a year for less than a decade
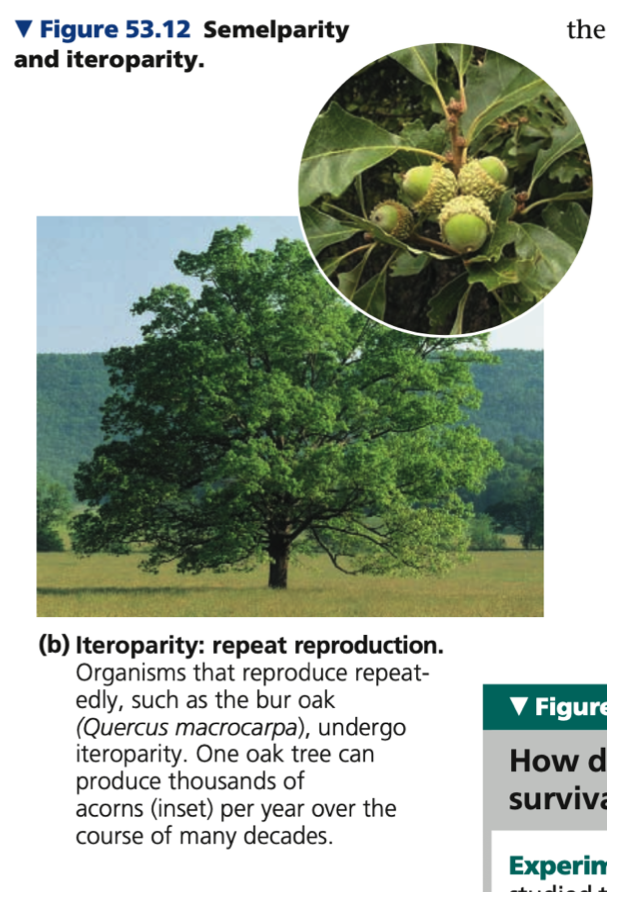
○ Oak trees drop thousands of acorns each year for tens or hundreds of years.
● Mussels and other invertebrates may release millions of eggs and sperm in a spawning cycle.
● However, a high reproductive rate will not lead to rapid population ______ unless conditions are near ideal for the growth and survival of offspring
○ Squirrels, for example, have a litter of two to six young once a year for less than a decade
○ Oak trees drop thousands of acorns each year for tens or hundreds of years.
● Mussels and other invertebrates may release millions of eggs and sperm in a spawning cycle.
● However, a high reproductive rate will not lead to rapid population ______ unless conditions are near ideal for the growth and survival of offspring
32
New cards
Exponential model
Populations have the potential to expand greatly when resources are abundant.
33
New cards
Exponential model
- Per capita rate of change
- Exponential population growth
- Exponential population growth
34
New cards
Per capita rate of change
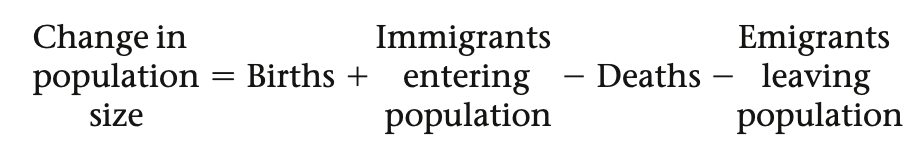
1. Change in population size (verbal form)
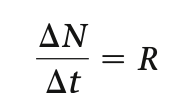
2. Change in population size (math form)
3. Change in population size per capita (per individual)
2. Change in population size (math form)
3. Change in population size per capita (per individual)
35
New cards
minus,
Change in population size (verbal form)
● If immigration and emigration are ignored, a population’s growth rate equals birth rate ____ death rate. For the next equations, both immigration and emigration are ignored
● If immigration and emigration are ignored, a population’s growth rate equals birth rate ____ death rate. For the next equations, both immigration and emigration are ignored
36
New cards
size, time, -
Change in population size (math form)
where
ΔN = change in population ___
Δt = change in ___
R = births _ deaths
where
ΔN = change in population ___
Δt = change in ___
R = births _ deaths
37
New cards
average
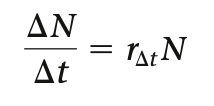
Change in population size per capital (per individual): rΔt
● R can be substituted as rΔtN, where rΔt = contribution that an ______ member of the population makes to the number of individuals added to or subtracted from the population during the time interval Δt:
● R can be substituted as rΔtN, where rΔt = contribution that an ______ member of the population makes to the number of individuals added to or subtracted from the population during the time interval Δt:
38
New cards
Change in population size
a. Change in population size: 16/1000 = 0.016
b. Population size: 500
b. Population size: 500

39
New cards
ideal, constant, abundant
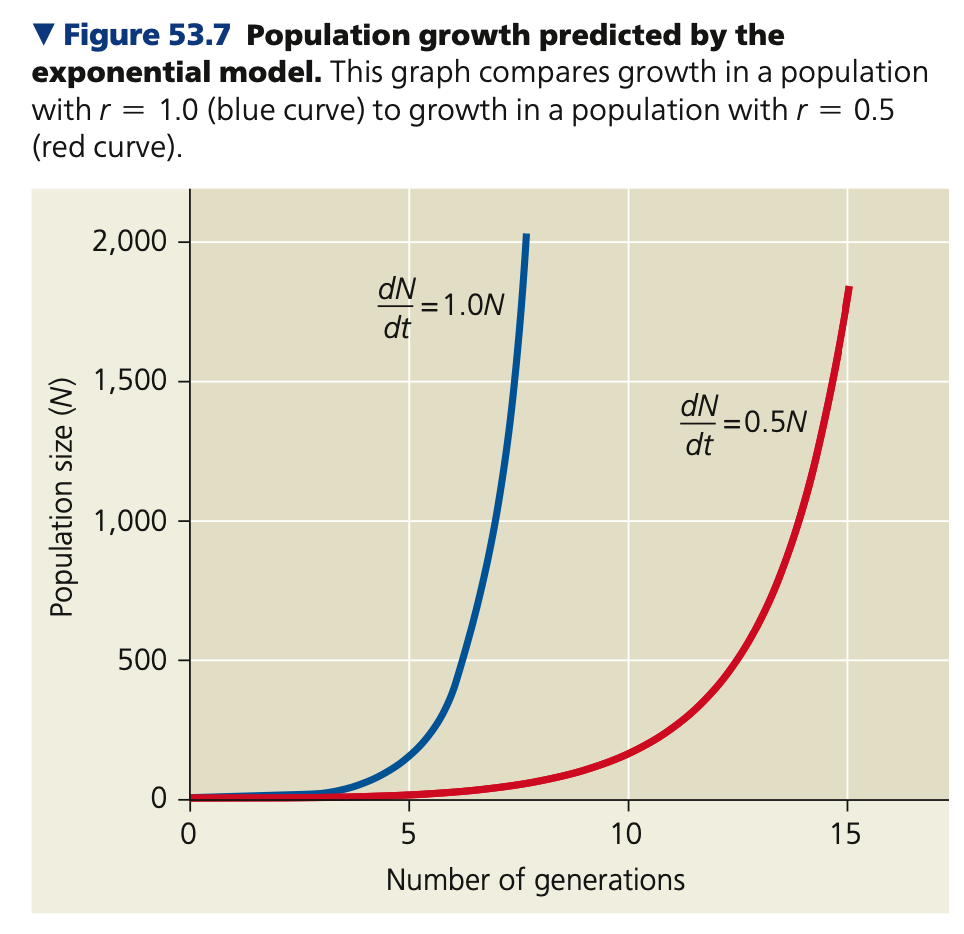
Exponential population growth
● A pattern of growth where a population experiences such ____ conditions increases in size by a _______ proportion at each instant in time.
● Assumes that resources remain ______.
● This pattern cannot be sustained for long in populations.
1. Equation
2. Model
● A pattern of growth where a population experiences such ____ conditions increases in size by a _______ proportion at each instant in time.
● Assumes that resources remain ______.
● This pattern cannot be sustained for long in populations.
1. Equation
2. Model
40
New cards
rate, size, intrinsic
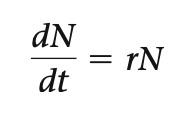
Equation for exponential growth
dN/dt = ___ at which population is increasing in size at each moment in time
N = population ____
r = _____ rate of increase (constant)
dN/dt = ___ at which population is increasing in size at each moment in time
N = population ____
r = _____ rate of increase (constant)
41
New cards
larger, J, catastrophic, rebounding, higher
Graph for exponential growth
● More individuals are added per unit time when the population is ______ than when it is smaller; resulting in a steeper, __-shaped curve.
● J-shaped curves are characteristic of some populations that are introduced into a new environment or whose numbers have been drastically reduced by a ________ event and are ______.
● Rate of growth is also dependent on the intrinsic rate of increase r. The ____ the r, the faster the growth.
42
New cards
Logistical model
- Logistic growth model
- Logistic model & real populations
- Logistic model & real populations
43
New cards
slowly, fewer
Logistical model
● Describes how a population grows more _____ as it nears its carrying capacity
● As the size of a population increases, each individual has access to _____ resources
● Describes how a population grows more _____ as it nears its carrying capacity
● As the size of a population increases, each individual has access to _____ resources
44
New cards
Carrying capacity (K)
➔ Maximum population size that a
particular environment can sustain
➔ Varies over space and time with the
abundance of limiting resources
particular environment can sustain
➔ Varies over space and time with the
abundance of limiting resources
45
New cards
Limiting, E, Shel, Refuge, Nutrient, nesting, bats
Carrying capacity (K)
➔ Limiting factors:
1. _nergy
2. _____ter
3. _____ from predators
4. ______ availability
5. Water
6. Suitable _____ sites
➔ Carrying capacity for ___ may be high in a habitat with abundant flying insects and roosting sites but lower where there is abundant food but fewer suitable shelters
➔ Limiting factors:
1. _nergy
2. _____ter
3. _____ from predators
4. ______ availability
5. Water
6. Suitable _____ sites
➔ Carrying capacity for ___ may be high in a habitat with abundant flying insects and roosting sites but lower where there is abundant food but fewer suitable shelters
46
New cards
Crowding, resource, decline, increase, drop
● ______ and _______ limitations can have a profound effect on population rate
○ If individuals cannot obtain sufficient resources, per capita birth rate will _____
○ If starvation or disease increases with density, per capita death rate may ______
● Falling per capita birth rates or rising per capita death rates will cause per capita rate of population growth to ____ (opposite of constant per capita growth rate r, as seen in exponential growth)
47
New cards
Logistic growth model
● We can modify our model so that per capita population growth rate decreases as N increases
1. Equation
2. Graph
1. Equation
2. Graph
48
New cards
zero
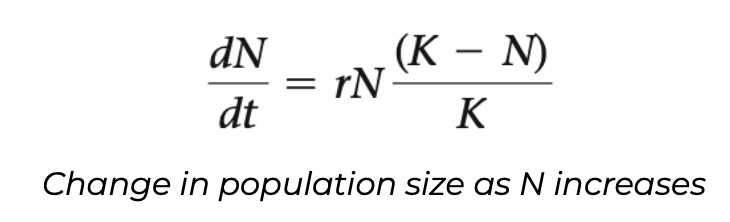
Equation for logistic growth
➔ Per capita rate of population growth
approaches ____ as the population size nears carrying capacity
1. When (K-N)/K is close to 1
2. When (K-N)/K is close to 0
3. When (K-N)/K is 0
➔ Per capita rate of population growth
approaches ____ as the population size nears carrying capacity
1. When (K-N)/K is close to 1
2. When (K-N)/K is close to 0
3. When (K-N)/K is 0
49
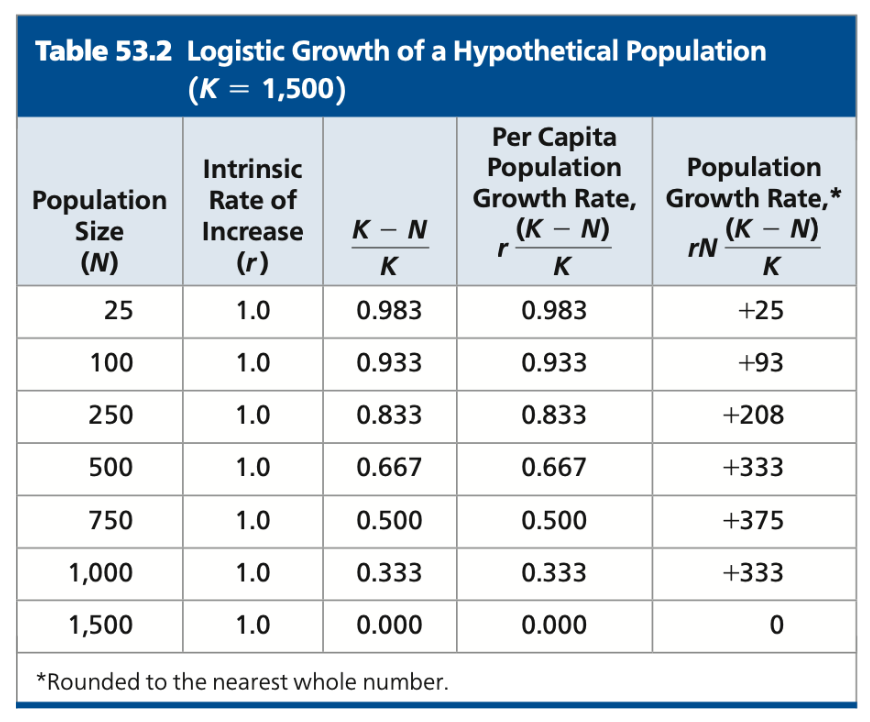
New cards
small
When (K-N)/K is close to 1, N is ____ compared to K
○ Per capita rate of population growth will be close to r
○ Intrinsic rate of increase seen in exponential growth
○ Per capita rate of population growth will be close to r
○ Intrinsic rate of increase seen in exponential growth

50
New cards
large
When (K-N)/K is close to 0, N is ____ compared to K
○ Per capita rate of population growth is small
○ Per capita rate of population growth is small

51
New cards
equal
When (K-N)/K is 0, N is ___ to K
○ Population stops growing
○ Population stops growing
52
New cards
sigmoid, intermediate, decreases
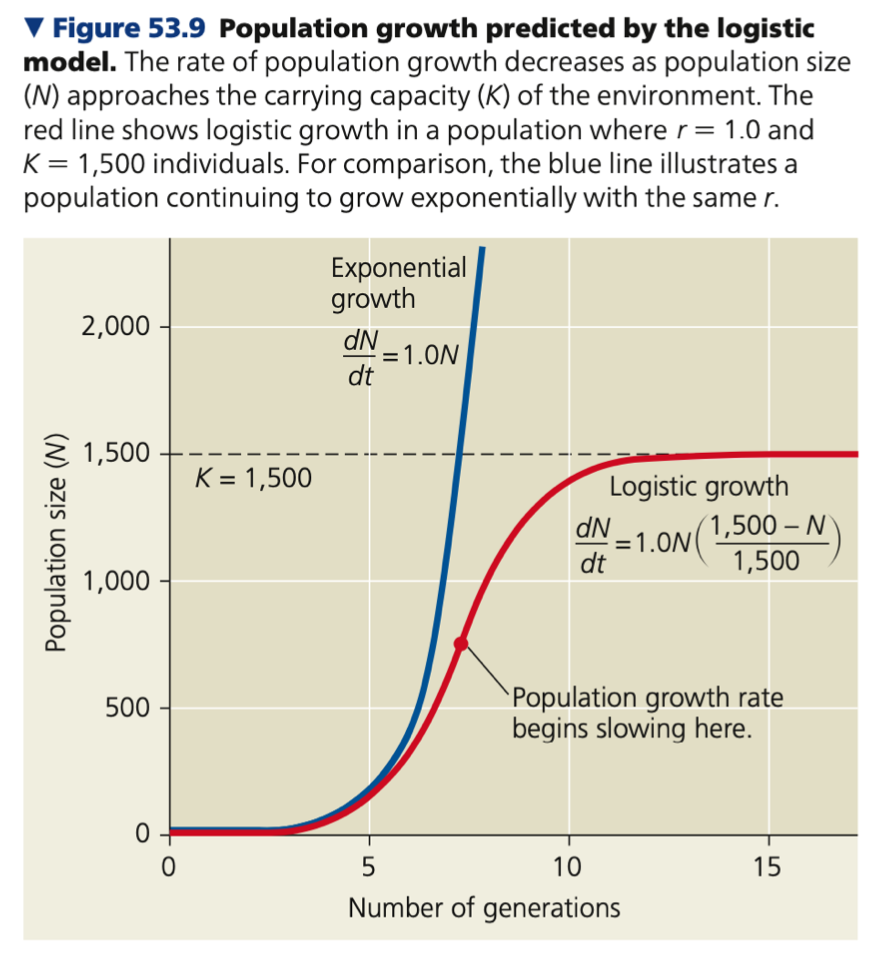
Graph for logistic growth
● Produces a _____ (S-shaped) growth curve when N is plotted over time (red line)
● New individuals are added most rapidly at _______ population sizes
● Number of individuals added ______ dramatically as N approaches K
○ Population growth rate (dN/dt) also decreases as N approaches K
● Produces a _____ (S-shaped) growth curve when N is plotted over time (red line)
● New individuals are added most rapidly at _______ population sizes
● Number of individuals added ______ dramatically as N approaches K
○ Population growth rate (dN/dt) also decreases as N approaches K
53
New cards
Logistic model & real populations
1. Approximates logistic growth
2. Does not correspond to logistic growth
2. Does not correspond to logistic growth
54
New cards
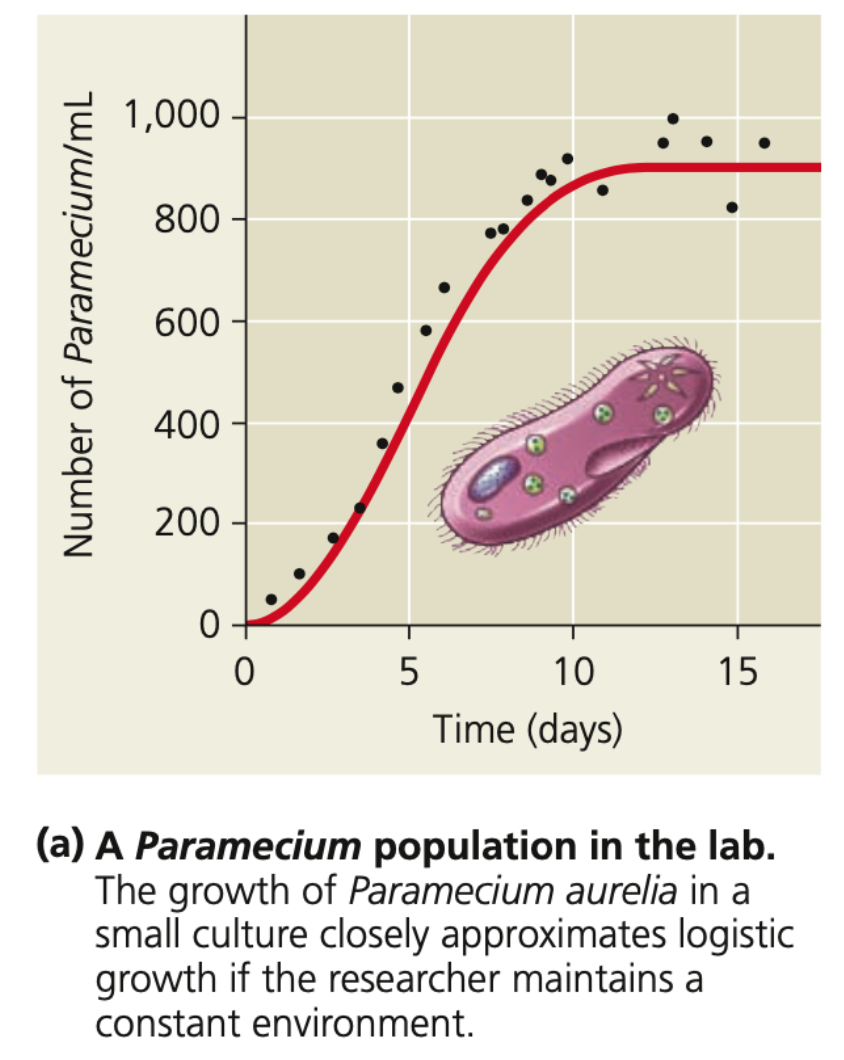
Paramecium, constant
Approximates logistic growth
● Growth of laboratory animals (beetles, crustaceans) and microorganisms (bacteria, ______, yeasts) fit an S-shaped curve under conditions of limited resources
○ Are grown in a ______ environment w/o predators and competing species
● Growth of laboratory animals (beetles, crustaceans) and microorganisms (bacteria, ______, yeasts) fit an S-shaped curve under conditions of limited resources
○ Are grown in a ______ environment w/o predators and competing species
55
New cards
match
● Populations in nature rarely ____ the predictions of the logistic model
○ Logistical model does not apply to all populations
○ Assumes populations adjust instantaneously to growth and approach carrying capacity smoothly
○ Logistical model does not apply to all populations
○ Assumes populations adjust instantaneously to growth and approach carrying capacity smoothly
56
New cards
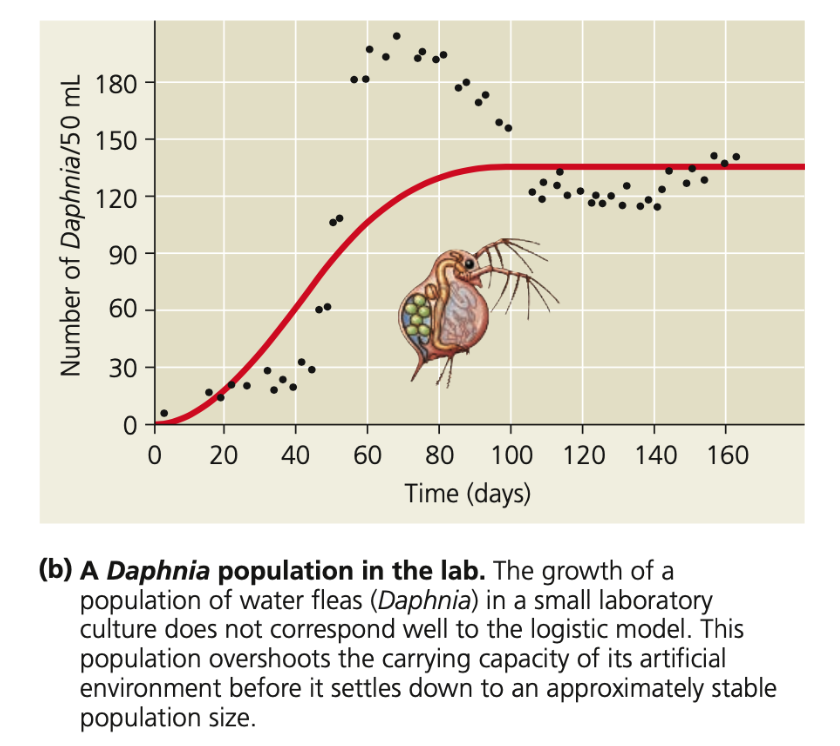
delay, overshoot
Does not correspond to logistic growth
● In reality, there is often a ____ before the negative effects of an increasing population are realized
○ If food is a limiting factor, reproduction will decline eventually and females may use their energy reserves to continue reproducing for a short time
○ Causes an _____ in carrying capacity (see water fleas)
57
New cards
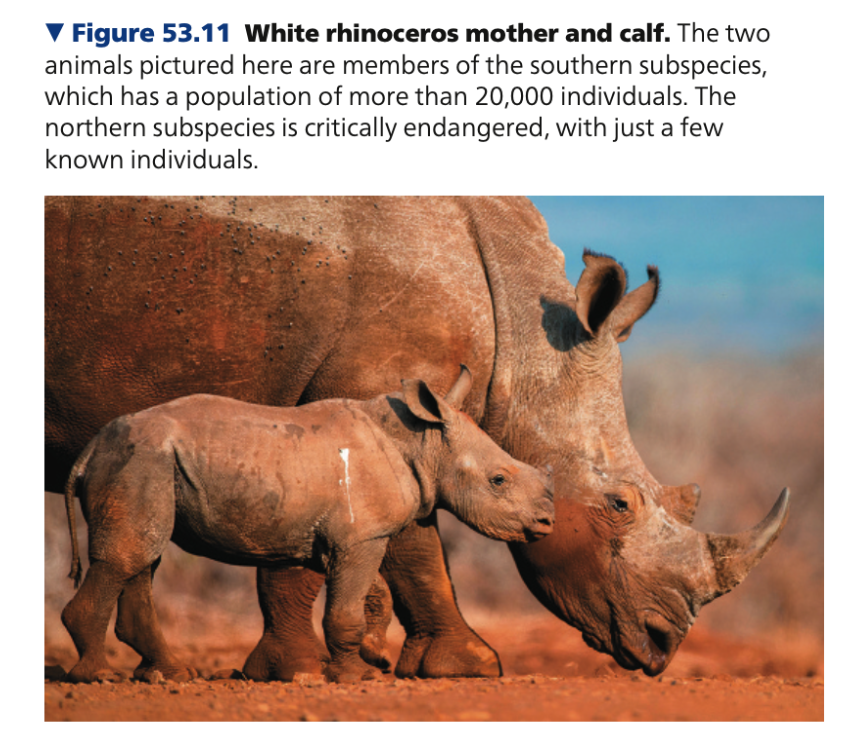
Hardy-Weinberg, conservation
Logistic model & real populations
● Provides a useful starting point for thinking about how populations grow and for constructing more complex models
○ Similar to the role played by the ________ equation for thinking about the evolution of populations
● Also important in ______ biology
○ Conservation biologists can also use
the model to estimate the critical size below which populations of certain organisms may become extinct (white rhinoceros- Ceratotherium simum)
58
New cards
Life history traits
- Diversity of Life Histories
a. When Reproduction Begins
b. Frequency of Reproduction
c. Number of Offspring per Episode
- “Trade-offs” and Life Histories
a. Trade-offs
b. Selection of traits
a. When Reproduction Begins
b. Frequency of Reproduction
c. Number of Offspring per Episode
- “Trade-offs” and Life Histories
a. Trade-offs
b. Selection of traits
59
New cards
Trade, frequency, number, parental
Life history traits
● Natural selections favors traits that improve an organism’s chances of survival and reproductive success
● ____-offs between survival and reproductive traits:
○ _______ of reproduction
○ _______ of offspring (seeds,
litter/clutch size)
○ Investment in _______ care
● Natural selections favors traits that improve an organism’s chances of survival and reproductive success
● ____-offs between survival and reproductive traits:
○ _______ of reproduction
○ _______ of offspring (seeds,
litter/clutch size)
○ Investment in _______ care
60
New cards
Life History
➔ Traits that affect an organism’s schedule of reproduction and survival
➔ Life history traits are evolutionary outcomes reflected in its development, physiology, and behavior
➔ Life history traits are evolutionary outcomes reflected in its development, physiology, and behavior
61
New cards
Evolution
Diversity of Life Histories
● _____ accounts for diversity of life histories
● Three key components of an organism’s life history:
1. When Reproduction Begins
2. Frequency of Reproduction
3. Number of Offspring per Episode
● _____ accounts for diversity of life histories
● Three key components of an organism’s life history:
1. When Reproduction Begins
2. Frequency of Reproduction
3. Number of Offspring per Episode
62
New cards
first, turtle, Coho
When Reproduction Begins
● Age at ___ reproduction / age at maturity
● Varies considerably across species
○ 30 years old for loggerhead _____
○ 3-4 years old for ___ salmon
● Age at ___ reproduction / age at maturity
● Varies considerably across species
○ 30 years old for loggerhead _____
○ 3-4 years old for ___ salmon
63
New cards
Frequency of Reproduction
1. Semelparity
2. Iteroparity
2. Iteroparity
64
New cards
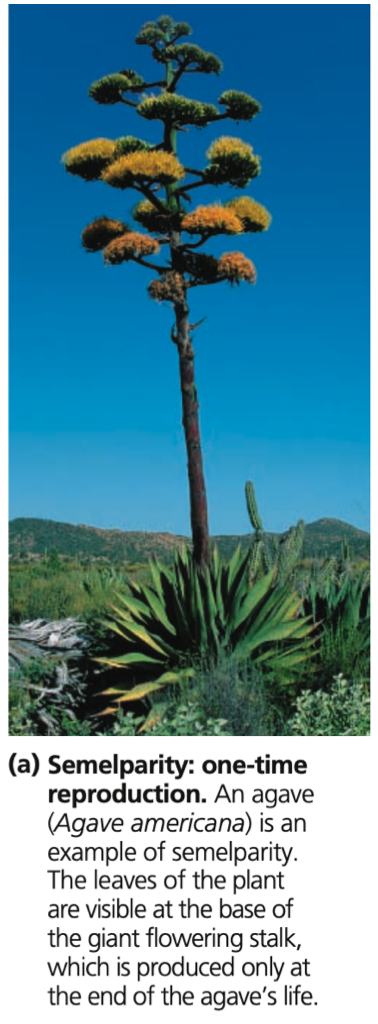
Semelparity
➔ From the Latin semel (once) and parere (to beget)
➔ Organisms that undergo a “one-shot” pattern of big-bang reproduction
1. Coho salmon
2. Agave or “century plant”
➔ Organisms that undergo a “one-shot” pattern of big-bang reproduction
1. Coho salmon
2. Agave or “century plant”
65
New cards
Pacific
Semelparity (Coho salmon)
◆ Hatches in the head water of a freshwater stream and then migrates to the _____ Ocean (requires a few years to mature)
◆ Eventually returns to the same stream to spawn, producing thousands of eggs before it dies
◆ Hatches in the head water of a freshwater stream and then migrates to the _____ Ocean (requires a few years to mature)
◆ Eventually returns to the same stream to spawn, producing thousands of eggs before it dies
66
New cards
arid, wet
Semelparity (Agave or “century plant”)
◆ Grow in ___ climates with unpredictable rainfall and poor soils
◆ Grow for years until there is
an unusually ___ year in which sends up a large
◆ An adaptation to harsh desert
environment
◆ Grow in ___ climates with unpredictable rainfall and poor soils
◆ Grow for years until there is
an unusually ___ year in which sends up a large
◆ An adaptation to harsh desert
environment
67
New cards
Iteroparity
➔ From the Latin iterare (to repeat)
➔ Repeated reproduction
1. Loggerhead turtle
2. Horses and other large mammals, fish, sea urchins, and long-lived trees (maples and oaks)
➔ Repeated reproduction
1. Loggerhead turtle
2. Horses and other large mammals, fish, sea urchins, and long-lived trees (maples and oaks)
68
New cards
clutches
Iteroparity (Loggerhead turtle)
◆ Produces 4 _____ (300 eggs) in a year
◆ Then waits 2-3 years before laying more eggs as it lacks sufficient resources to produce that many eggs
every year
◆ Mature turtle may lay eggs for 30 years after first clutch
◆ Produces 4 _____ (300 eggs) in a year
◆ Then waits 2-3 years before laying more eggs as it lacks sufficient resources to produce that many eggs
every year
◆ Mature turtle may lay eggs for 30 years after first clutch
69
New cards
mammals, fish, trees
Iteroparity
- Horses and other large _____, ____, sea urchins, and long-lived ____ (maples and oaks)
- Horses and other large _____, ____, sea urchins, and long-lived ____ (maples and oaks)
70
New cards
White, plants
Number of Offspring per Episode
● Vary in how many offspring they reproduce
○ _____ rhinoceros
■ Produces a single calf when they reproduce
○ Insects and many ____
■ Produce large numbers of offspring
● Vary in how many offspring they reproduce
○ _____ rhinoceros
■ Produces a single calf when they reproduce
○ Insects and many ____
■ Produce large numbers of offspring
71
New cards
“Trade-offs” and Life Histories
1. Trade-offs
2. Selection of traits
2. Selection of traits
72
New cards
Trade-offs
1. between the number of offspring and the amount of resources a parent can devote to each offspring
2. between number and size of offspring
3. Extra investment on the part of the parents greatly increases offspring’s chances of survival
2. between number and size of offspring
3. Extra investment on the part of the parents greatly increases offspring’s chances of survival
73
New cards
number, resources, reduce, kestrels, deer
● Trade-off between the _____ of offspring and the amount of ______ a parent can devote to each offspring
● Occur because organisms do not have access to unlimited resources
○ Use of resources for one function (e.g., reproduction) can ____ resources available for another function (e.g., survival)
● Eurasians ______
○ Caring for a larger number of young
lowered survival rates of the parents
● Red ____
○ Females that reproduced in the summer were more likely to die the next winter than were females that did not reproduce
74
New cards
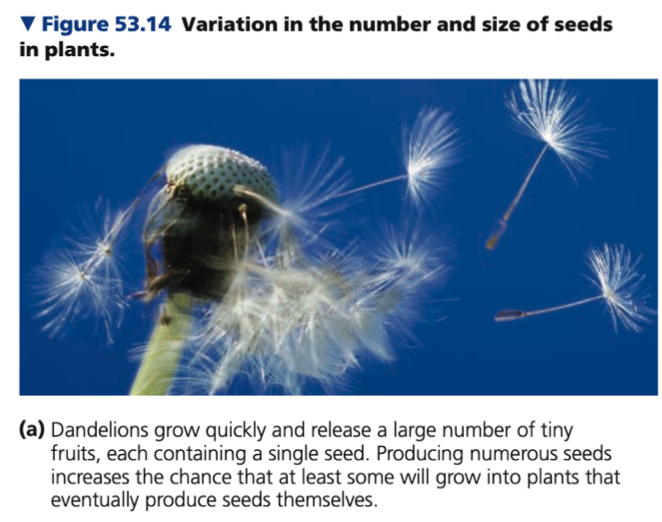
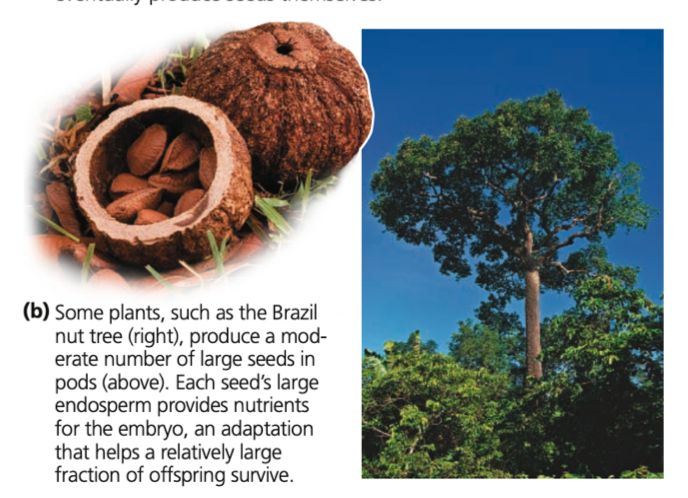
number, size, small, spread, predation
● Selective pressures also influence trade-offs between _____ and ___ of offspring
● Plants and animals whose young have low chance of survival often reproduce ____ offspring
○ Plants
■ Plants that colonize disturbed
environments usually produce small seeds
■ Small size may also increase
_____ by enabling the seeds
to be carried longer distances
○ Animals
■ Animals that suffer high ______ rates (e.g., quail, sardines, and mice) tend to produce many offspring
75
New cards
increases, large, learning
● Extra investment on the part of the parents greatly ______ offspring’s chances of survival
● Brazil nut and walnut trees
○ Produce ____ seeds packed with
nutrients that help the seedlings
become established
● Primates
○ Generally bear only 1-2 offspring at a time
○ Parental care and an extended period of ______ in the first several years are important
● Especially important in habits with high population densities
76
New cards
logistical, range, carrying
Selection of traits
● One way to categorize variation in life history traits is related to _______ growth model
● These names follow from the variables of the logistic equation:
1. K-selection
2. r-selection
● Two concepts represent 2 extremes in a ____ of actual life histories
● Are both grounded in the idea of ______ capacity
77
New cards
high, K, Mature
K-selection
➔ Selection of traits that are
advantageous at ____ densities
➔ Operates in populations living at a
density near the limit imposed by their resources (carrying capacity, __), where competition is stronger
◆ ____ trees in an old-growth forest
➔ Selection of traits that are
advantageous at ____ densities
➔ Operates in populations living at a
density near the limit imposed by their resources (carrying capacity, __), where competition is stronger
◆ ____ trees in an old-growth forest
78
New cards
low, maximize, Weeds
r-selection
➔ Selection of traits that maximize
reproductive success in uncrowded
environments (___ densities)
➔ Said to _______ r (intrinsic rate of
increase)
➔ Occurs in environments in which
population densities are well below
carrying capacity (low competition)
➔ Disturbed habitats that are being
recolonized
◆ ____ growing in an abandoned agricultural field
79
New cards
Density-Dependent Factors
1. Population Change & Density
2. Mechanisms of Density-Dependent
Population Regulation
3. Population Dynamics
a. Stability & Fluctuation
b. Population Cycles: Scientific Inquiry
c. Immigration, Emigration, and Metapopulations
2. Mechanisms of Density-Dependent
Population Regulation
3. Population Dynamics
a. Stability & Fluctuation
b. Population Cycles: Scientific Inquiry
c. Immigration, Emigration, and Metapopulations
80
New cards
reduce, increase, abundance
Density-Dependent Factors
● In cases wherein we seek to _____ the size of an unwanted population or ______ the size of one that is endangered, it is helpful to understand factors that affect population ______.
● In cases wherein we seek to _____ the size of an unwanted population or ______ the size of one that is endangered, it is helpful to understand factors that affect population ______.
81
New cards
exceeds
Population Change & Density
● Ecologists study how the rates of birth, death, immigration, and emigration change as population density rises
● If immigration and emigration offset each other, then a population grows when the birth rate ______ the death rate and declines when the death rate exceeds birth rate
1. Density Independent
2. Density Dependent
82
New cards
not, Mortality, drought, physical
Density Independent
➔ Birth rate or death rate does ___
change with population density
➔ Example. _____ of dune fescue grass (Vulpia fasciculata) is mainly due to _____ stress that arises when the roots are uncovered by shifting sands
◆ ______ factor = density independent
83
New cards
changes, Reproduction, scarce
Density Dependent
➔ Birth rate or death rate ______ with population density
➔ Example. _______ of dune fescue grass (Vulpia fasciculata) declines as population density increases partly because water or nutrients become more _____
➔ Birth rate or death rate ______ with population density
➔ Example. _______ of dune fescue grass (Vulpia fasciculata) declines as population density increases partly because water or nutrients become more _____
84
New cards
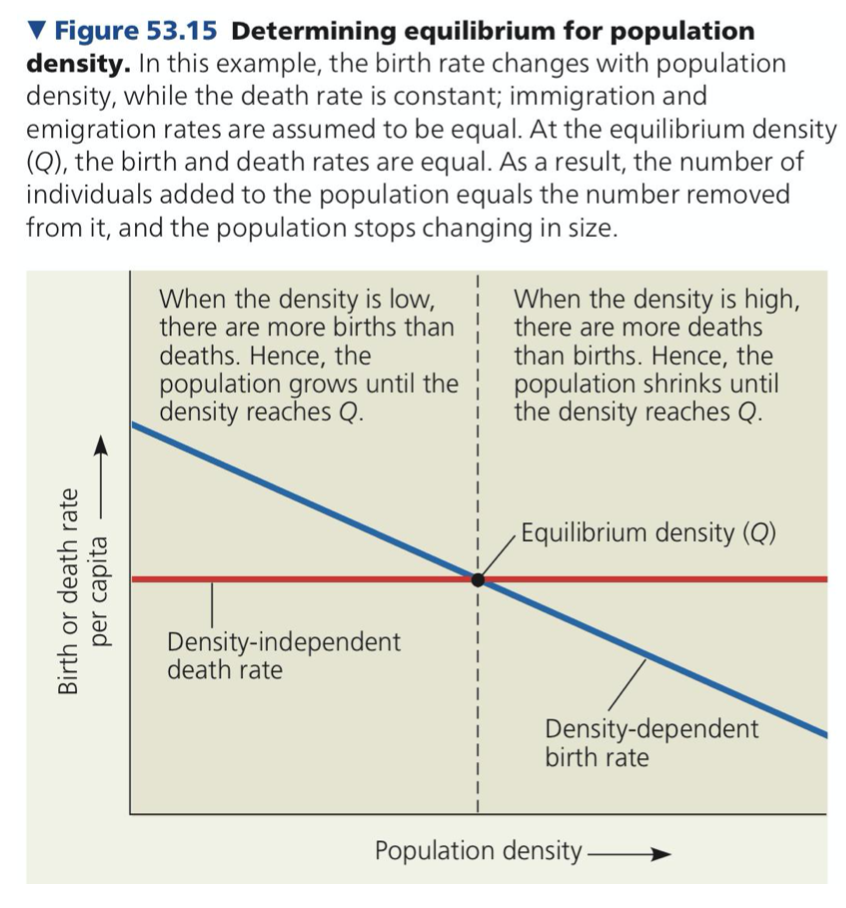
dependent, independent, stop
● In the dune fescue grass population, key factors affecting its birth rate are density _________ while its death rate is largely determined by density-_______ factors
● When immigration and emigration offset each other, the combination of density-dependent reproduction and density-independent mortality can ____ population growth (see Figure 53.15)
● When immigration and emigration offset each other, the combination of density-dependent reproduction and density-independent mortality can ____ population growth (see Figure 53.15)
85
New cards
temperature, precipitation, dependent, regulated
● Variations in density-independent factors such as _______ and ________ can dramatically change population size
○ Example. A drought or a heat wave can sharply increase mortality rates, causing the population to plummet
● Density-independent factors cannot consistently cause a population to decrease in size when it is large or increase in size when it is small
○ Only density-_______ factors can
consistently cause changes
● A population is said to be ______ when one or more density-dependent factors cause its size to decrease when large or increase when small
86
New cards
dependent, Kelp, fluctuate
Mechanisms of Density-Dependent
Population Regulation
● Ultimately, at large population sizes, negative feedback is provided by density-______ regulation which halts population growth by reducing birth rates or increasing death rates
○ Without negative feedback, a population will never stop growing
○ No population can increase in size
indefinitely
○ Example. ___ perch’s (Brachyistius
frenatus) death rate rose proportionally as its density increased because the fish ran out of spaces in the kelp where they could hide from predators
● Increased densities cause population growth rates to decline by affecting reproduction, growth, and survival
● Negative feedback addresses why populations stop growing, but does not explain why some ______ dramatically while others remain relatively stable
87
New cards
Mechanisms of Density-Dependent
Population Regulation
Population Regulation
1. Competition for resources
2. Disease
3. Territoriality
4. Intrinsic factors
5. Toxic wastes
2. Disease
3. Territoriality
4. Intrinsic factors
5. Toxic wastes
88
New cards
fertilizers
Competition for resources
● Increasing population density leads to competition among members of a population for nutrients and other resources
● Leads to reducing reproductive rates
● Farmers counteract the competition on the growth of wheat (Triticum aestivum) and other crops by applying _______ to reduce nutrient limitations on crop yield
89
New cards
transmission, influenza, tuberculosis
Disease
● Density-dependent diseases have an increased rate of _______ as a population becomes more crowded
● In humans, the respiratory diseases ______ (flu) and ________ are spread through the air when someone sneezes or coughs
○ Both diseases strike a greater percentage of people in densely populated cities than in rural areas
90
New cards
Space, cheetahs, surplus
Territoriality
● _____ becomes the resource for which individuals compete
● _______ (Acinonyx jubatus) use a chemical marker in urine to warn other cheetahs of their territorial boundaries
● Presence of ______ (nonbreeding) individuals is a good indicator of territoriality as a population growth restriction
● _____ becomes the resource for which individuals compete
● _______ (Acinonyx jubatus) use a chemical marker in urine to warn other cheetahs of their territorial boundaries
● Presence of ______ (nonbreeding) individuals is a good indicator of territoriality as a population growth restriction
91
New cards
aggressive, hormonal
Intrinsic factors
● Intrinsic physiological factors (operating within an individual organism) sometimes regulate population size
● Reproductive rates of white-footed mice (Peromyscus leucopus) can drop even when food and shelter are abundant because of _______ interactions and ______ changes within individual mice
○ Delays sexual maturation and depresses the immune system
92
New cards
Yeast, Ethanol, 13
Toxic wastes
● ____ (Saccharomyces cerevisiae) converts carbohydrates to ethanol in winemaking
● ____ that accumulates in the wine is toxic to yeasts and contributes to density-dependent regulation of yeast population size
○ Alcohol content of wine is usually less than ___%
■ This is the maximum concentration of ethanol that most wine-producing yeast cells can tolerate
93
New cards
Population Dynamics
➔ Population fluctuations from year to year or place to place
➔ Influenced by many factors and in turn affect other species
➔ Complex interactions between biotic and abiotic factors cause variations in population sizes
➔ Influenced by many factors and in turn affect other species
➔ Complex interactions between biotic and abiotic factors cause variations in population sizes
94
New cards
Population dynamics
1. Stability & Fluctuation
2. Population Cycles
3. Immigration, Emigration, and Metapopulations
2. Population Cycles
3. Immigration, Emigration, and Metapopulations
95
New cards
Stability & Fluctuation
● Populations of large mammals were once thought to remain relatively stable, but long-term studies have challenged this idea
96
New cards
Moose, weather, predation, parasites, wolves, winter
Stability & Fluctuation
● Example. _____ population on Isle Royale in Lake Superior has fluctuated substantially since the 1900s
○ Harsh _____ (cold winters with heavy snowfall) weakens moose and reduces food availability ➔ decreasing population size
○ High moose numbers bring about _____ and an increase in the density of ticks and other ______ ➔ decreasing population size
○ Low moose numbers, mild weather,
and good food availability ➔ increasing population size
○ The moose population experienced 2 major collapses during the last 50 years
■ First major collapse - coincided with a peak in the number of _____ (predators) from 1975-1980
■ Second major collapse - Harsh _____ weather in 1995 increased the energy needs of moose and made it harder for them to find food under deep snow
97
New cards
boom, bust
Population Cycles
* Many populations fluctuate at unpredictable intervals, while others undergo regular___-and-___ cycles
* Small herbivorous mammals (voles and lemmings) tend to have 3-4 year cycles
* Birds (ruffed grouse and ptarmigans) have 9-11 year cycles
* Many populations fluctuate at unpredictable intervals, while others undergo regular___-and-___ cycles
* Small herbivorous mammals (voles and lemmings) tend to have 3-4 year cycles
* Birds (ruffed grouse and ptarmigans) have 9-11 year cycles
98
New cards
hares, lynx
Population Cycles
● Example. 10-year cycling of snowshoe ____ (Lepus americanus) and ___ (Lynx canadensis) in the far northern forests of Canada and Alaska
1. 1st Hypothesis
2. 2nd Hypothesis
● Example. 10-year cycling of snowshoe ____ (Lepus americanus) and ___ (Lynx canadensis) in the far northern forests of Canada and Alaska
1. 1st Hypothesis
2. 2nd Hypothesis
99
New cards
rejected
1st Hypothesis
- Cycles may be caused by food shortage during winter
■ Hares eat the terminal twigs of small shrubs
■ Cycles should stop if extra food is provided to a field population
● Studies show that hare populations in areas with extra food increase in density but continue to cycle similar to unfed control populations
■ First hypothesis is _____
100
New cards
supported
2nd Hypothesis
- Cycles may be due to predator-prey interactions
■ Many predators other than lynx eat hares, and they may overexploit their prey
■ Predators (lynx, coyotes, hawks, and owls) killed 95% of hares in conducted studies
● No hares died due to starvation
■ Predator overexploitation thus seems to be an essential part of snowshoe hare cycles
● With no predators, it is unlikely that hare populations will cycle in Northern Canada
● When predators were excluded from the area, the collapse in the cycle was nearly eliminated
■ Second hypothesis is ______