Quality Control
1/24
There's no tags or description
Looks like no tags are added yet.
Name | Mastery | Learn | Test | Matching | Spaced | Call with Kai |
|---|
No analytics yet
Send a link to your students to track their progress
25 Terms
mean
the average of a group of data points
e.g. (120, 115, 120, 109, 111)
575/5 = 115
mode
the most commonly occurring value in a group of data points
e.g. (120, 115, 120, 109, 111)
120 (occurs twice)
median
the middle value in a group of data points
e.g. (120, 115, 120, 109, 111)
109, 111, 115, 120, 120
middle = 115
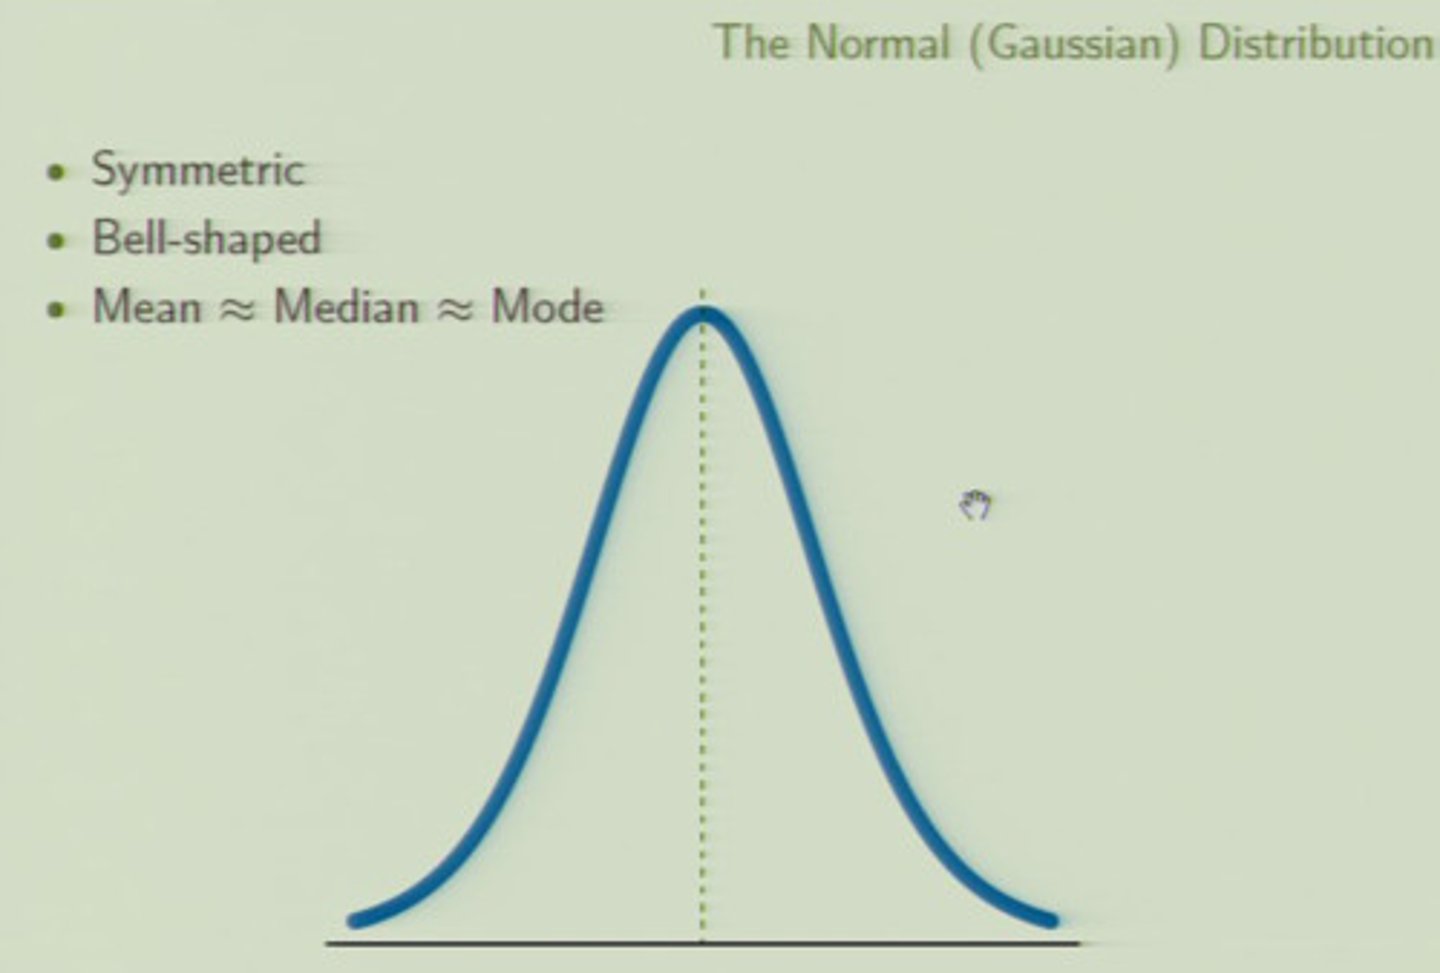
Gaussian distribution (normal distribution)
a theoretical distribution in which the mean, median and mode are equal
standard deviation
the dispersion of data points around the mean
standard deviation formula (provided)
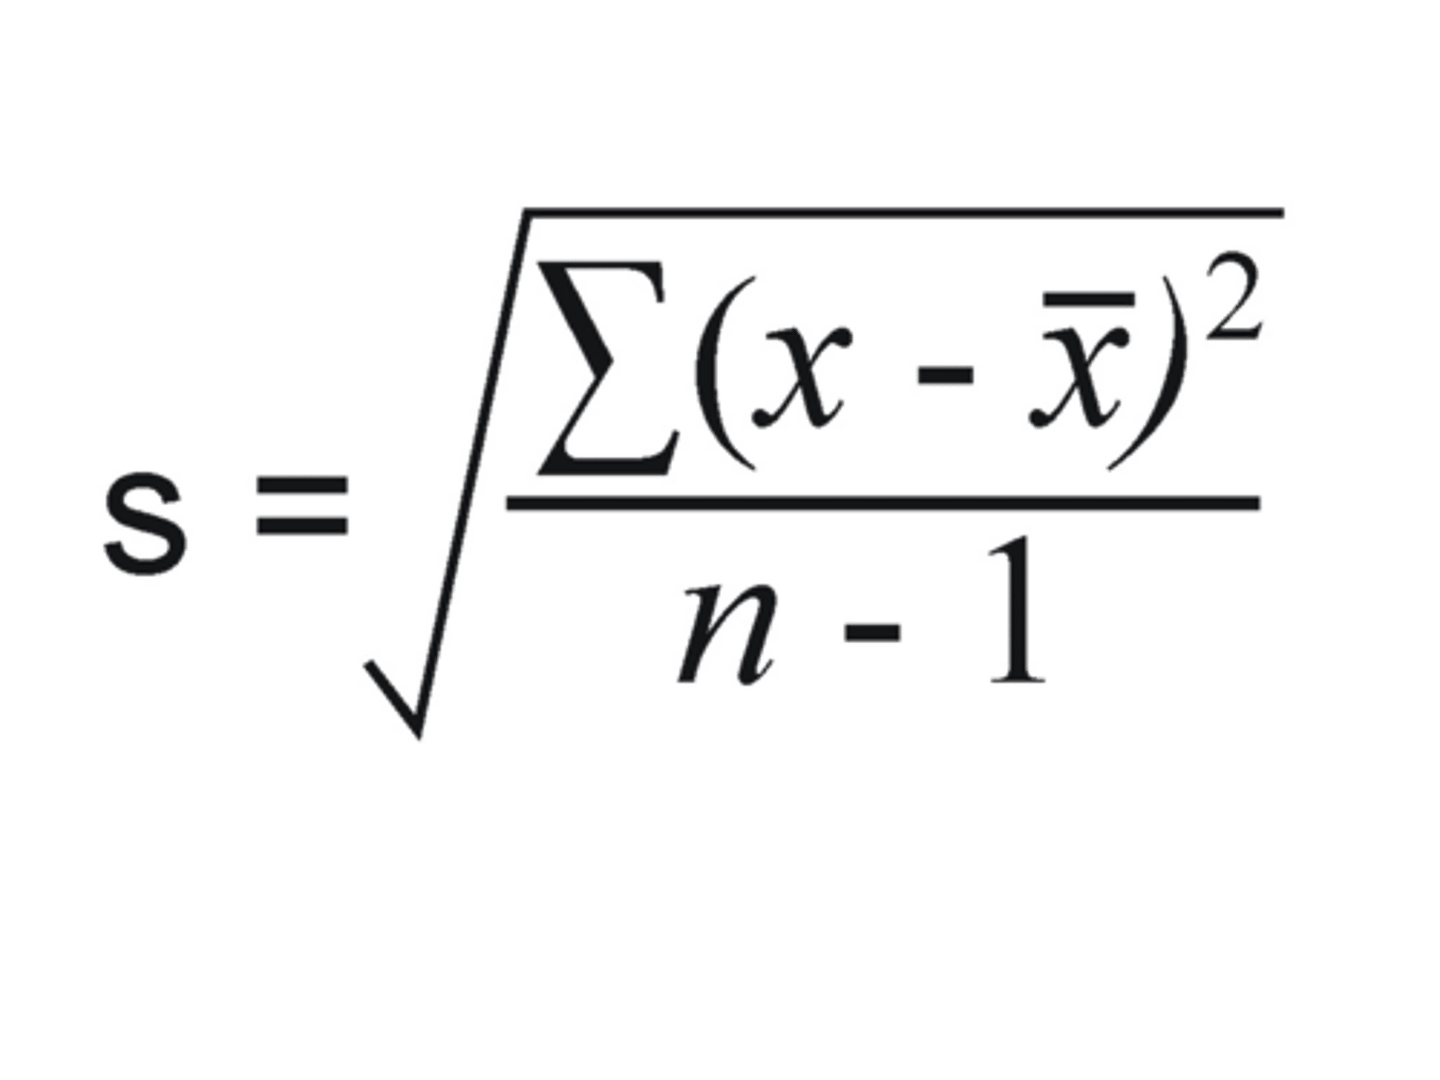
standard deviation steps
1. calculate the mean
2. subtract the mean from each value
3. square the difference for each value
4. add up the squared differences
5. divide by (n-1)
6. take the square root
n
the number of data points
Percent falling within 2 SD
95%
acceptable variation in QC data
+/- 2 standard deviations from the mean
95% confidence
95% of the values (19 results out of 20) should be within the allowable variation of +/- 2SD according to the Gaussian distribution
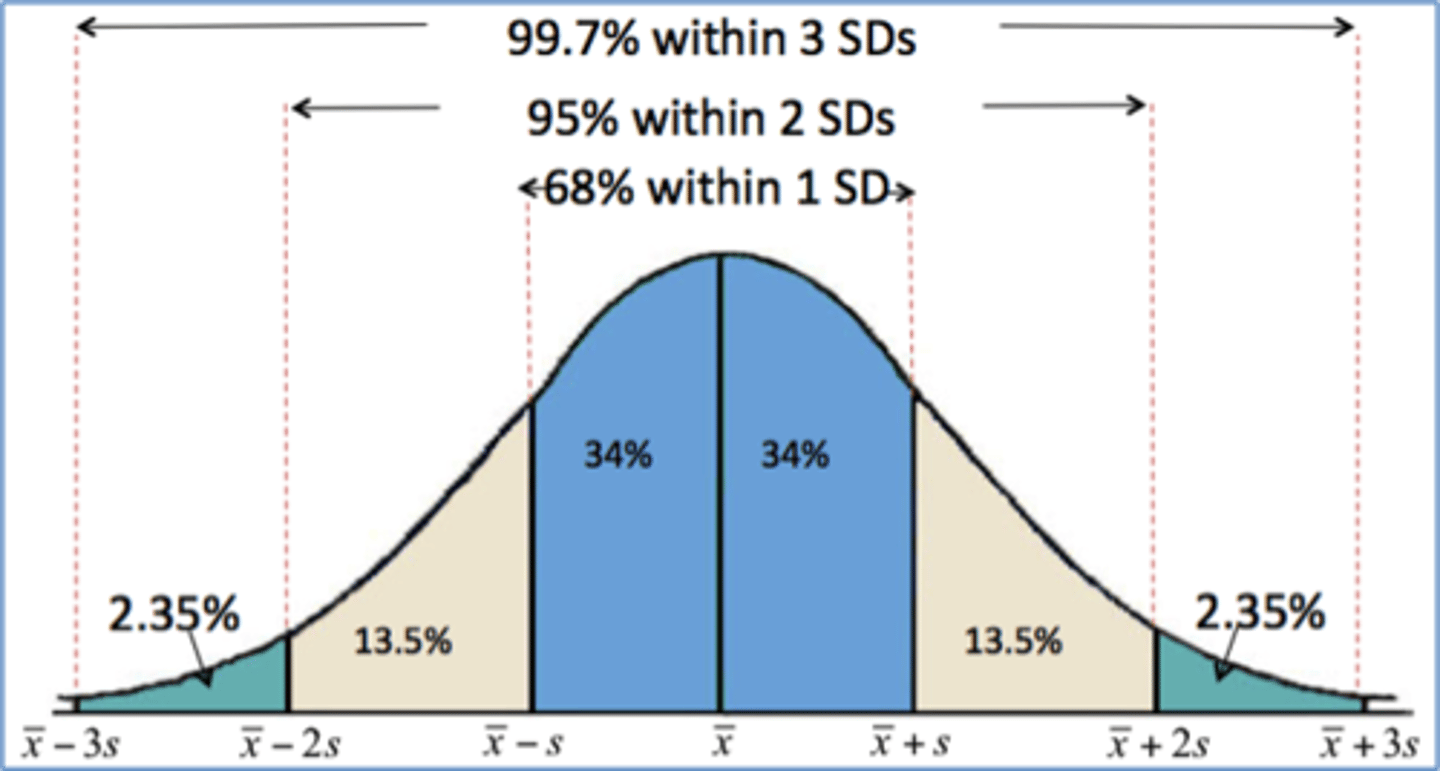
5% error
5% of the values (1 result out of 20) may be outside the allowable variation of +/- 2SD due to chance

acceptable QC range of: (mean = 115, SD = 5)
= mean +/- 2SD
= 115 +/- 10
= 105-125
coefficient of variation
a measure of the distribution of a data set in relation to its mean
helps to compare data sets when their mean is not the same
A lower CV value has
higher reliability
coefficient of variation formula
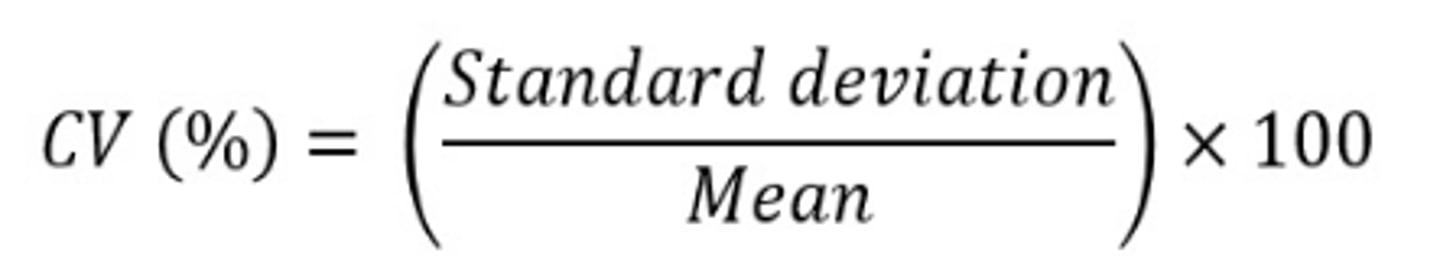
CV of a data set with: (mean = 115, SD = 5)
= SD / mean (x 100%)
= 5 / 115 (x 100%)
= 4 %
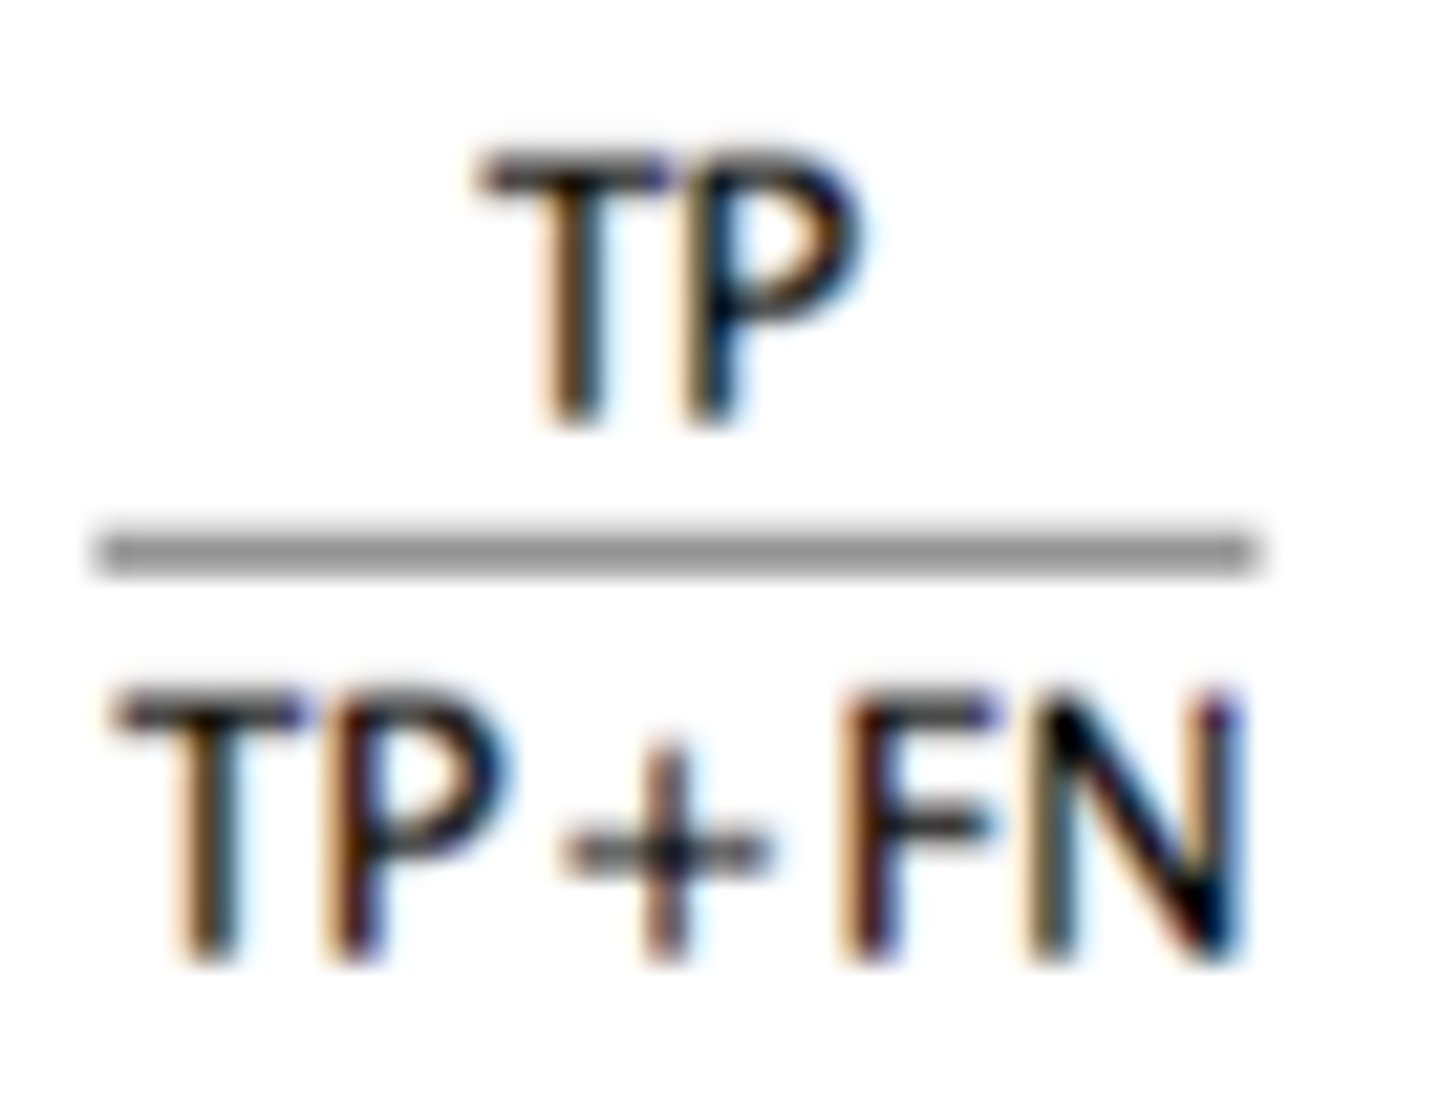
sensitivity
ability of a test to detect a given disease or condition when present
able to detect small quantities or changes in an analyte
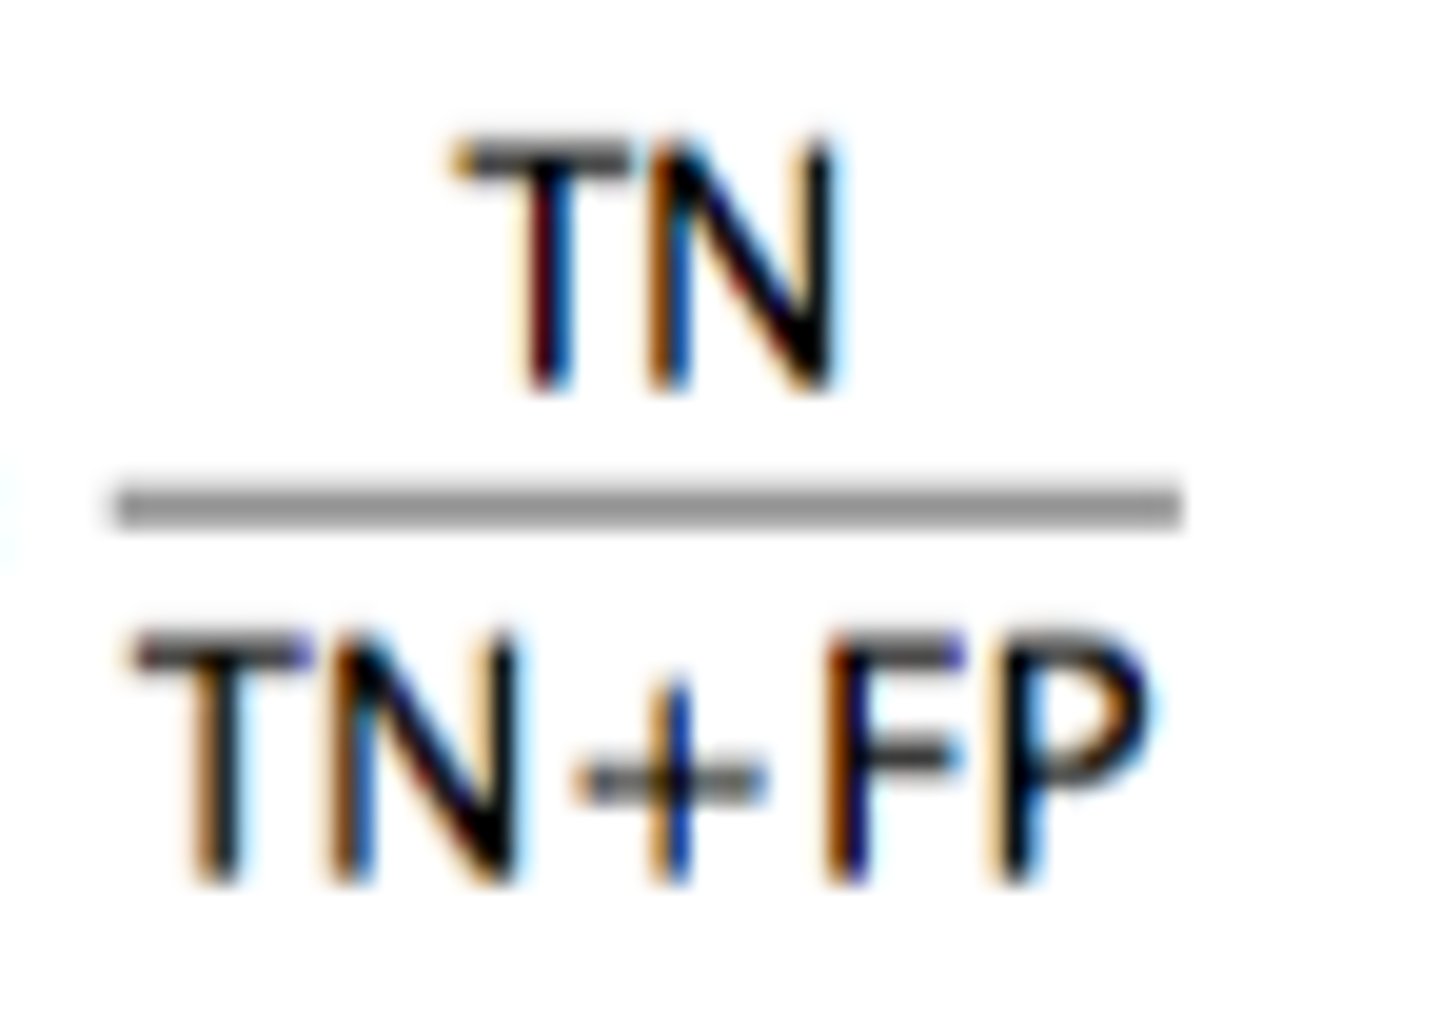
specificity
ability of a test to correctly identify individuals without a disease or condition
ability to only detect desired analyte (cross-reactivity with other substances)
sensitivity formula
specificity formula
positive predictive value
probability of the individual having the disease if the result is positive (abnormal)
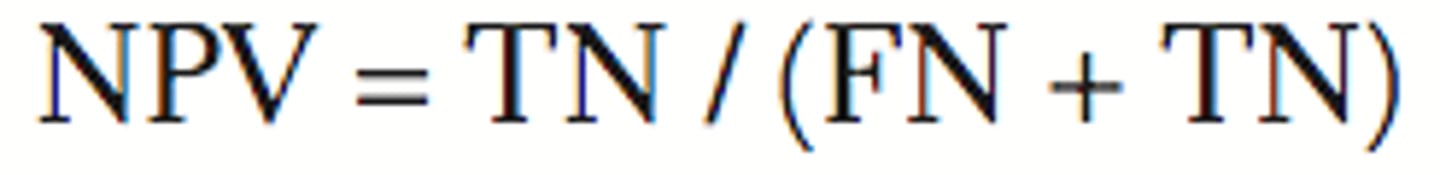
negative predictive value
probability of the individual not having the disease if the result is negative (normal)
positive predictive value formula

negative predictive value formula