AP & IB Economics Section 1.5 Theory of the Firm Graphs
1/21
There's no tags or description
Looks like no tags are added yet.
Name | Mastery | Learn | Test | Matching | Spaced | Call with Kai |
|---|
No analytics yet
Send a link to your students to track their progress
22 Terms
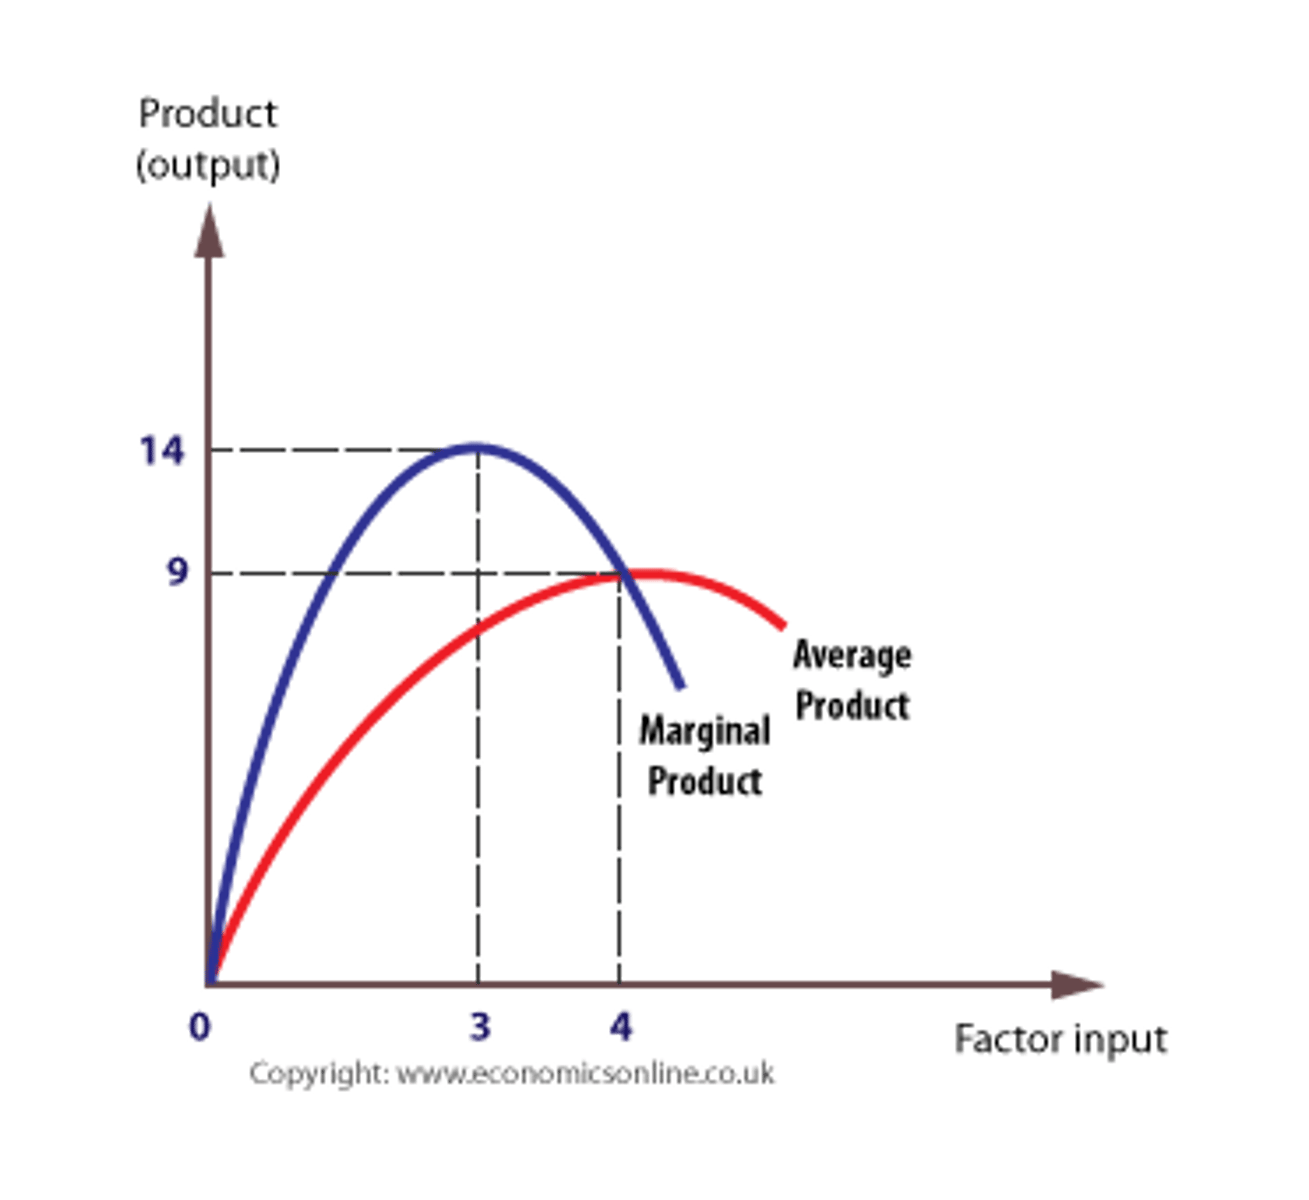
Product curves
With a small number of workers, output is low and a division of labor cannot be employed, and workers cannot specialize or develop new skills. However, marginal returns increase quickly as specialization occurs and efficiency increases. This creates the opportunity for labor to develop skills and become more productive.
Eventually, marginal returns diminish as the effects of specialization and new skills wear off. This pattern has a considerable impact on the firm's short-run cost curves.
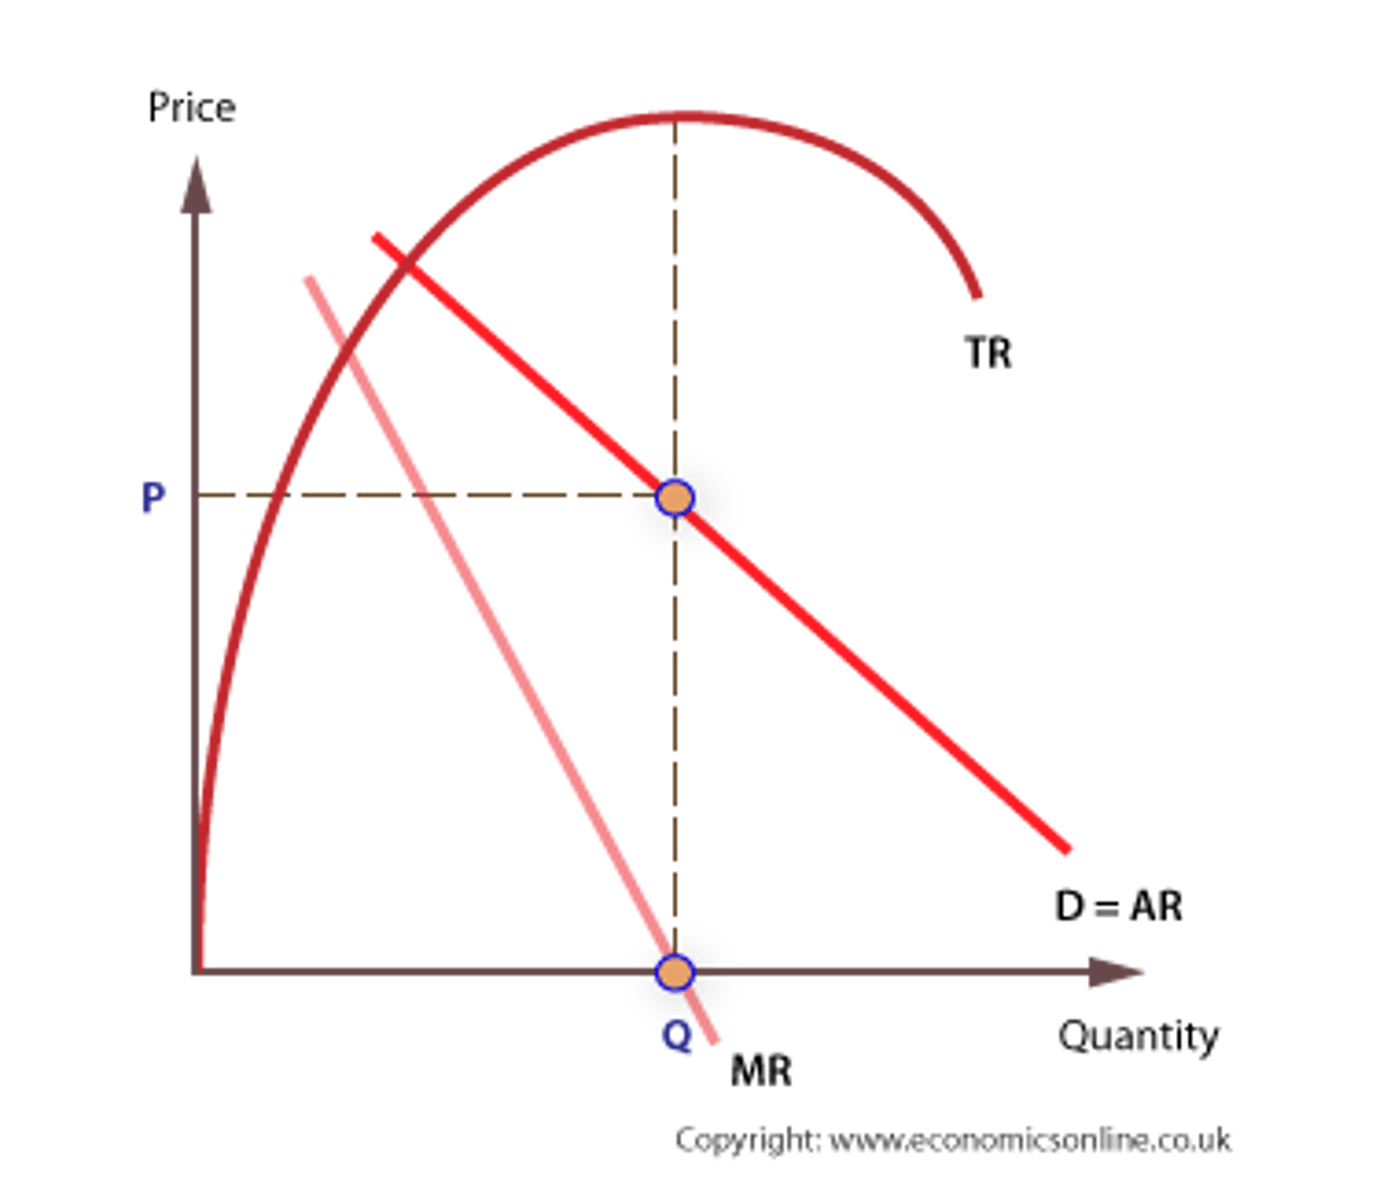
Revenue curves
Total revenue (TR), is the total flow of income to a firm from selling a given quantity of output at a given price, less tax going to the government. The value of TR is found by multiplying price of the product by the quantity sold.
Average revenue (AR), is revenue per unit, and is found by dividing TR by the quantity sold, Q. AR is equivalent to the price of the product, where P x Q/Q = P, hence AR is also price.
Marginal revenue (MR) is the revenue generated from selling one extra unit of a good or service. It can be found by finding the change in TR following an increase in output of one unit. MR can be both positive and negative.
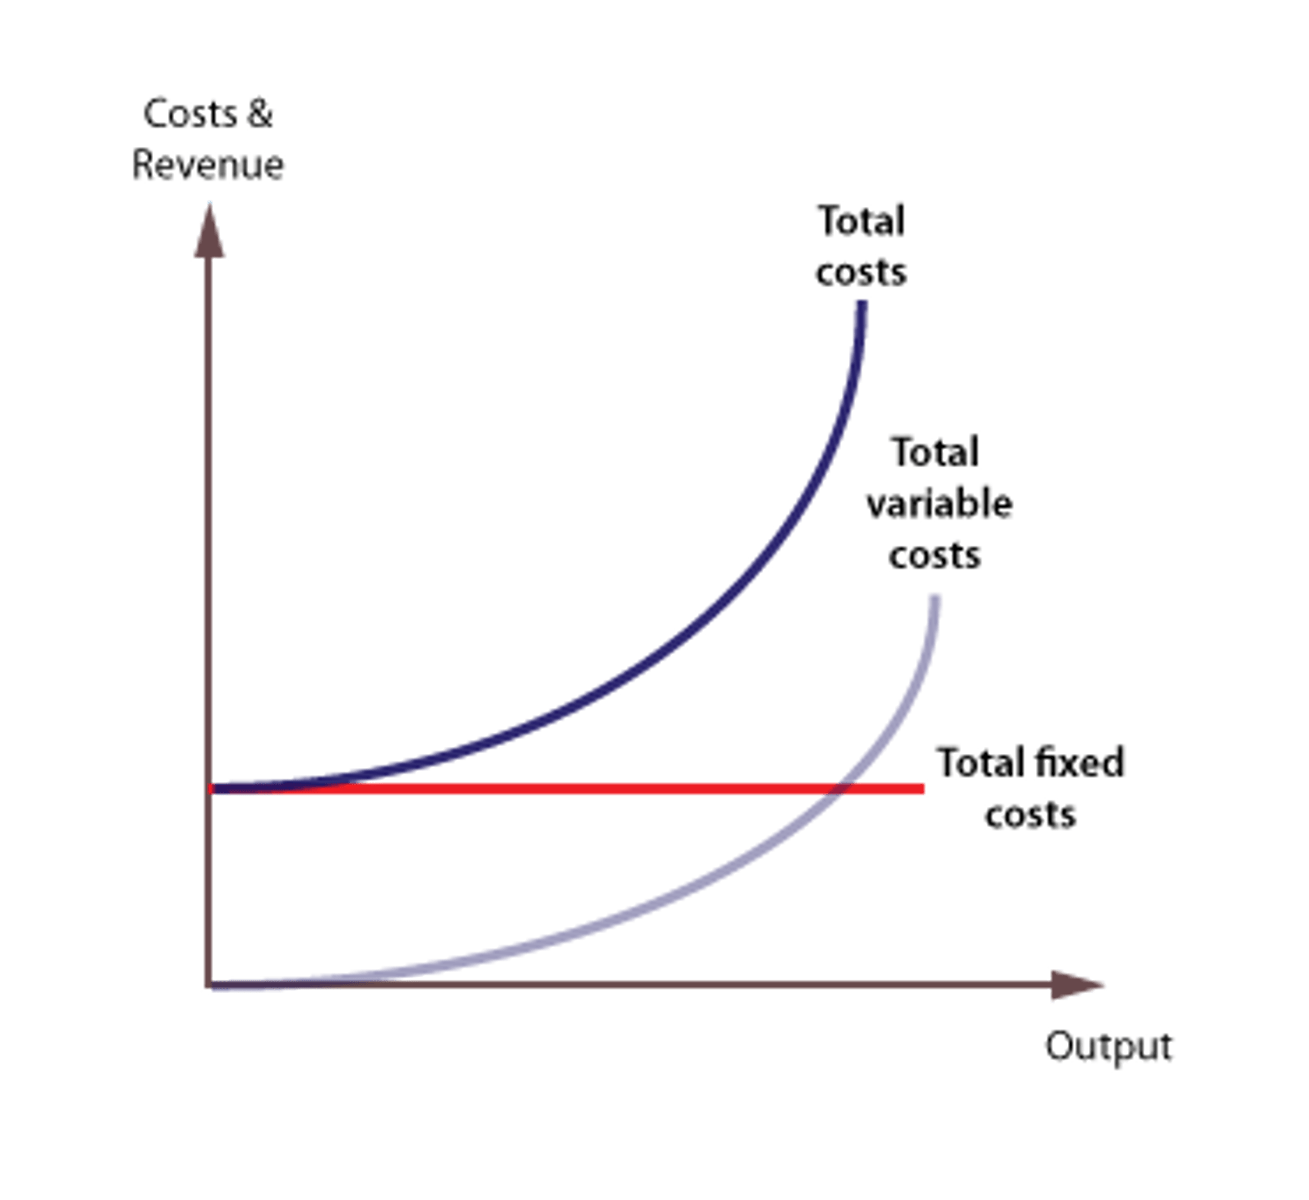
Total Cost Curves
Given that total fixed costs (TFC) are constant as output increases, the curve is a horizontal line on the cost graph.
The total variable cost (TVC) curve slopes up at an accelerating rate, reflecting the law of diminishing marginal returns.
The total cost (TC) curve is found by adding total fixed and total variable costs. Its position reflects the amount of fixed costs, and its gradient reflects variable costs.
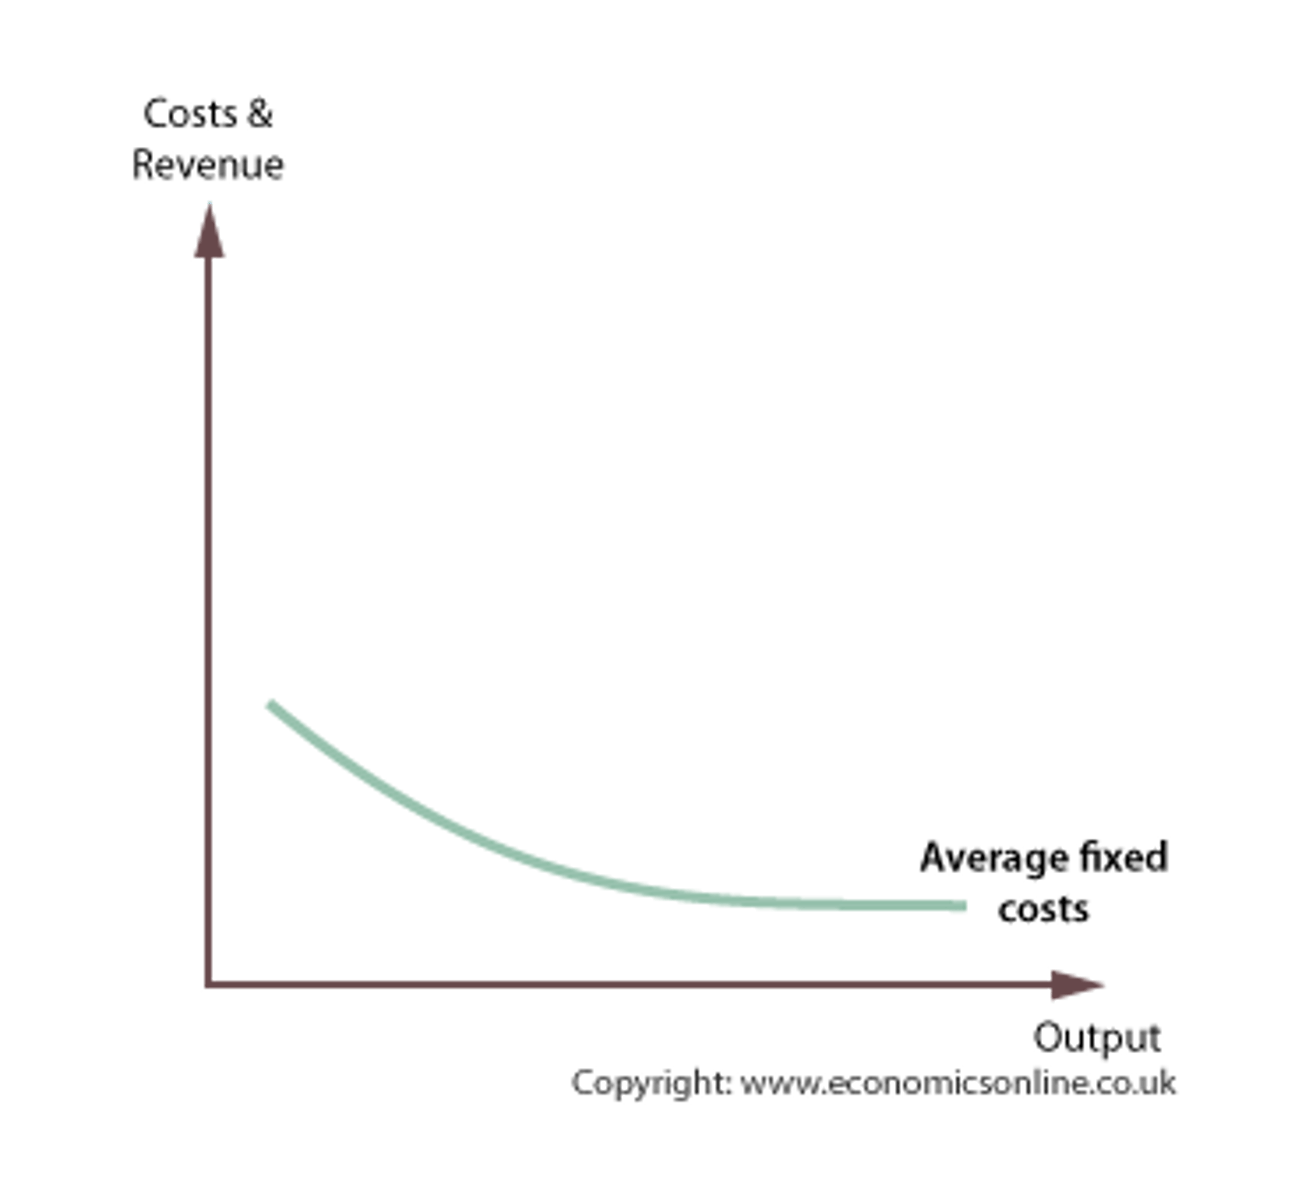
Average fixed costs
Average fixed costs are found by dividing total fixed costs by output. As fixed cost is divided by an increasing output, average fixed costs will continue to fall
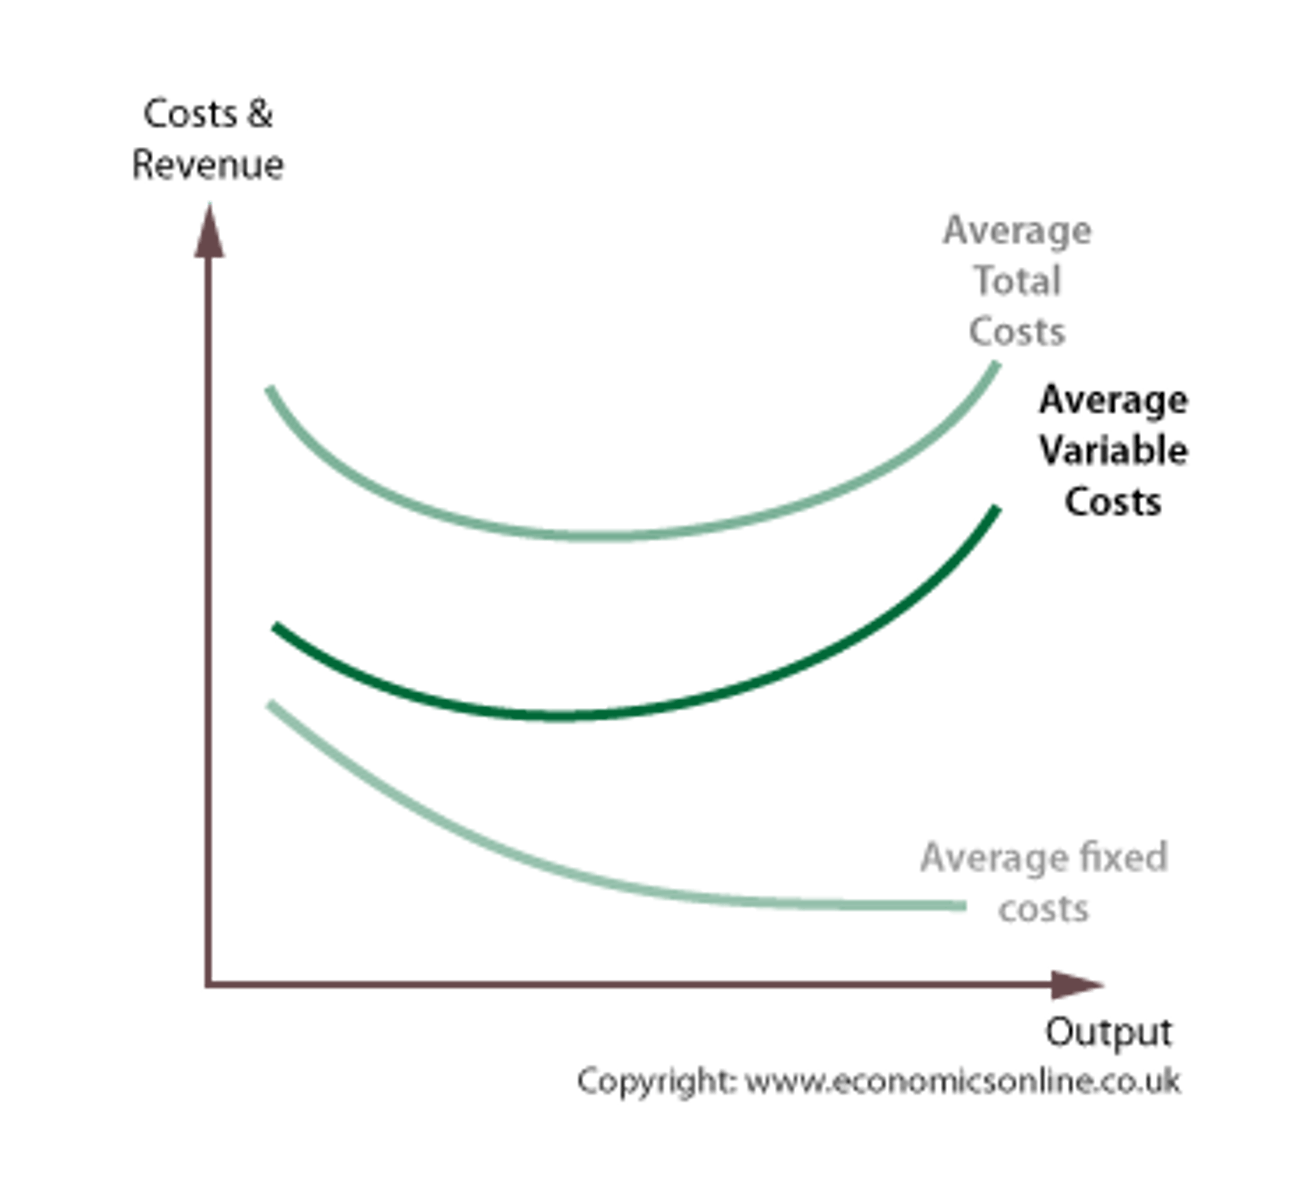
Average variable costs
Average variable costs are found by dividing total fixed variable costs by output.
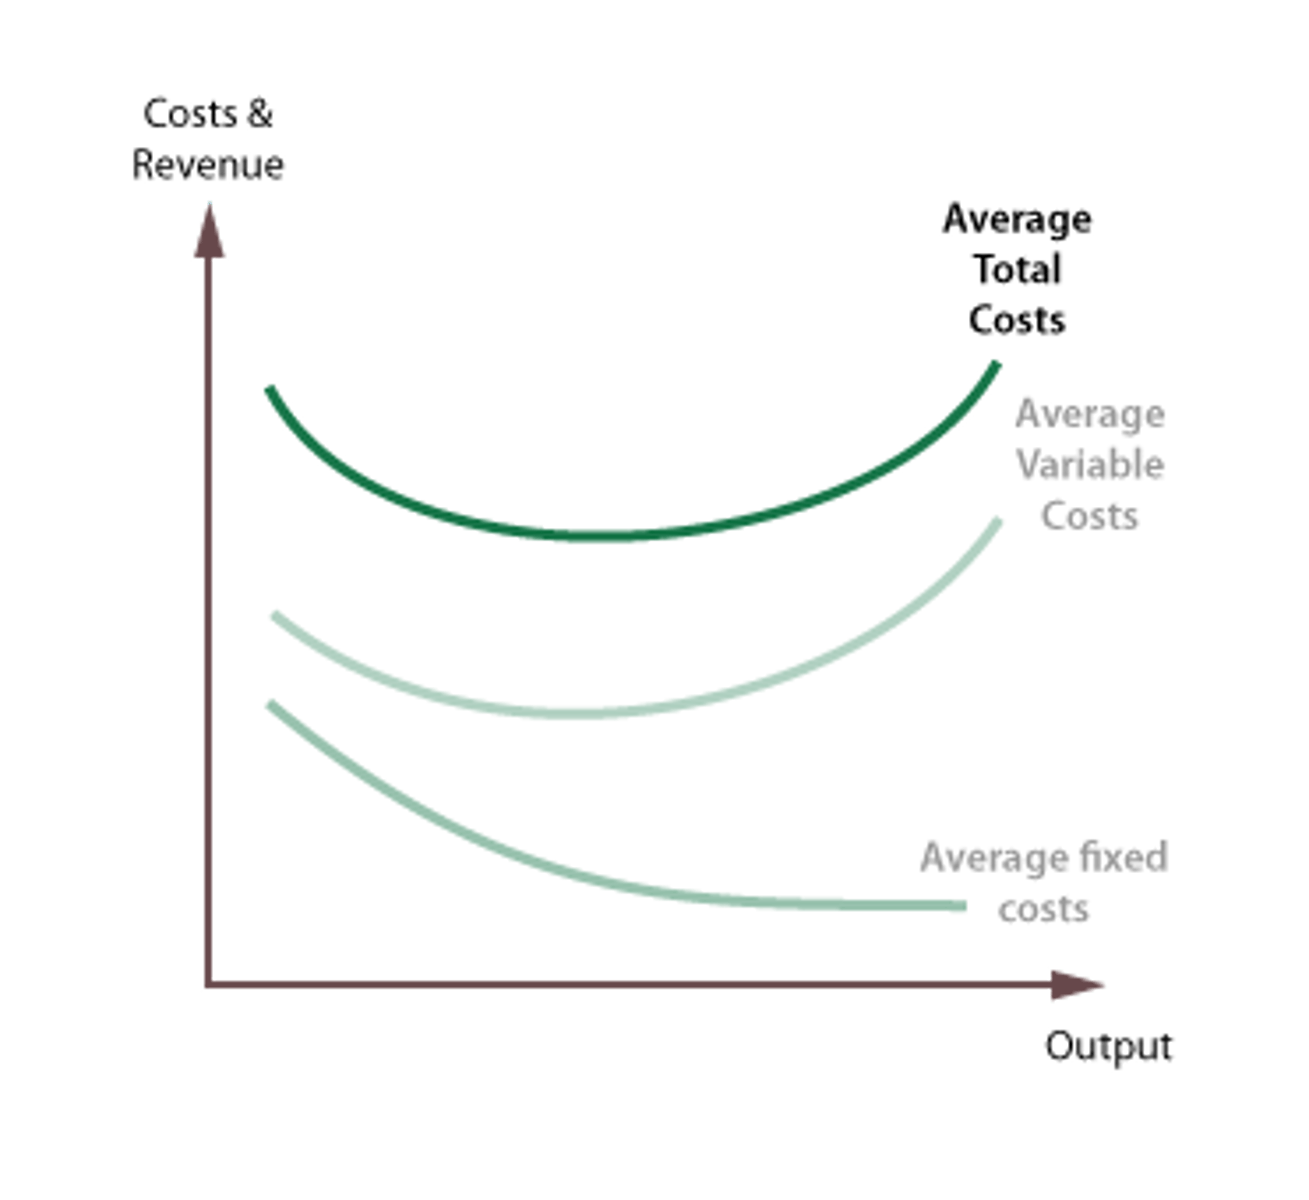
Average total cost
Average total cost (ATC) is also called average cost or unit cost. Average total costs are a key cost in the theory of the firm because they indicate how efficiently scarce resources are being used. Average variable costs are found by dividing total fixed variable costs by output.
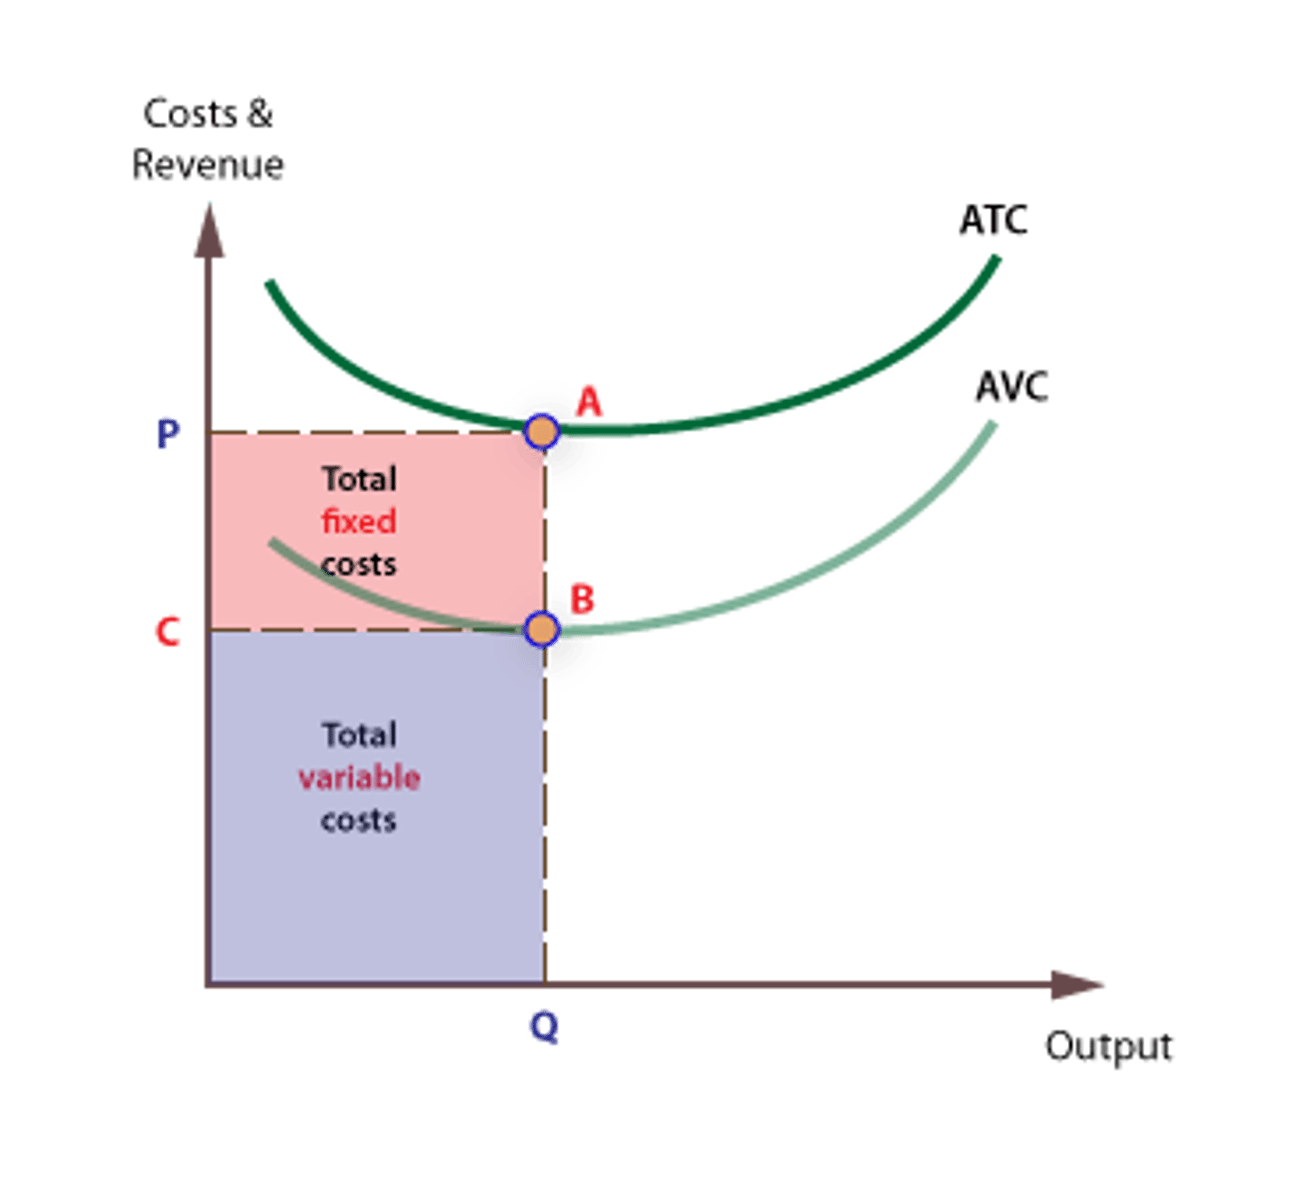
Areas for total costs
Total Fixed costs and Total Variable costs are the respective areas under the Average Fixed and Average Variable cost curves.
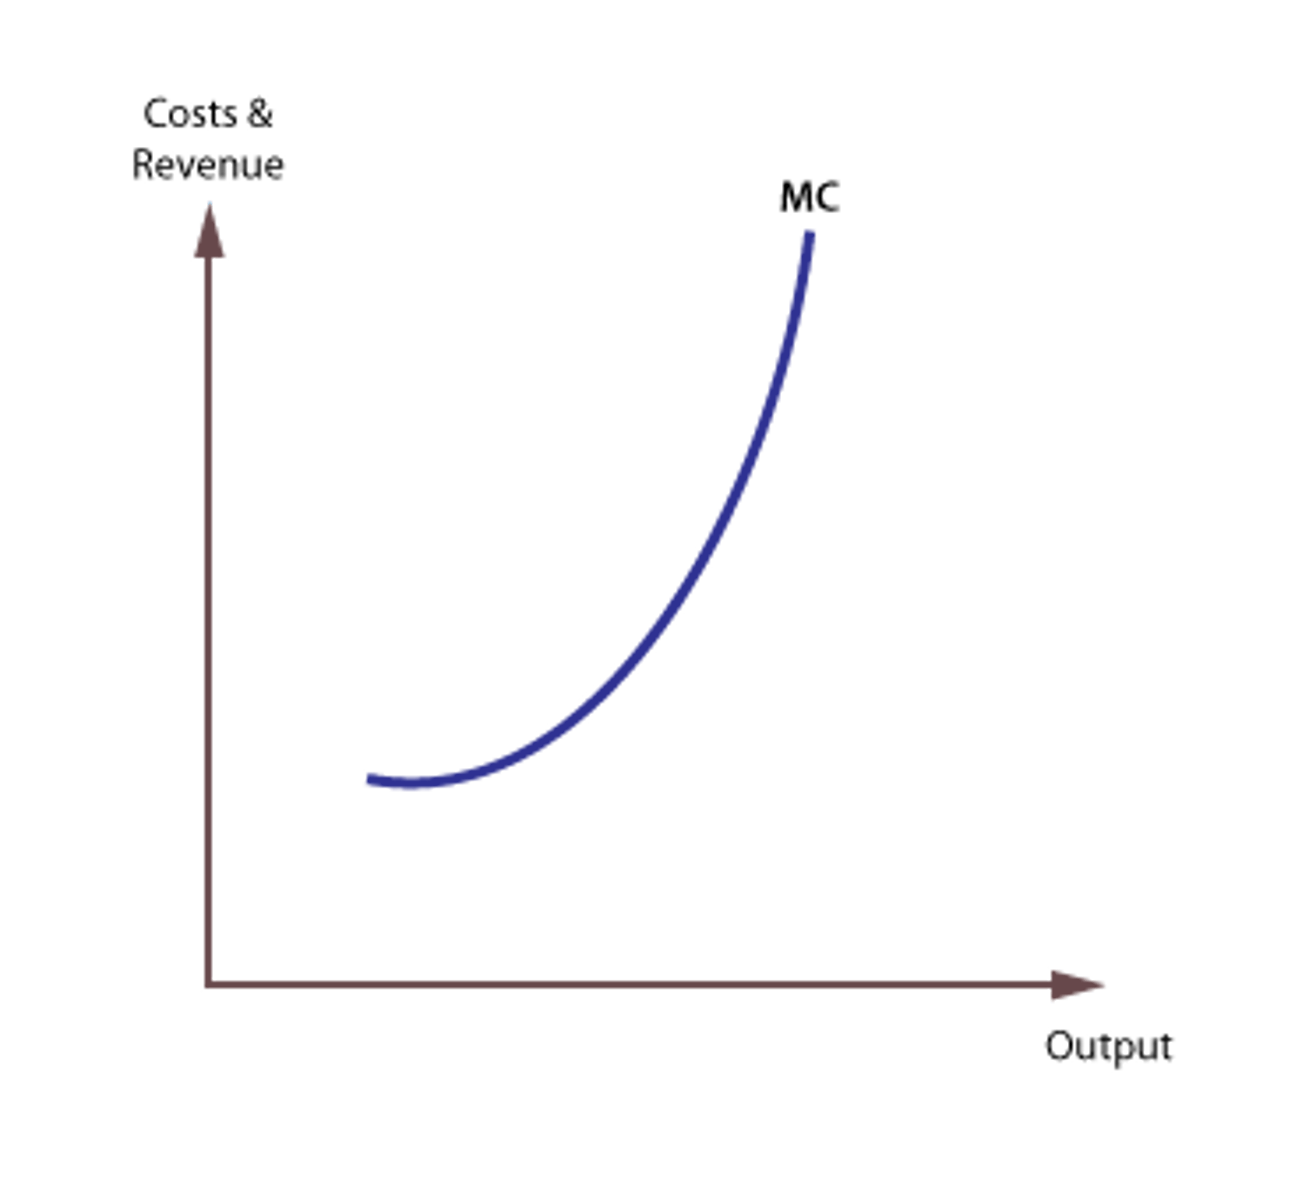
Marginal costs
Marginal cost is the cost of producing one extra unit of output. It can be found by calculating the change in total cost when output is increased by one unit.
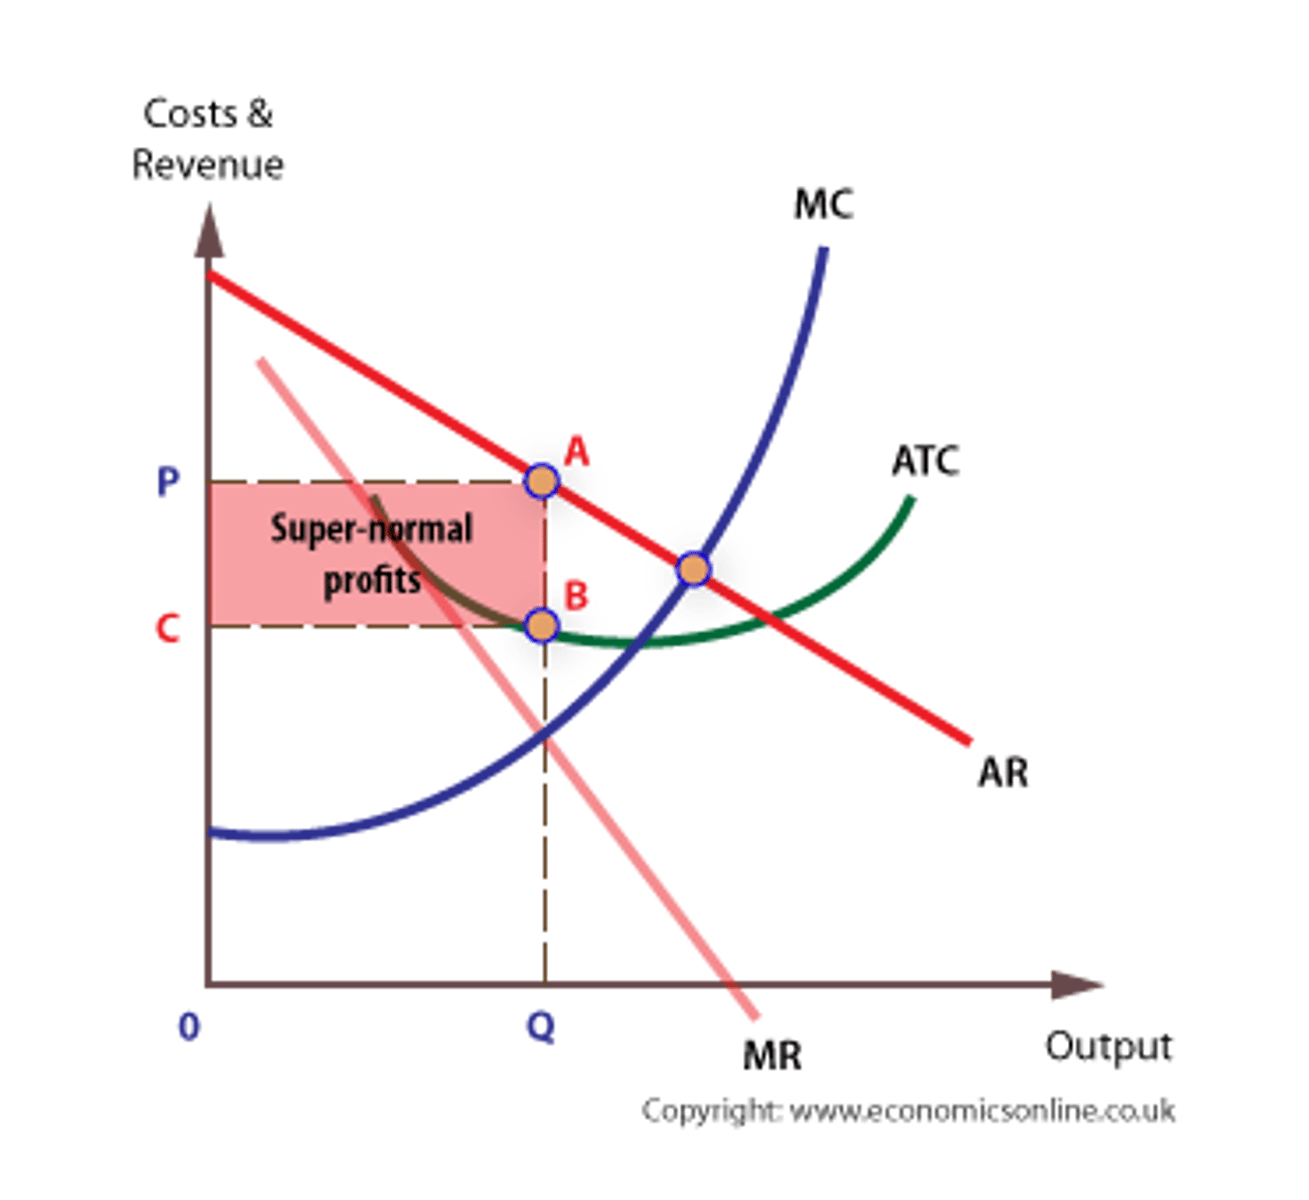
Profit maximization
Firms achieve maximum profits when marginal revenue (MR) is equal to marginal cost (MC), that is when the cost of producing one more unit of a good or service is exactly equal to the revenue derived from selling one extra unit.
Revenue maximization graph
The condition for revenue maximization is, therefore, to produce up to the point where MR = 0. This is also at the same level of output where PED = 1, namely at the mid-point of the average revenue/demand curve.
Sales maximization graph
Sales maximization means achieving the highest possible sales volume, without making a loss. To the right of Q, the firm will make a loss, and to the left of Q sales are not maximized.
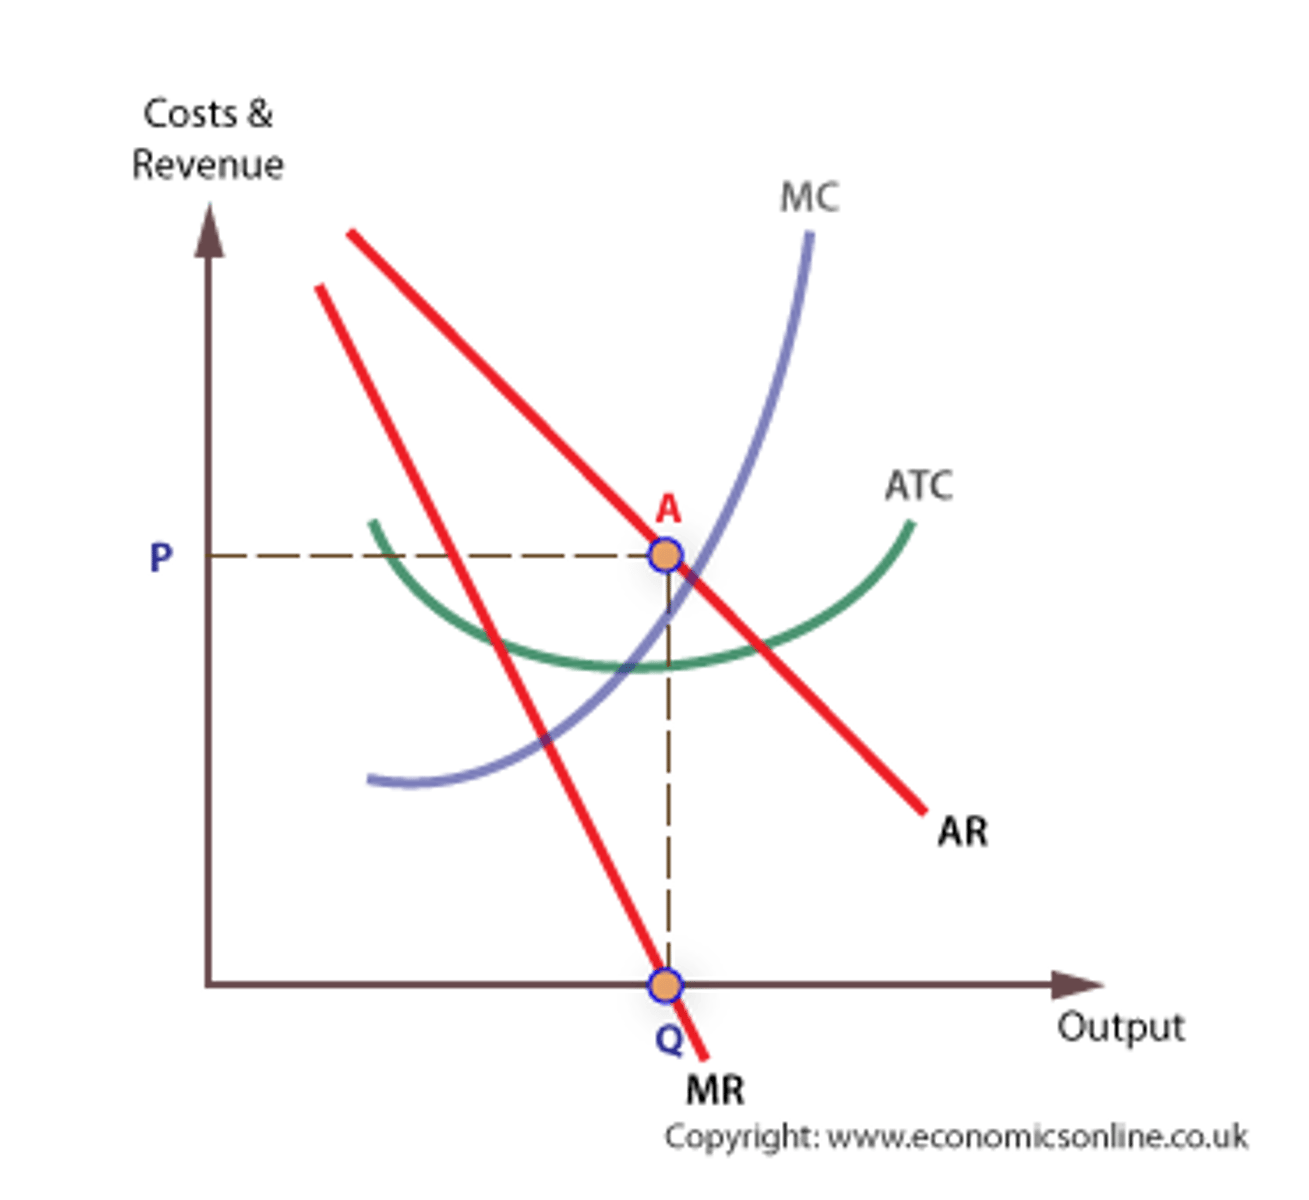
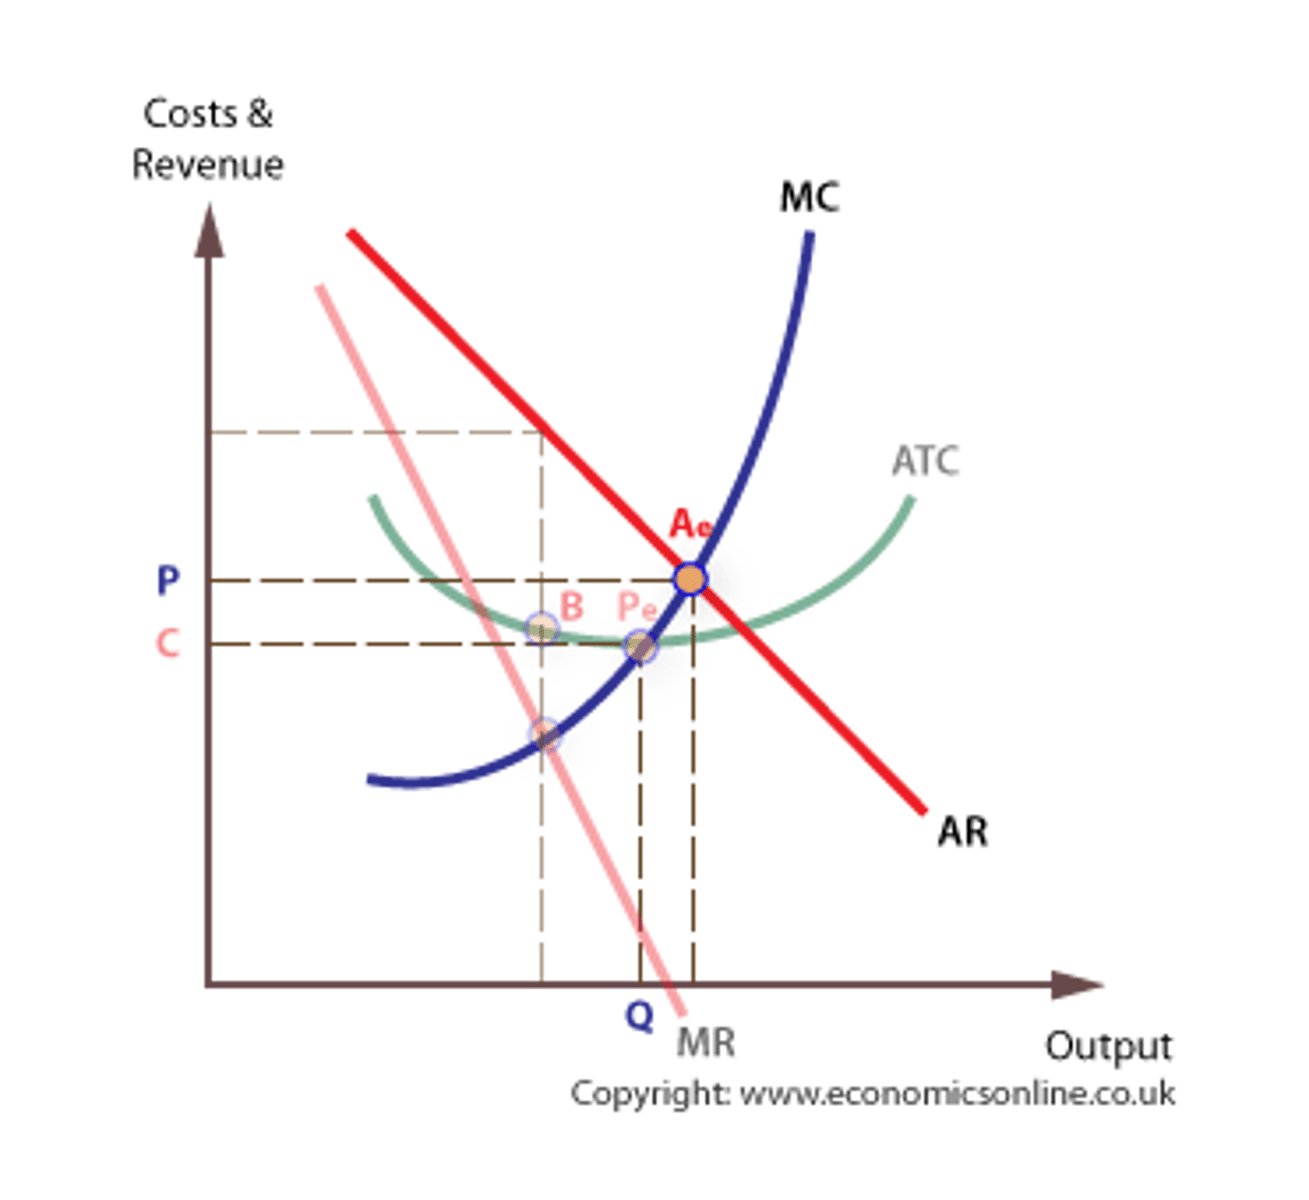
Allocative efficiency
Allocative efficiency occurs when consumers pay a market price that reflects the private marginal cost of production. The condition for allocative efficiency for a firm is to produce an output where marginal cost, MC, just equals price, P.
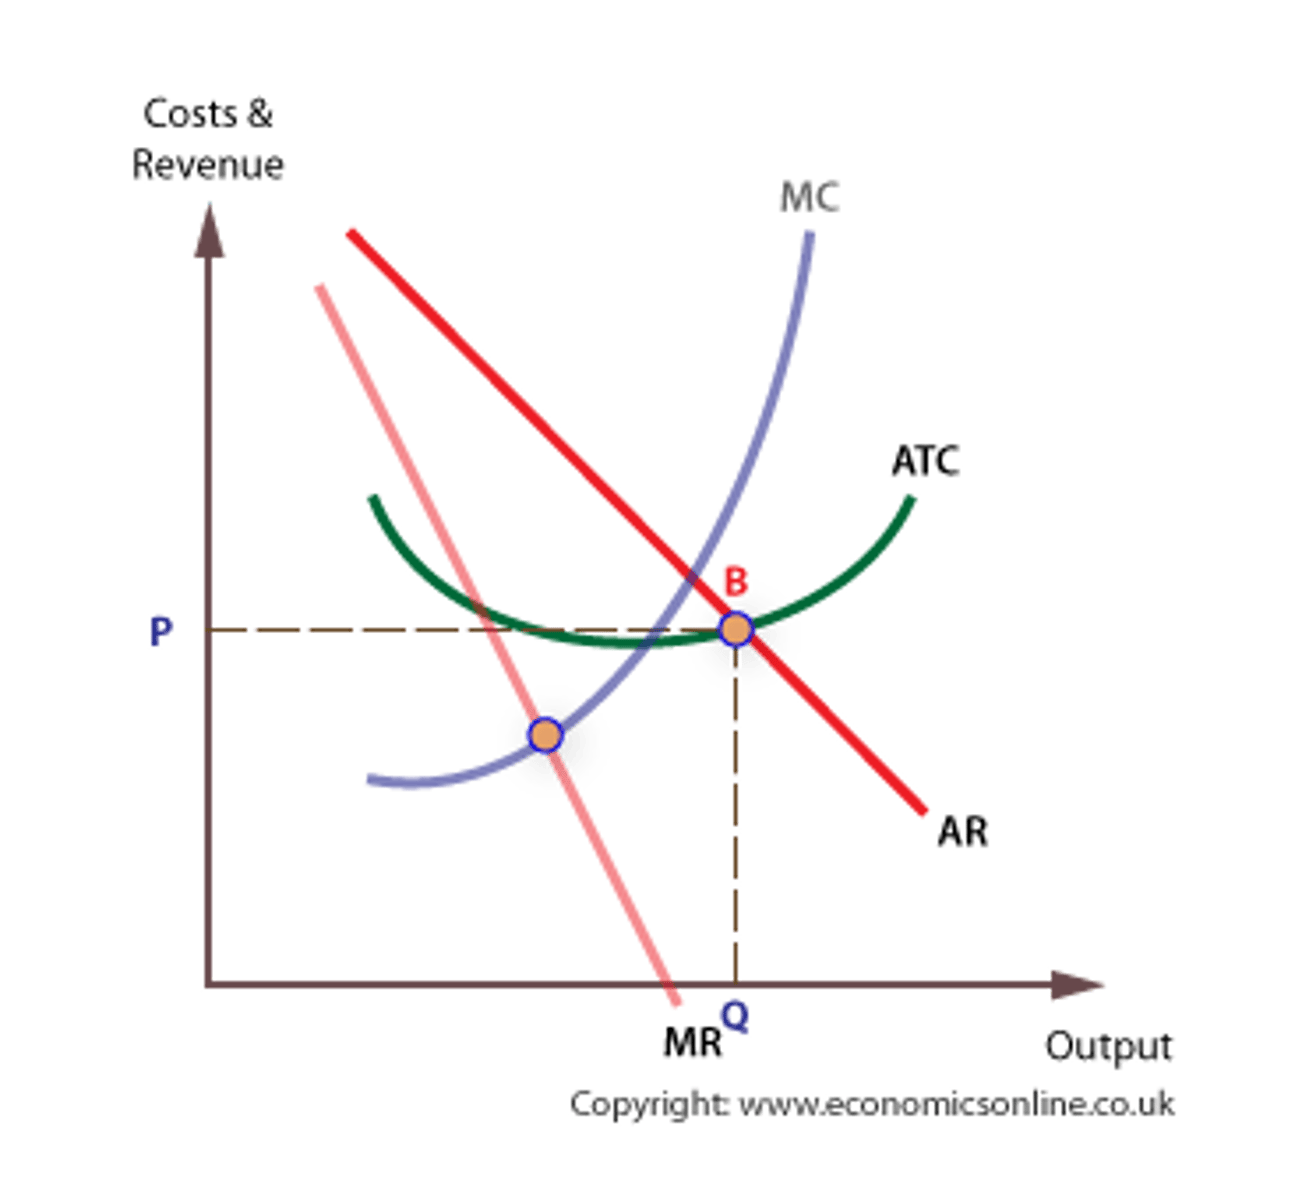
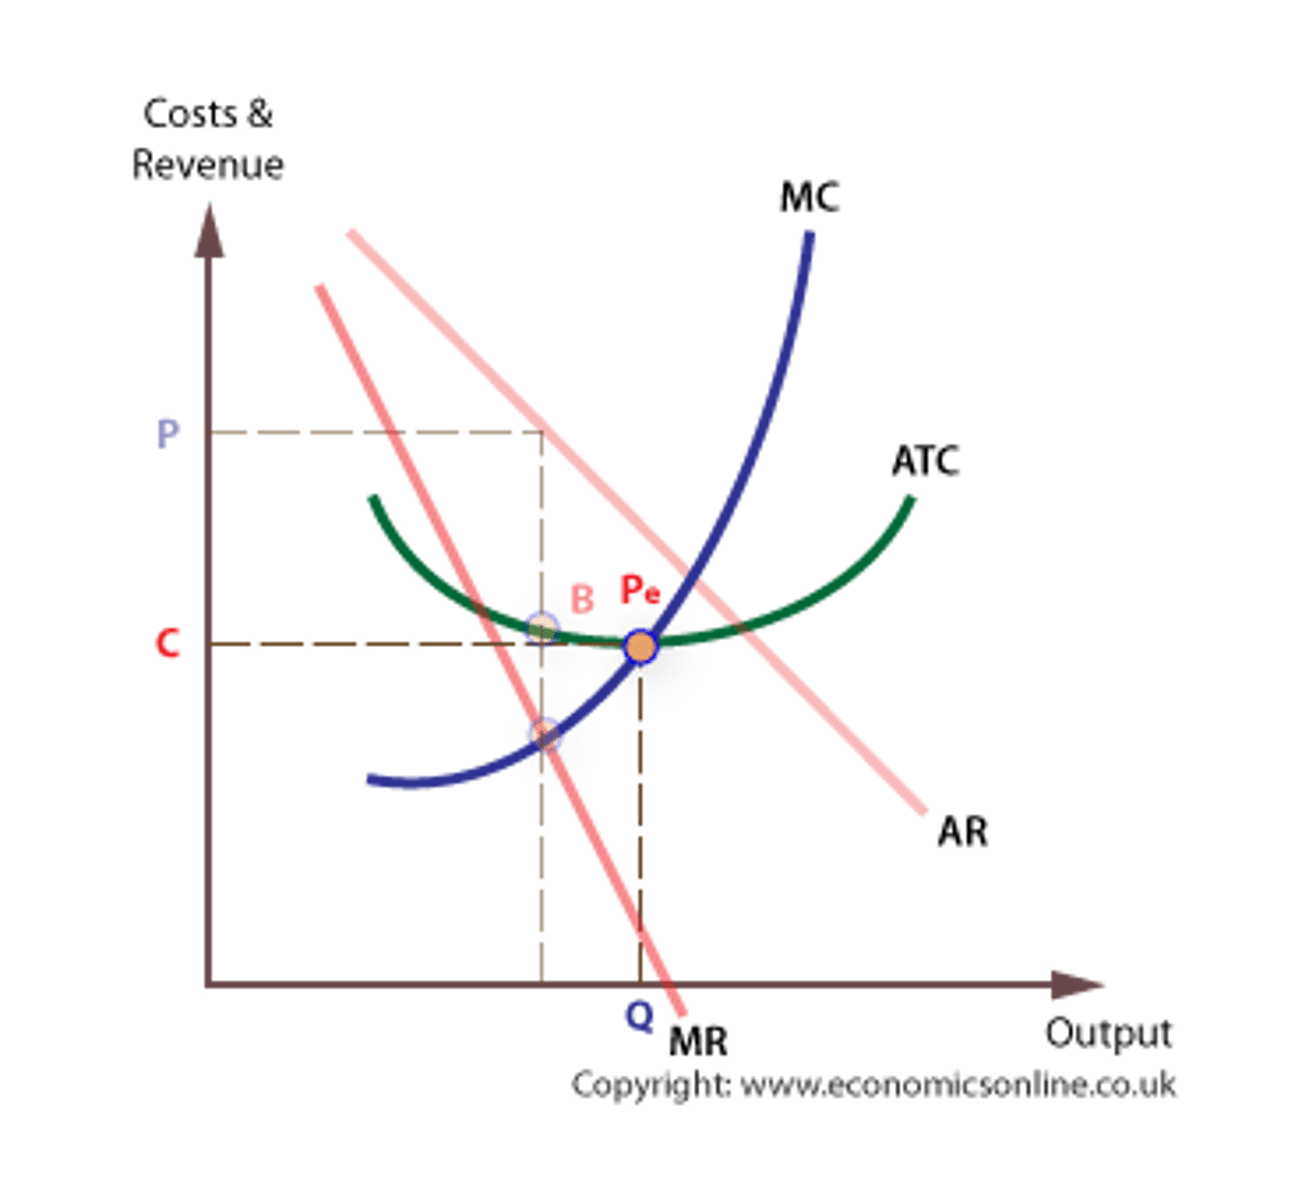
Productive efficiency
Productive efficiency occurs when a firm is combining resources in such a way as to produce a given output at the lowest possible average total cost. Costs will be minimized at the lowest point on a firm's short run average total cost curve.
This also means that ATC = MC, because MC always cuts ATC at the lowest point on the ATC curve.
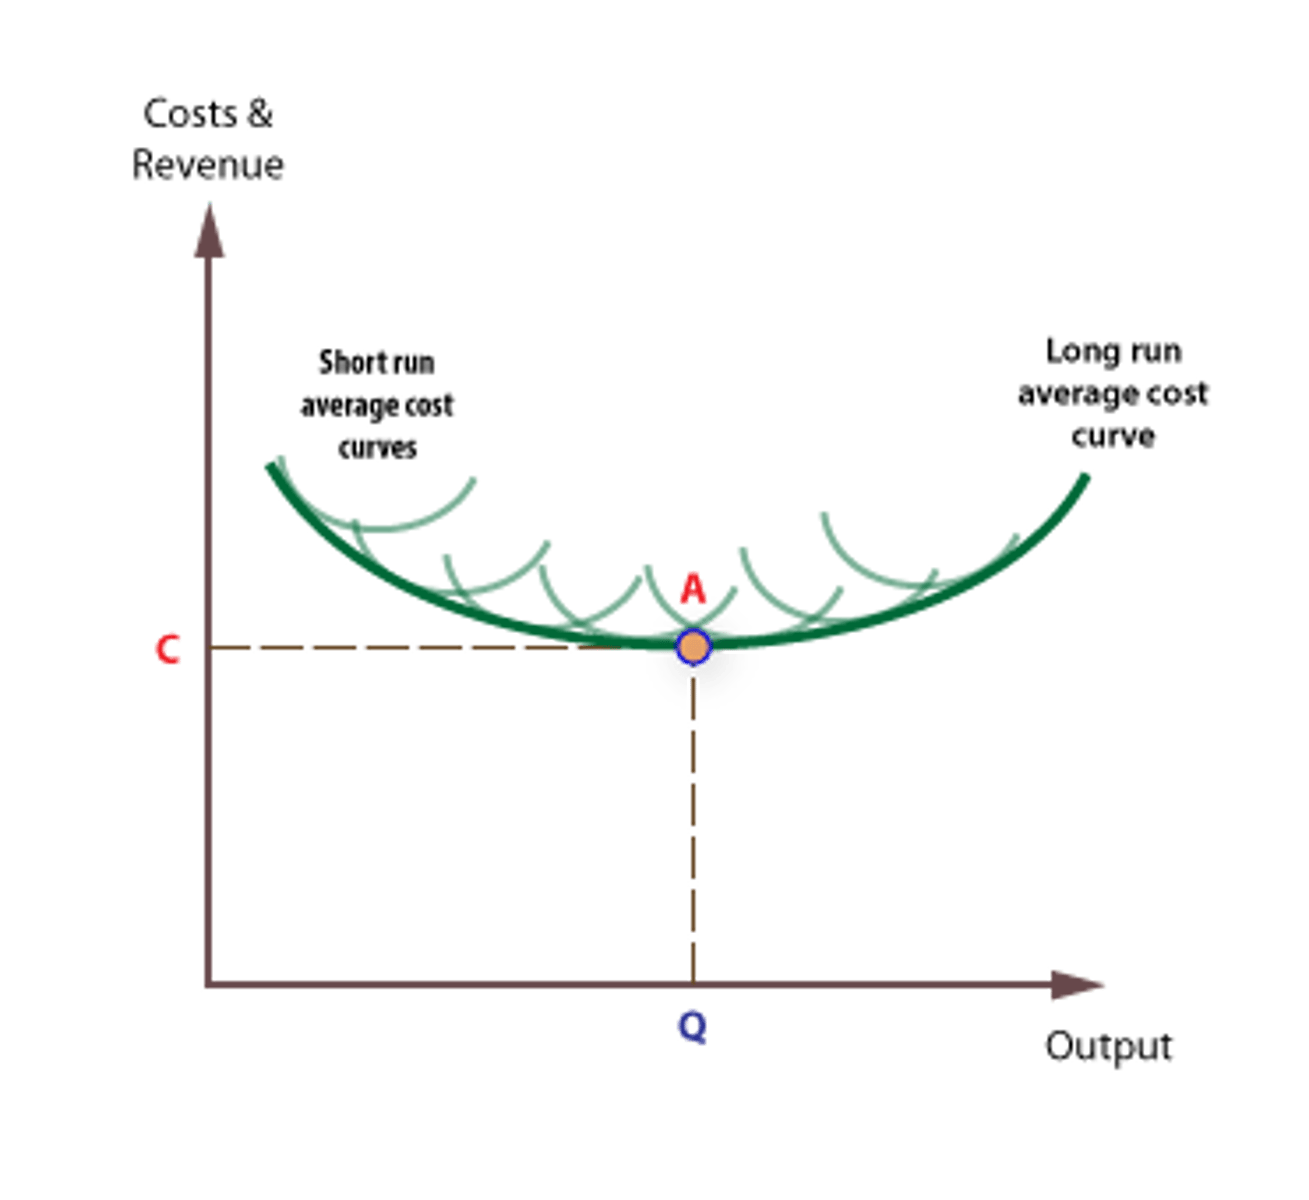
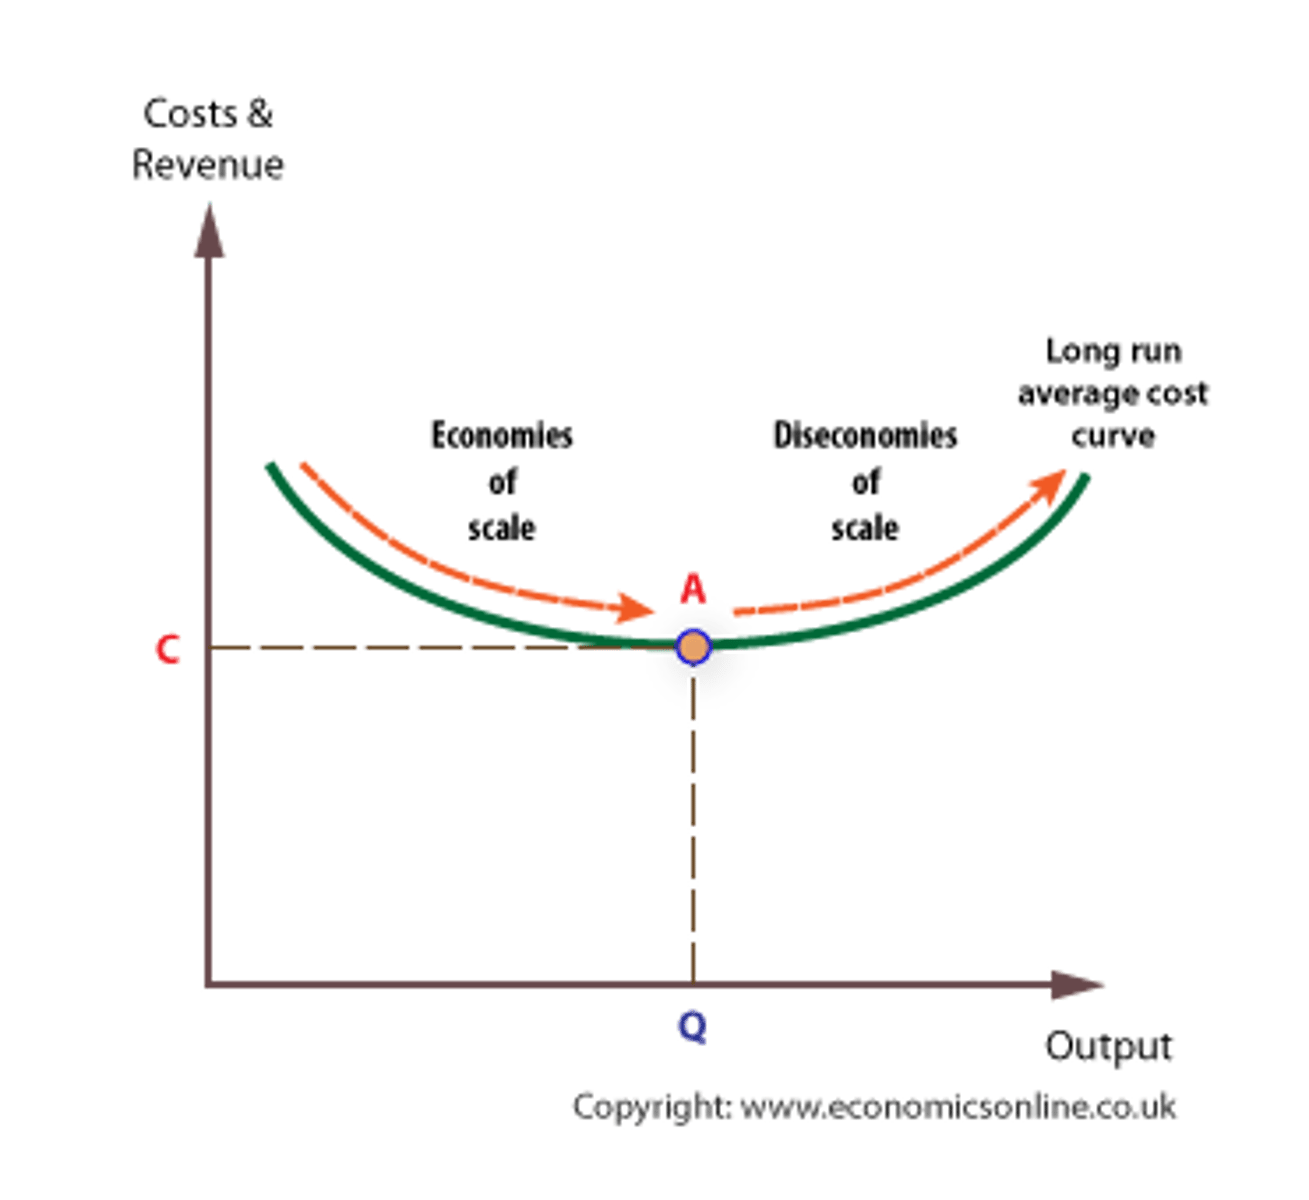
Long run costs
The firm's long run average cost shows what is happening to average cost when the firm expands, and is at a tangent to the series of short run average cost curves. Each short run average cost curve relates to a separate stage or phase of expansion.
Internal economies and dis economies
Internal economies and dis economies of scale are associated with the expansion of a single firm.
The long run cost curve for most firms is assumed to be 'U' shaped, because of the impact of internal economies and dis economies of scale.

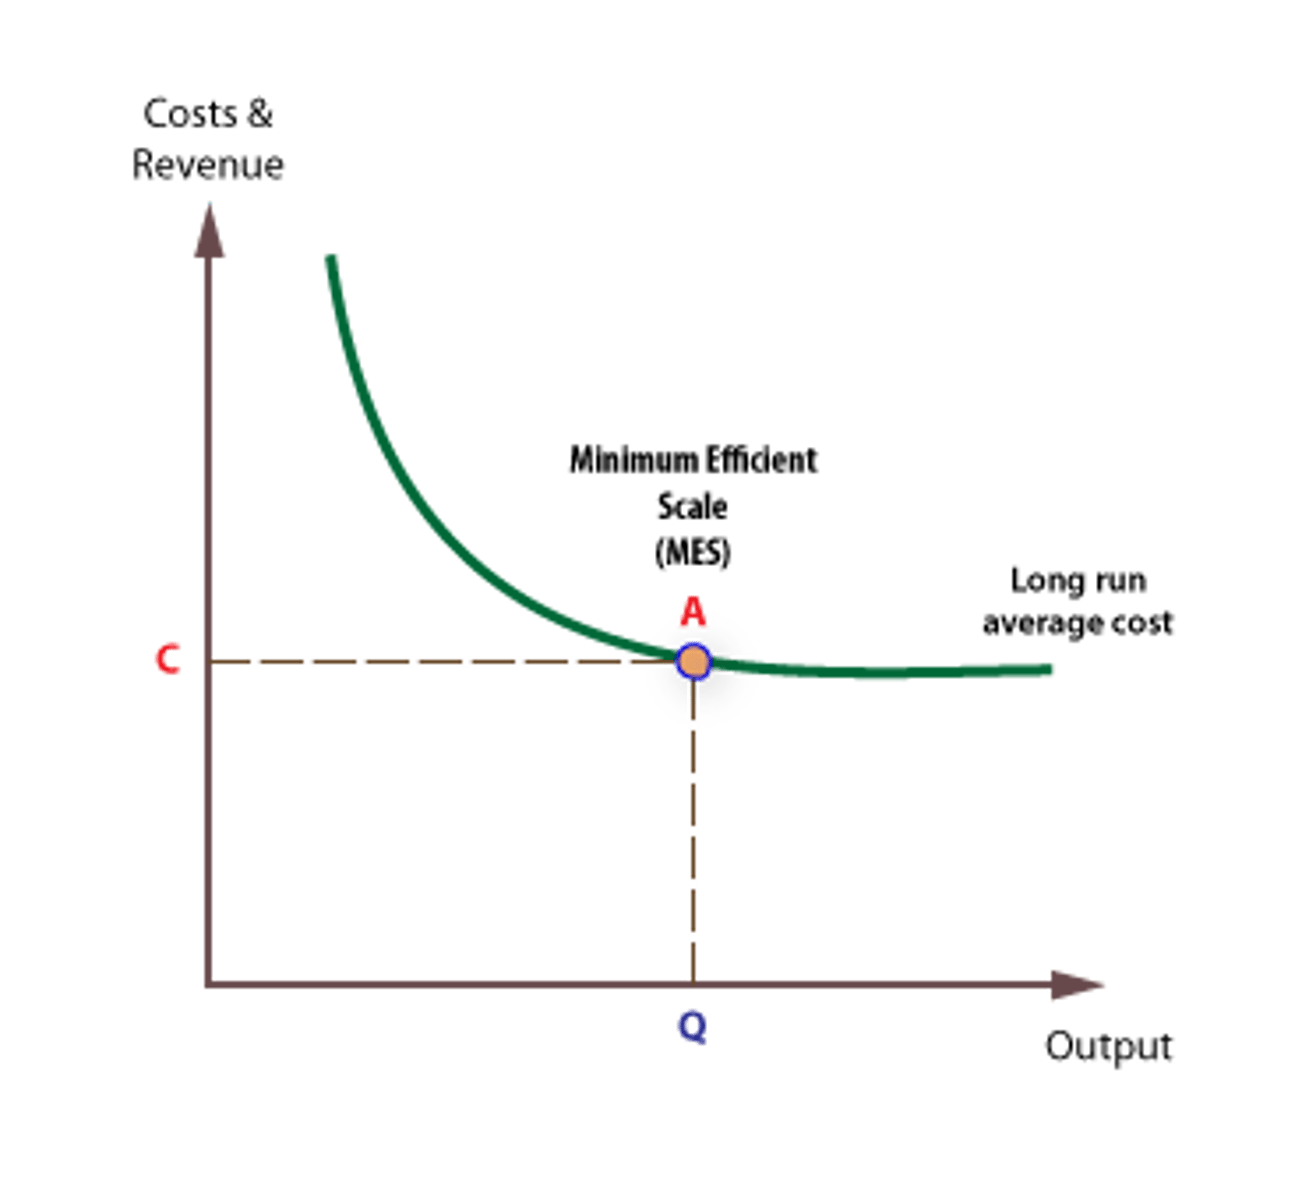
Minimum Efficient Scale
A firm's minimum efficient scale (MES) is the lowest scale necessary to achieve the economies of scale required to operate efficiently and competitively in its industry. No further significant economies of scale can be achieved beyond this scale.
Dis economies of scale
Economic theory predicts that a firm may become less efficient if it becomes too large. The additional costs of becoming too large are called dis economies of scale.
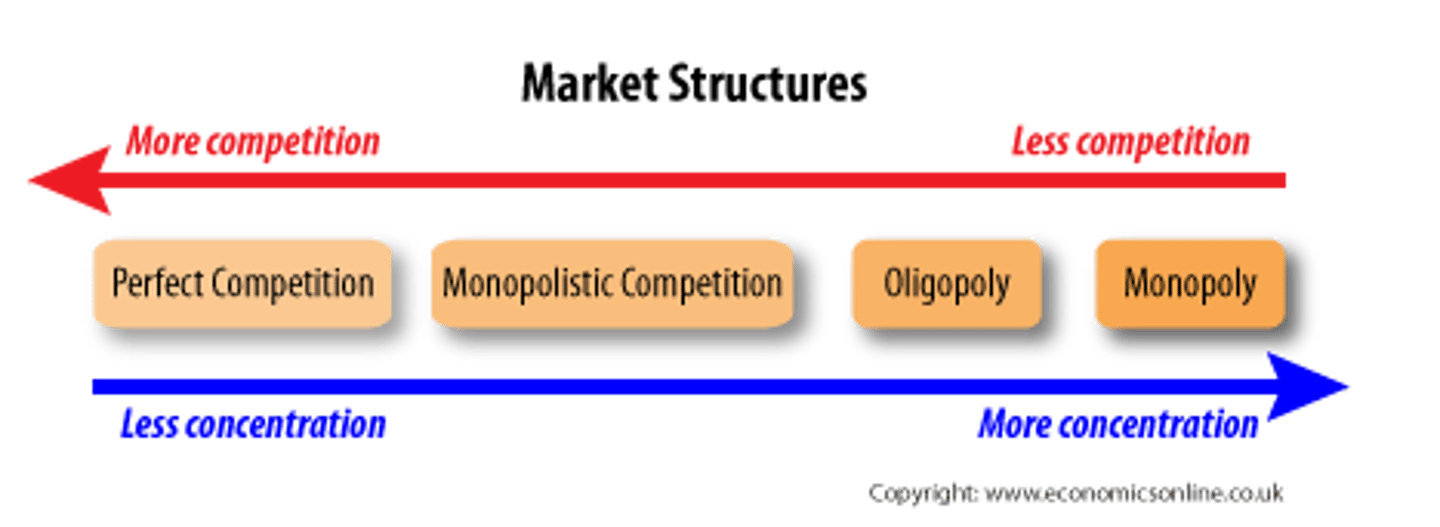
Market structures
Structures are classified in term of the presence or absence of competition. When competition is absent, the market is said to be concentrated. There is a spectrum, from perfect competition to pure monopoly.
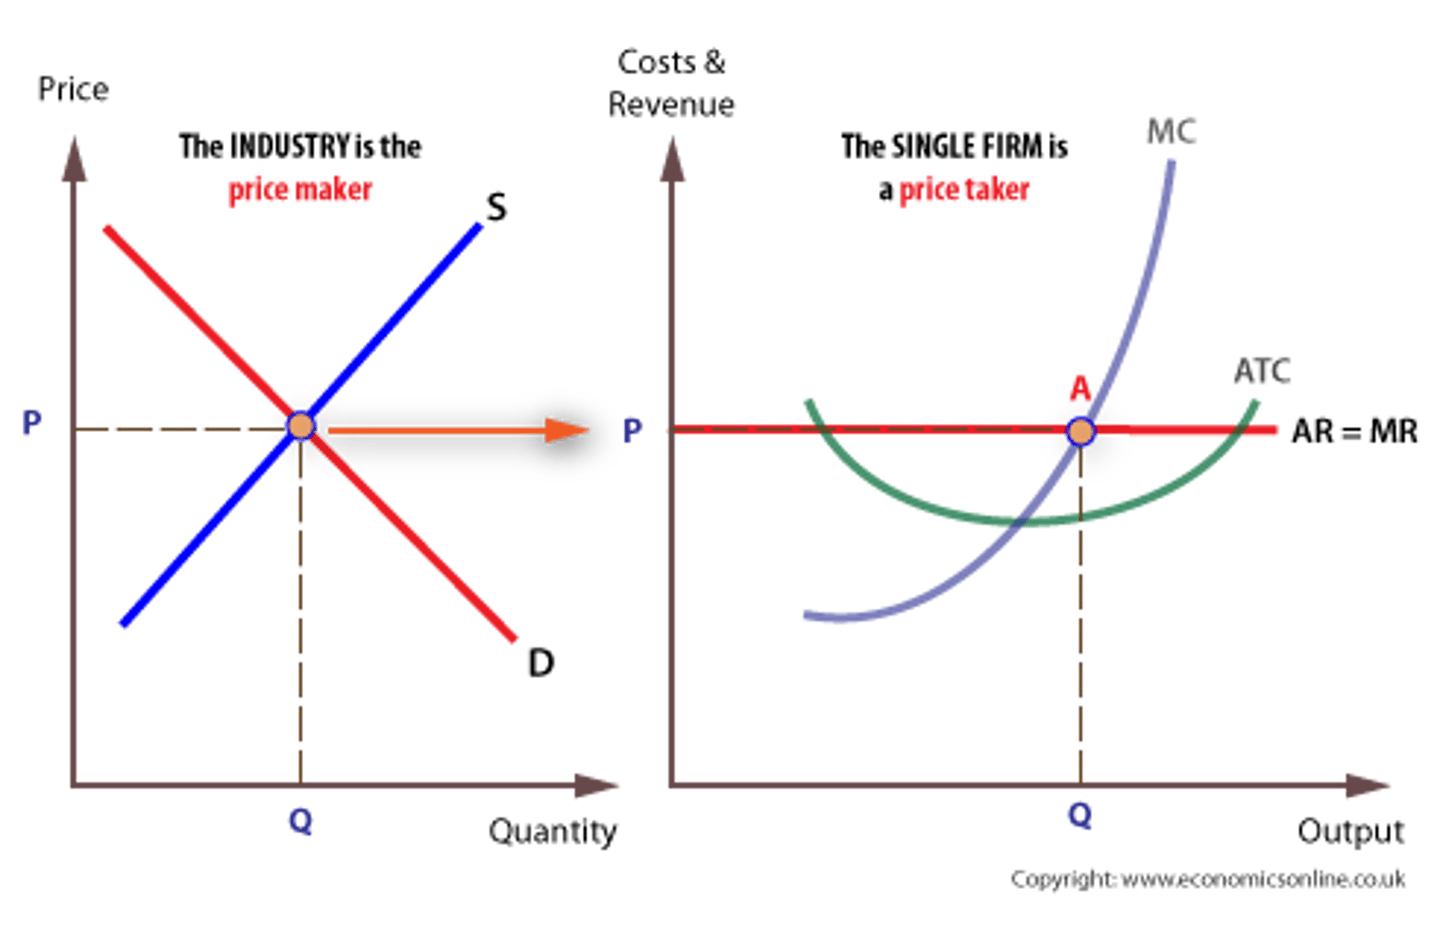
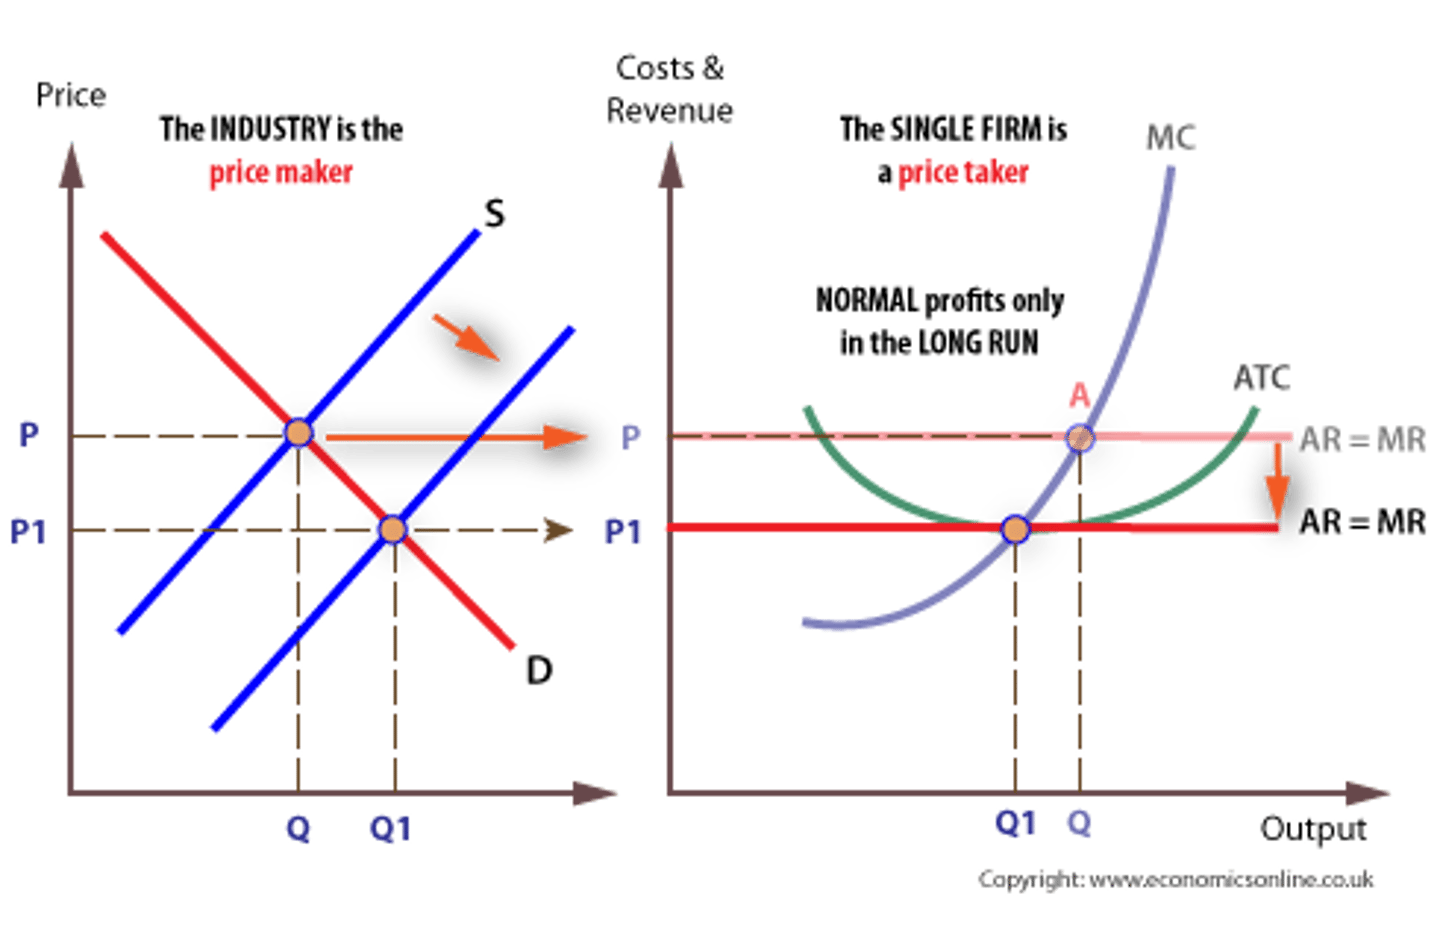
The firm as price taker
The single firm takes its price from the industry, and is, consequently, referred to as a price taker. The industry is composed of all firms in the industry and the market price is where market demand is equal to market supply. Each single firm must charge this price and cannot diverge from it.
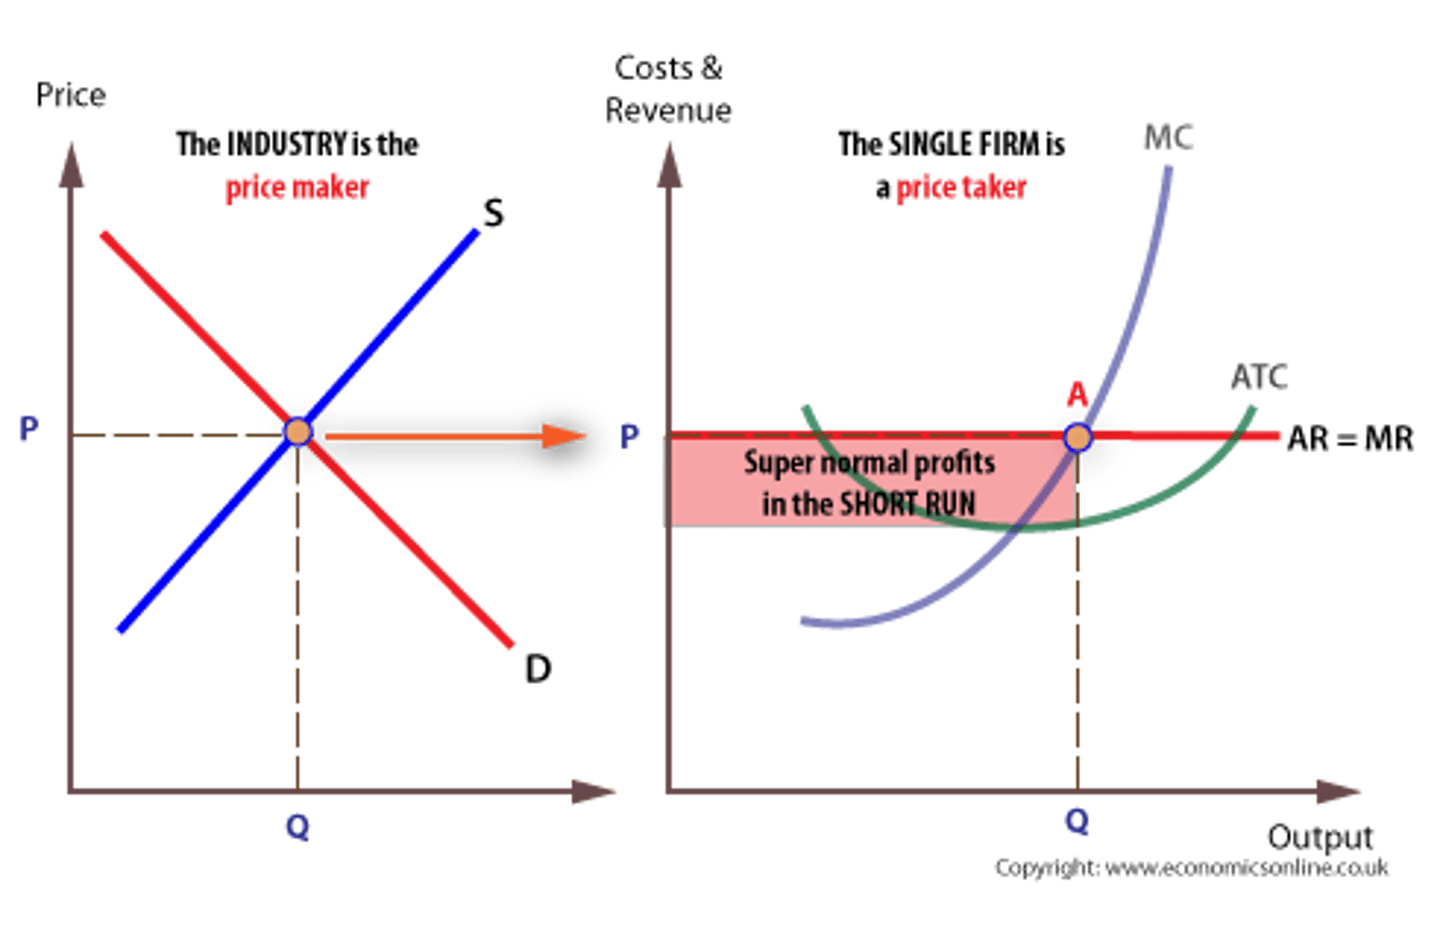
Equilibrium in perfect competition
In the short run under perfect competition, firms can make super-normal profits or losses.
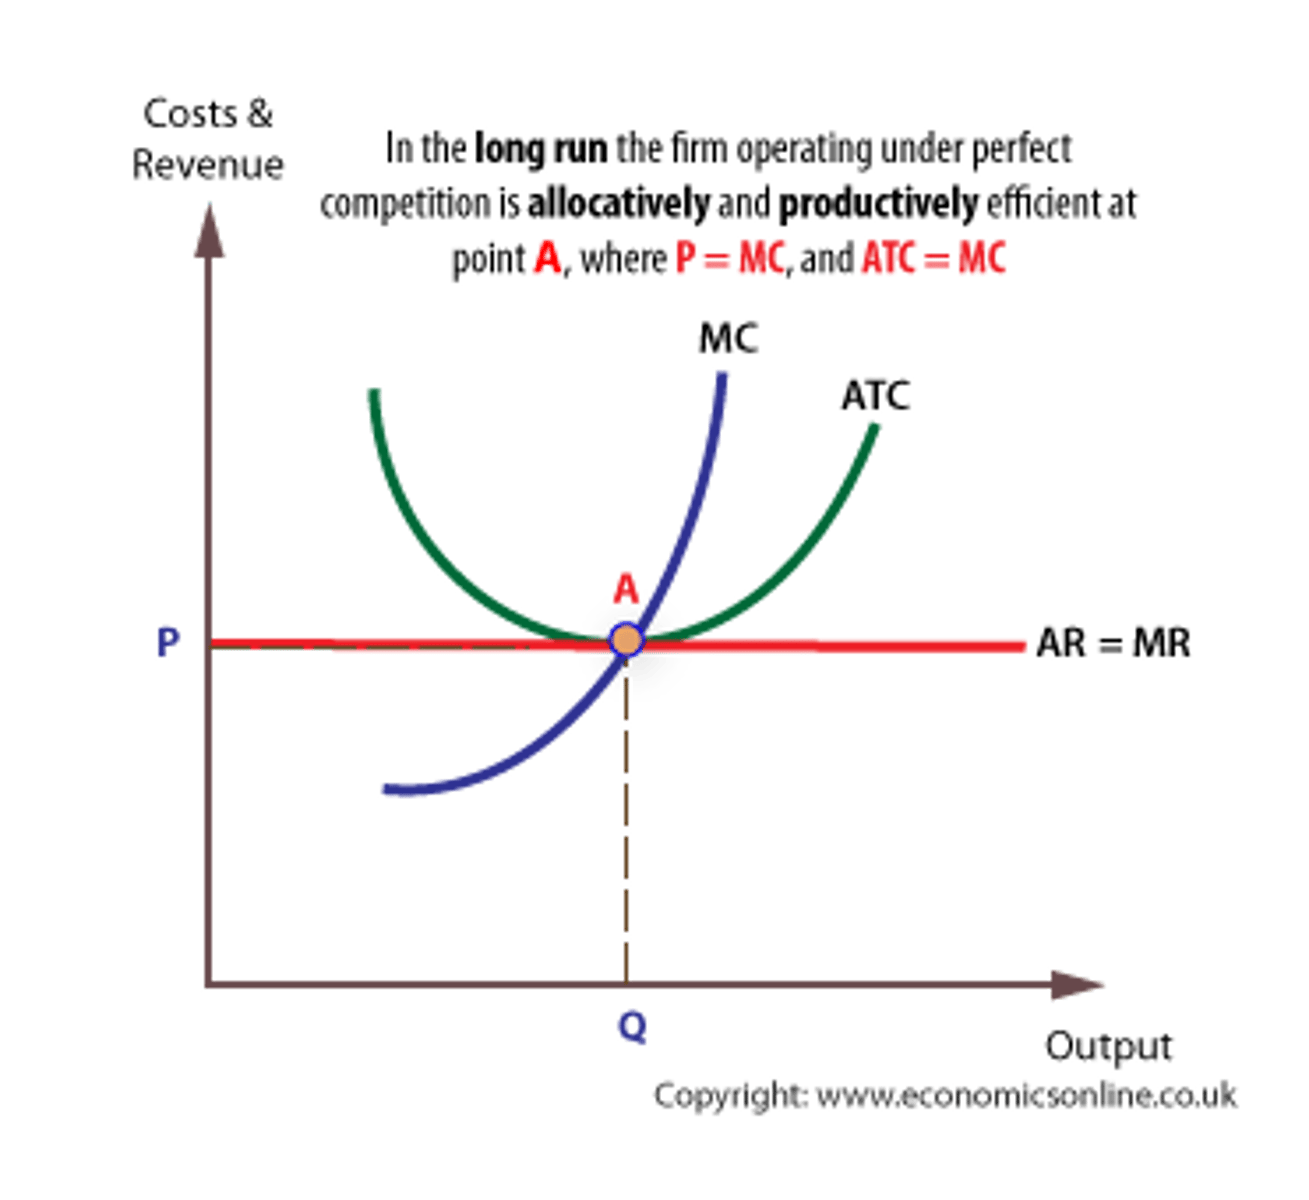
Perfect Competition in the long run
However, in the long run firms are attracted into the industry if the incumbent firms are making supernormal profits. This is because there are no barriers to entry and because there is perfect knowledge. The effect of this entry into the industry is to shift the industry supply curve to the right, which drives down price until the point where all super-normal profits are exhausted. If firms are making losses, they will leave the market as there are no exit barriers, and this will shift the industry supply to the left, which raises price and enables those left in the market to derive normal profits.
Perfect Competition and Efficiency
There is maximum allocative and productive efficiency: Equilibrium will occur where P = MC, hence allocative efficiency. In the long run equilibrium will occur at output where MC = ATC, which is productive efficiency.