Year 12 ATAR Economics - Updated
1/261
There's no tags or description
Looks like no tags are added yet.
Name | Mastery | Learn | Test | Matching | Spaced |
|---|
No study sessions yet.
262 Terms
Economic growth.
Unemployment.
Inflation.
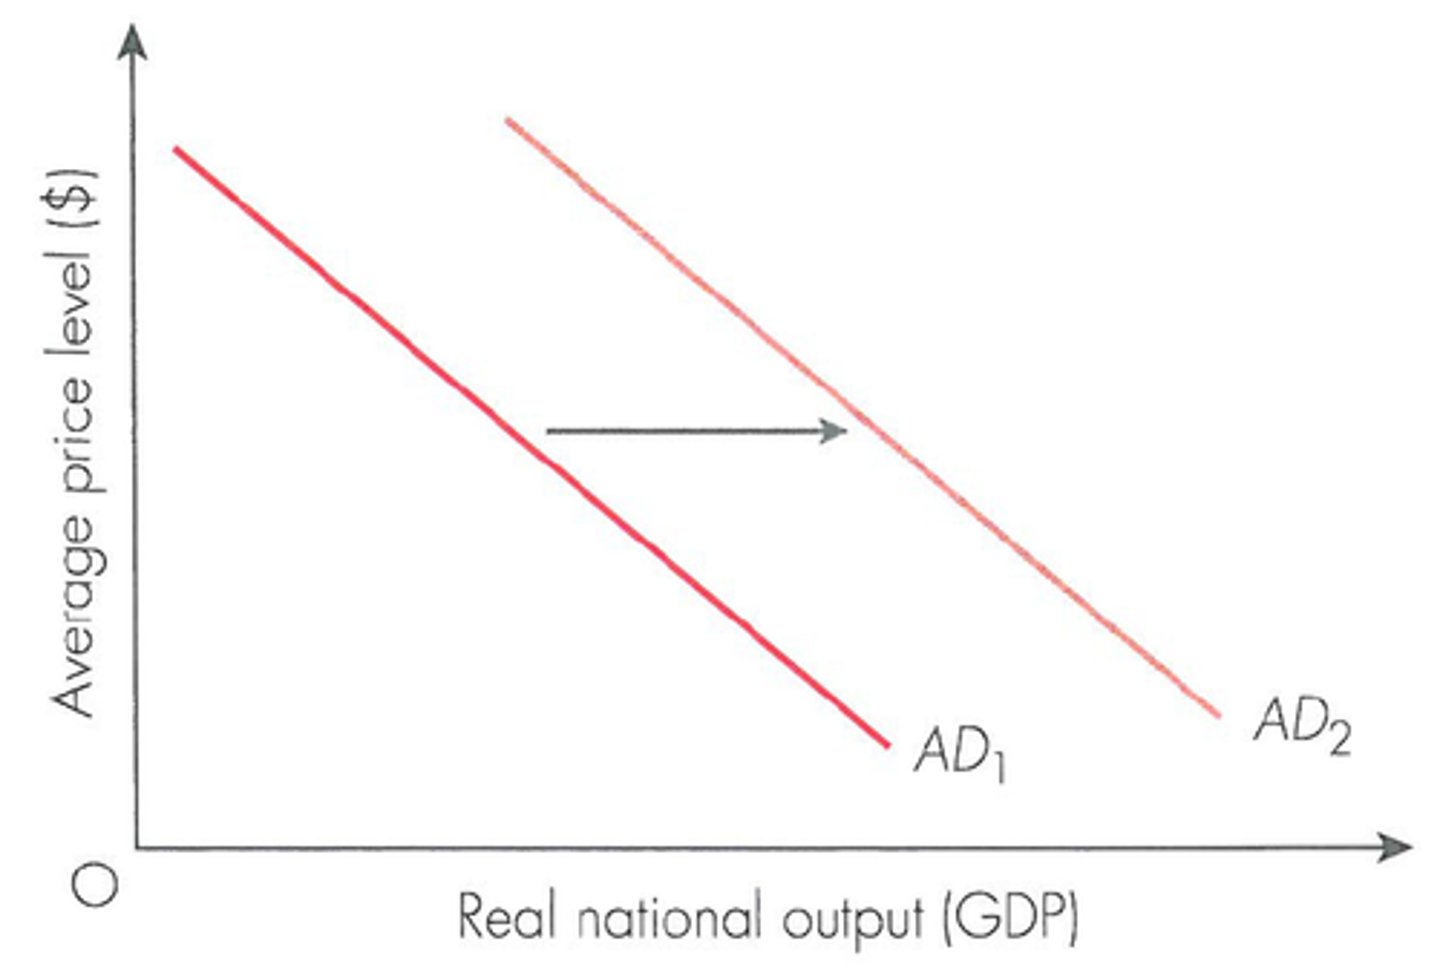
The aggregate demand and supply model allows us to analyse
The total demand for goods and services in an economy amounting to the total spending in the economy
Aggregate demand
The demand curve
What is this
The income and wealth effect.
The interest rate effect.
The open economy effect.
Three reasons why the demand curve has a negative relationship
The price level and quality of real GDP
The aggregate demand (AD) curve shows a relationship between
A rise in the price level reduces the purchasing power of household income or wealth.
The income or wealth effect
The real value of household wealth declines, and so will consumption.
As price level increases
The real value of household wealth increases, and so will consumption.
As price level decreases
A rise in the general price level means that households and firms will demand more funds to finance their transactions
Interest rate effect
If the domestic price level rises relative to other countries, domestic goods and services become less competitive in those countries, leading to a decrease in exports.
The open economy effect
An increase in Aggregate Demand (AD)
A shift to the right of a curve represents
Increased consumption spending due to reduced income tax.
Increased investment spending due to increased business confidence.
Increased consumption spending due to fall in interest
rates.
An increase in government spending.
Increased exports to China.
Some factors that might cause an increase in AD include:
A decrease in government spending.
A fall in business confidence leading to reduced investment
spending.
The strengthening of the $A, which would reduce exports.
Some factors that might cause a decrease in AD include:
There is a change in the price level.
A movement along the curve will occur if
Something other than a change in the price level affects the components of Aggregate Demands
A shift in the curve will occur if
total supply of goods and services that firms in a national economy plan on selling during a specific time period.
What is is aggregate supply
The relationship between the total production of goods and services and the general price level.
The aggregate supply curve
The supply curve.
What is this
1. The short-run aggregate supply curve (SRAS)
2. The long-run aggregate supply curve (LRAS)
What are the two types of aggregate supply curves
A pattern of expansion, contraction and recovery in the economy through fluctuations in its level of income, output and expenditure
What is the business cycle
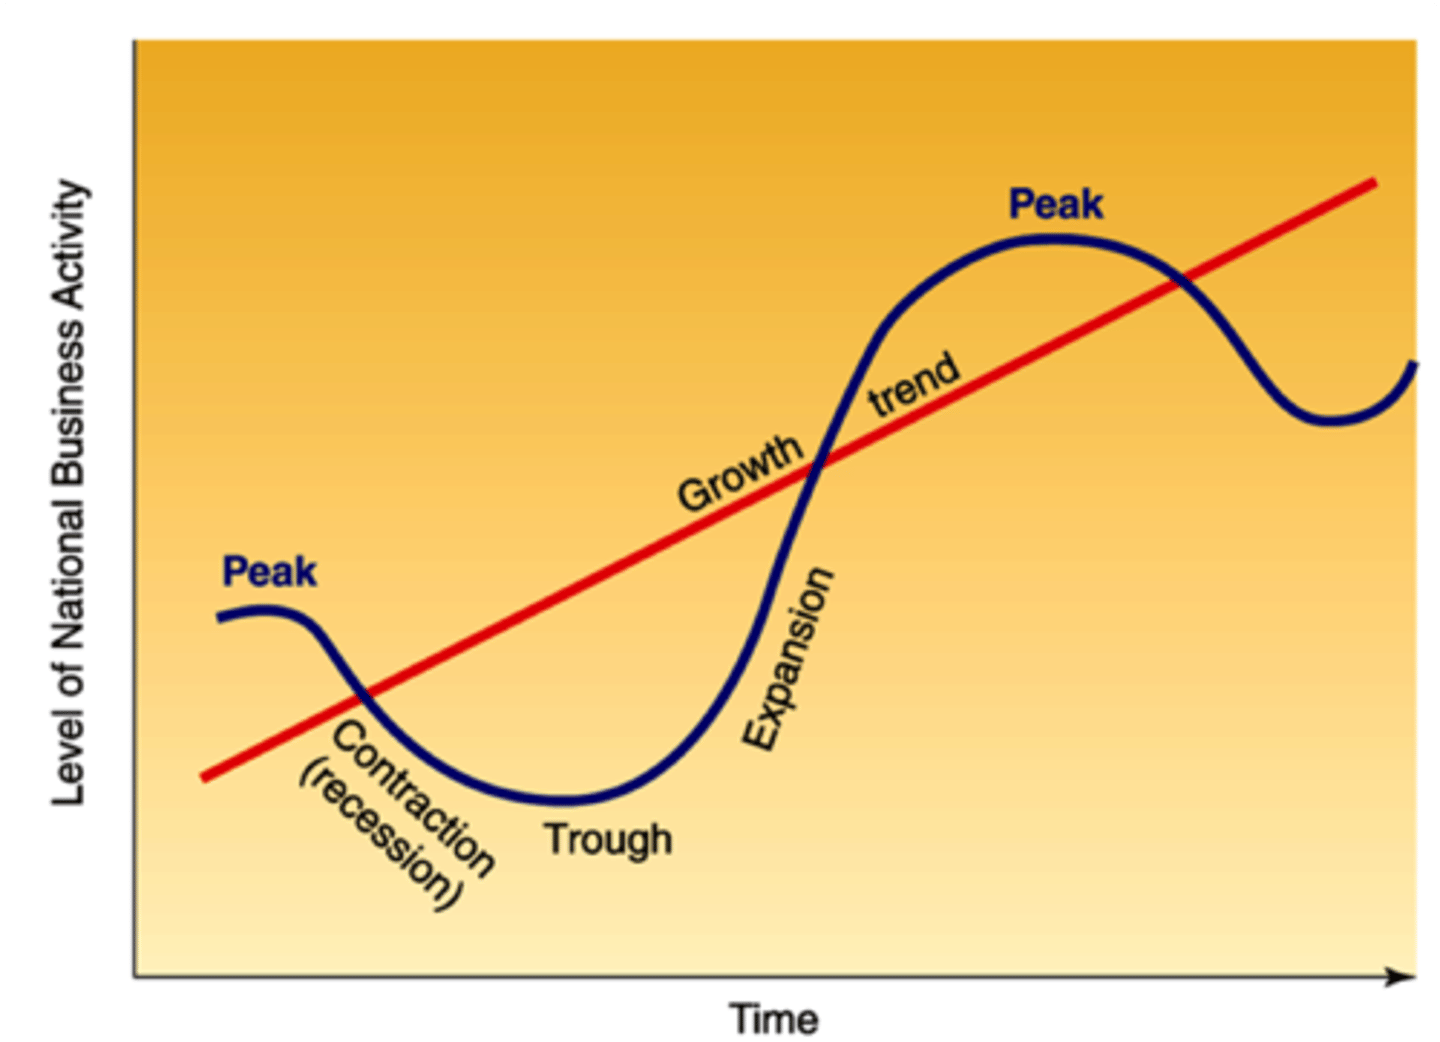
Upswing (recovery)
Boom
Downturn (contraction)
Trough (recession)
4 phases of the business cycle
Rising employment rates
Increased economic growth
Rising inflation
Output gap decreases
Upswing
Occurs when the economy is operating above or at its full employment levels
-High economic growth
-Imports are higher than exports
-High Inflation rates
-Very little unemployment (natural rate of unemployment)
-High consumer consumption
Boom

Occurs when the growth rate declines
-Unemployment Increases
-Output gap increases
-Decling business and consumer confidence
-Lower consumption spending
-Delining inflation rates
Downturn
Refers to two consecutive quarters of negative growth
-High unemployment
-Low inflation rates
-Decline in business and consumer confidence
-Budget deficit rising
Trough
-Exogenous shocks
-Endogenous shocks
Two types of economic shocks
Unrelated to changes in aggregate demand and impact upon spending in the economy
For example:
-Growth in the rest of the world
-Changes in the Terms of Trade
-Natural disasters
-Changes in exchange rates
Exogenous shocks
Internal shocks that come from the economies own working
Endogenous shocks
1. Multiplier effect - The multiplier effect refers to the increase in the final income arising from any new injection of spending
2. Accelerator effect - The accelerator effect states that investment levels are related to the rate of change of GDP
Two types of cumulative processes
BRuSH the floor
-Basic survival consumption
-Replacement spending
-Social security net
-Habit
Economic Floors
AIMS for the ceiling
-A negative output gap develops
-Inflation
-ME (monetary) policy response
-Supply-side constraints
Economic ceilings
The sum of the expenditures undertaken in the economy by the factors during a specific time period
Aggregate expenditure definition
Determines the total amount that firms and households plan to spend on goods and services at each level of income
What does Aggregate Expenditure determine
Consumption (C)
Investment (I)
Government spending (G)
Net exports (X - M)
Components of Aggregate Expenditure
AE = C + I + G + (X - M)
Aggregate expenditure equation
Consumption expenditure is the purchase of goods and services for use by households
Consumption makes up about 55% of aggregate expenditure and is a relatively stable component
What is consumption expenditure
Non-durable goods
Durable goods
Services
The three areas of consumption
Goods that are consumed quickly after purchase
Non-durable goods
Expected to last or provide utility for three or more years
Durable goods
Non-commodity items, education, health and recreation
Services
Some consumption expenditure is necessary to satisfy basic needs. This is known as survival consumption and is not direclty related to the level of income
Autonomous Consumption
Discretionary spending is on luxuries that can be put off or postponed. It satifies a consumer's higher order needs.
Discretionary Consumption
The more after-tax income household's have, the more consumption spending
Disposable income
The higher the interest rate the more households are encouraged to save and the less they will be prepared to borrow.
Interest rates
-Disposable income
-Interest rates
-Inflation
-Expectations and consumer confidence
-Wealth and debt
Factors affecting discretionary consumption
The higher the rate of inflation, the more expensive it is to delay purchases as household purchasing power declines
Inflation
The higher the level of consumer expectations or confidence the higher the level of consumption
Expectations and consumer confidence
Consumption is directly related to changes in net wealth. The wealthier people are or feel, the higher the level of consumption
Wealth and debt
C = a +bY
C = Consumption
a = autonomous spending
b = MPC (marginal propensity to consume)
The consumption function
S = -a + (1-b)Y
Saving function
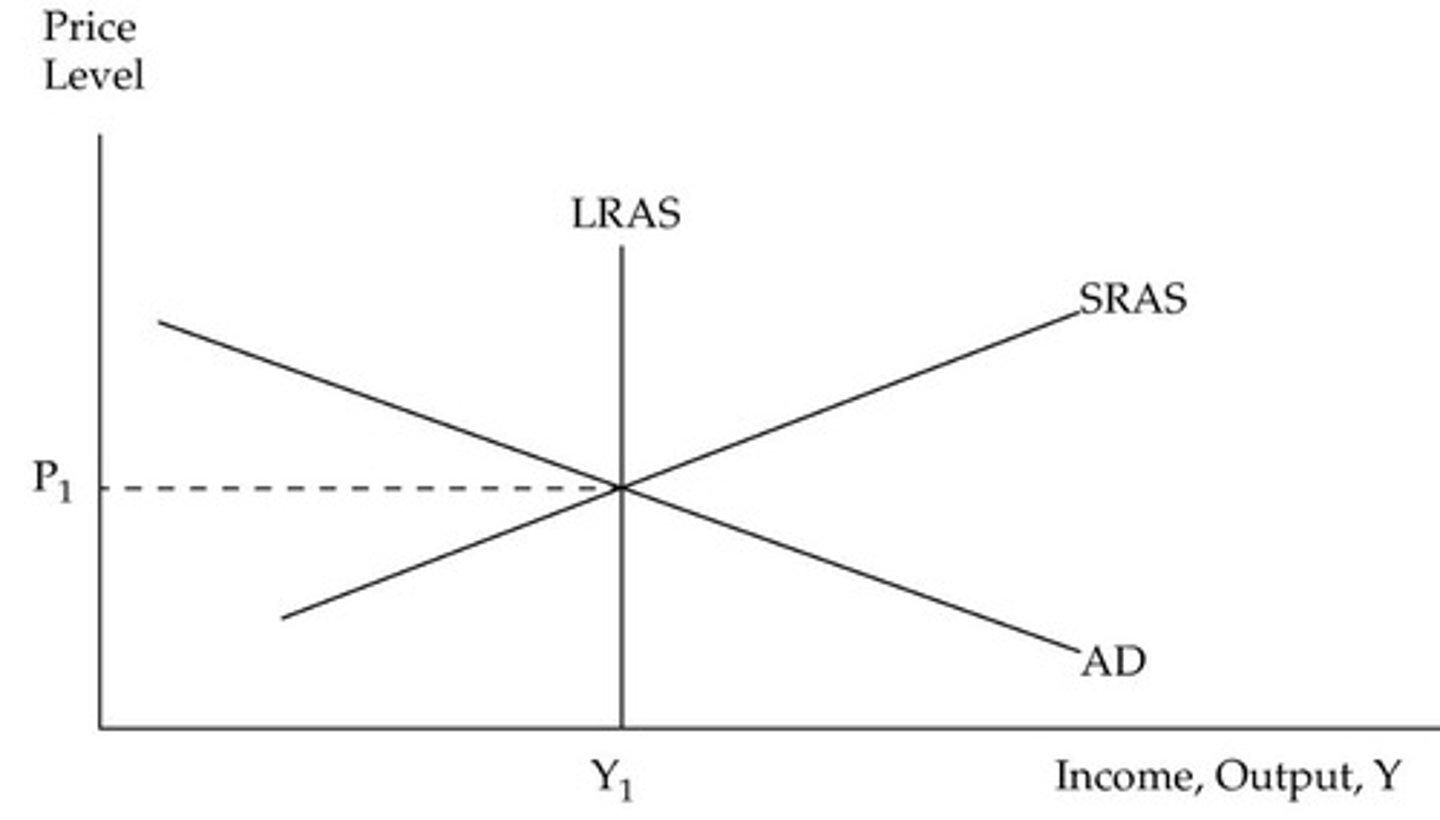
Short-run economic fluctuations will impact price level and real GDP
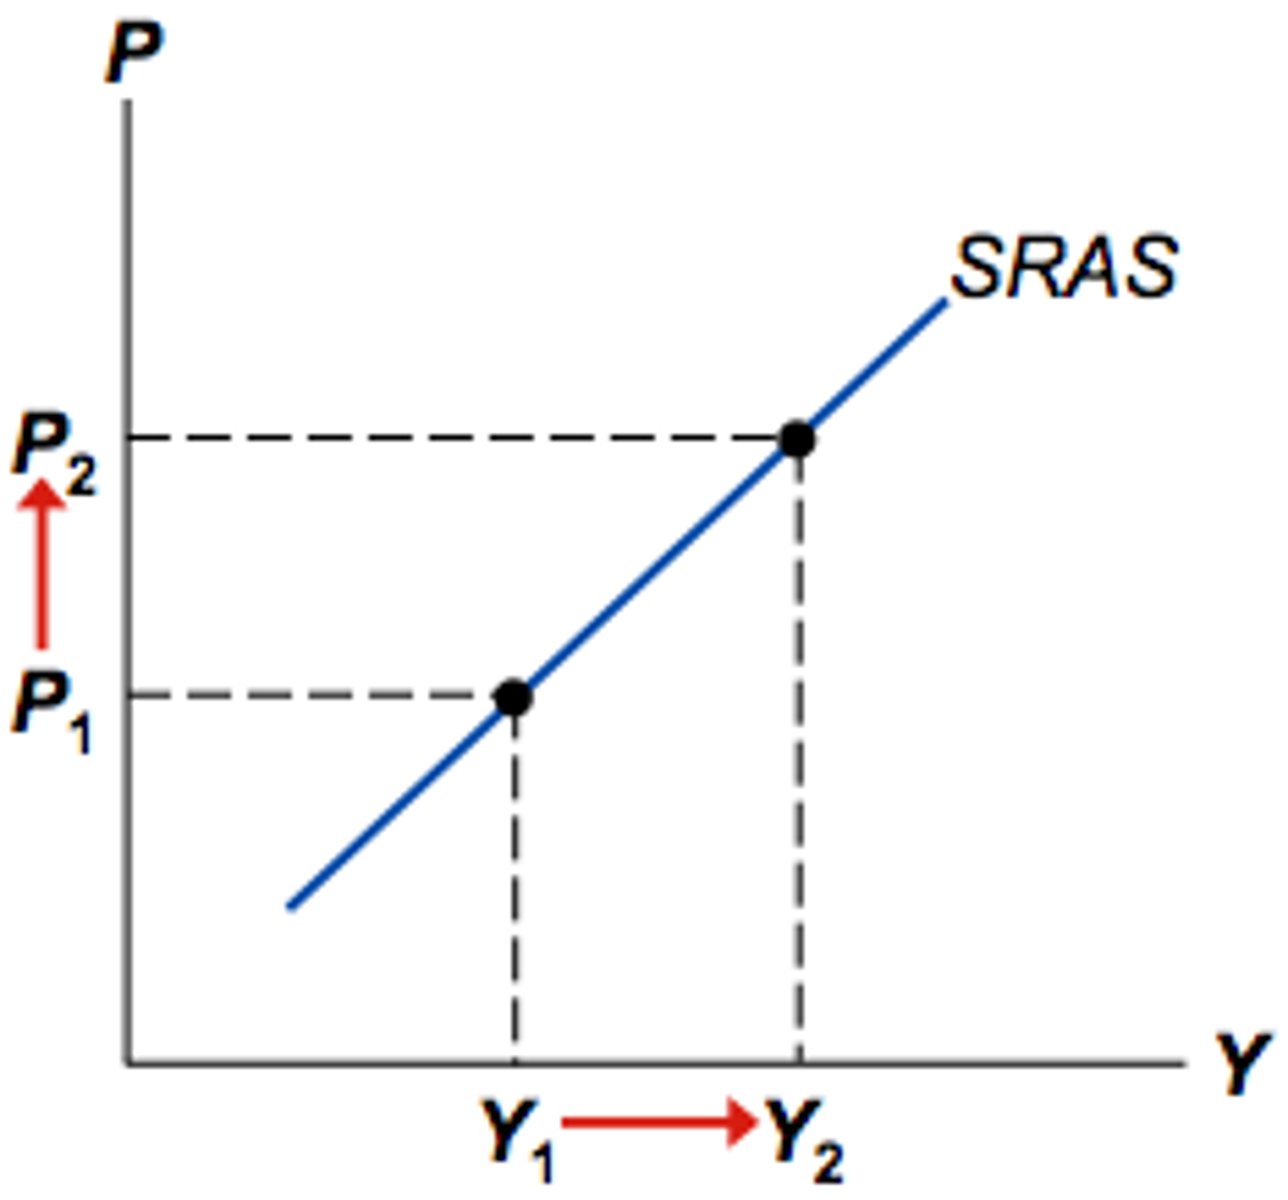
At higher prices, producers are willing to supply more.
The SRAS Curve
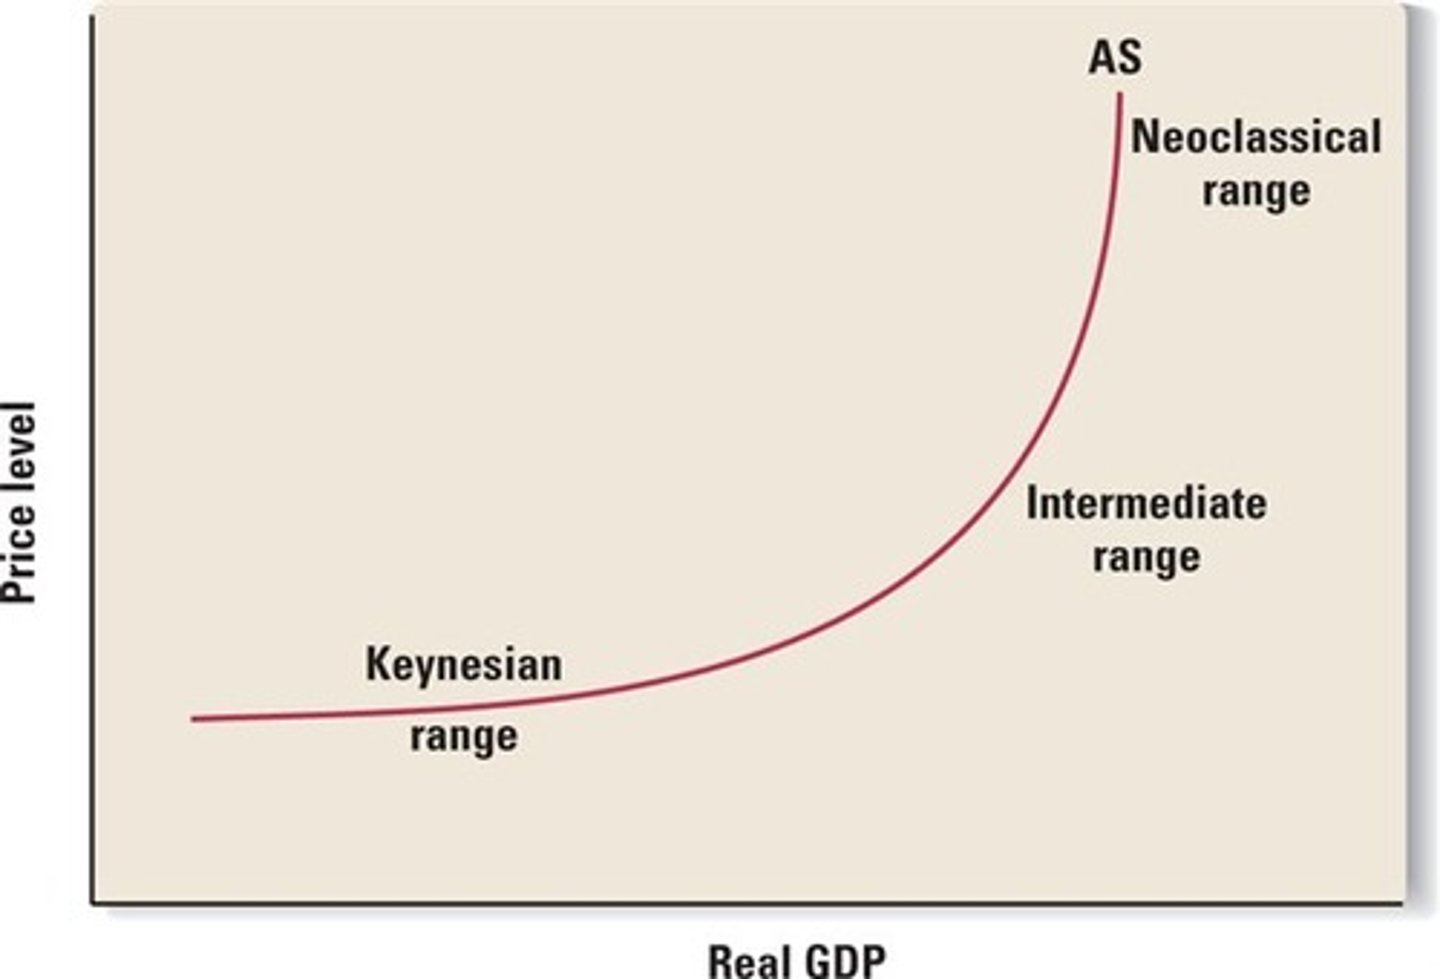
The Intermediate range
The Keynesian range
The Classical range
The Three stages of the AS curve
Where the economy usually is
The Intermediate range
Applies when the economy is in recession and there are many underutilised resources
The Keynesian range
Applies when the economy is booming and there is pressure on resources
The Classical range
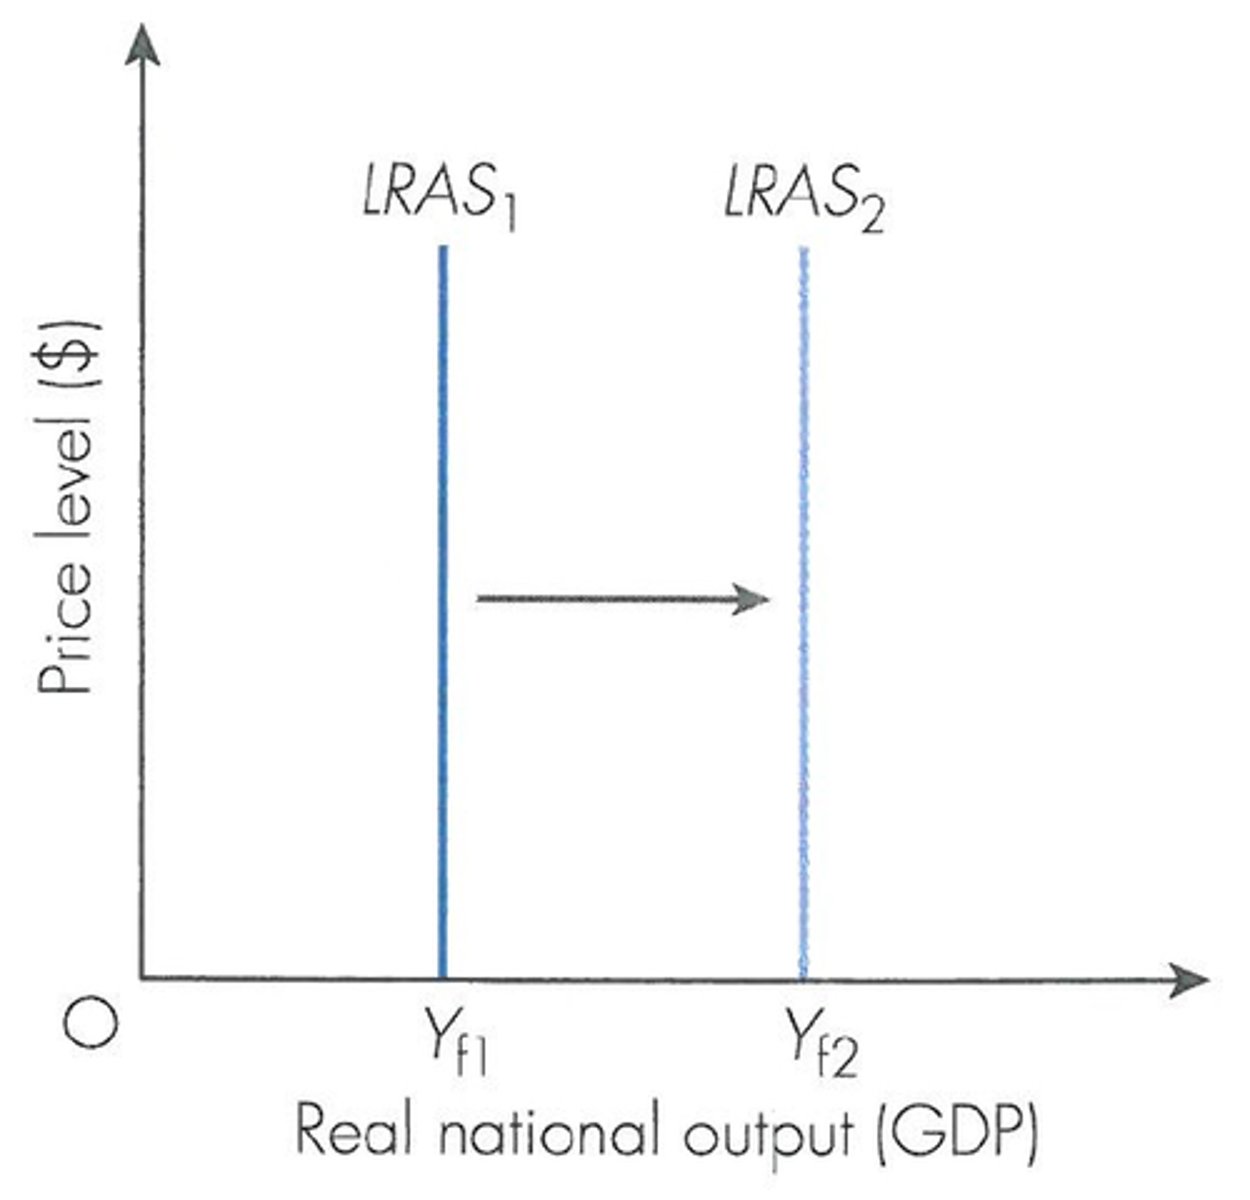
Shows the economy's the potential level of real GDP when all resources are fully employed
The position on the LRAS curve is determined by the quantity of resources and the technology available
The LRAS Curve
The Australian government and the RBA deliberately regulate various aspects of our market economy as to improve its performance.
What does the Reserve Bank of Australia (RBA) and the government do?
Sustainable economic growth
Price stability (low inflation)
Full employment (low unemployment)
Main economic objectives
More equitable distribution of income
Efficient allocation of resources
Other economic objectives
Involves the overall pace or speed at which national production is growing
The level of economic activity
Usually very unstable, and sometimes experience violent ups and downs in national production involving booms and recessions
Unregulated market economies
3.2% - 3.5%
The target range for economic growth
3.2%
The long term average rate of growth in Australia is
not sustainable due to resource depletion, production bottlenecks and inflationary pressure.
Economic growth above 4% is
Is determined by the increase in the labour force and growth of productivity.
The rate of increase in Real GDP
Higher living standards and creates demand for labour which could increase employment opportunities.
Economic growth leads to
Occurs when there is little increase in the general price level - low rates of inflation.
Price stability
2 - 3% inflation
Inflation rate target
Persistent increase in the price level
What is inflation
Maintains the value of money
Protects savings
Helps keep interest rates low
Promotes international competitiveness
Reduces uncertainty for decision makers
Protects the living standards of low income earners
Benefits of low inflation
Through its various policies, the Australian Government seeks to create more jobs, achieve the goal of full employment and raise Australian living standards.
Full employment
5%
Unemployment target range
It is impossible to achieve a zero rate of unemployment.
This is because of the existence of frictional (1.5-2.5%) and structural (2-3%) unemployment.
Dynamic structure of developed economies
The natural rate is the lowest rate of unemployment we can achieve without inflationary pressure.
The natural rate of unemployment
A households wealth is determined by the difference between the value of its assets and the value of debts
The wealth effect
the real value of household wealth declines (purchasing power), and so will consumption
As price level (PL) increases
the real value of household wealth increases (purchasing power), and so will consumption
As price level (PL) decreases
Higher prices normally lead to higher nominal interest rates to reward or compensate savers for the effect inflation has on the real value of bank deposits and loans.
The interest rate effect
households and firms need more funds to finance buying and selling
As interest rate effect PL increases
A rise in the price level (ceteris paribus) reduces the international competitiveness of Australia's products
International Trade effect
A shift in the AD curve
What is this
-Prices in resource markets, particularly labour markets, adjust when there are shortages or surpluses in markets
-A change in the cost of resources will cause producers to adjust their willingness to supply (SRAS)
-The long-run capacity of the economy is independent of the economy's price level
Neo-classical aggregate supply assumptions
The short run is defined as the time period in which prices of factors of production are inflexible (wage levels)
SRAS - Short-run aggregate supply
The Short-run aggregate supply curve shows the relationship between the price level and real GDP
SRAS shows
The LRAS curve shows the relationship in the long-run between the price level and the quantity of real GDP supplied
LRAS - Long-run aggregate supply
-Population - rate of growth in the working age population
-Participation - changes in labour force participation
-Productivity - growth in output over and above growth in labour hours
In the long-run, the level of real GDP or the potential level of output is determined by the 3 P's
Greater level of investment. (purchase of capital goods)
Technological change and integration. (better equipment, increased knowledge capital and more efficient production processes)
More education and better health. (human capital)
Increases in entrepreneurial activity. (investment in human capital)
An increase in resources such as migrant workers or mineral discoveries.
An increase in the quantity and quality of machinery and equipment used in production.
Factors/ shocks that cause shifts
The autonomous change in a competent o
Neo-classical equilibrium
Expansion
Short run
-Allocative role - The government direct allocates resources to provide public and merit goods and services
-Regulatory role - The government regulates business activity and markets eg. to control monopoly power or prevent negative externalities
-Redistributive role - The government provides a social security safety net, where needed through a system of taxation and transfers
-Demand management role - The government manages the level of aggregate demand to achieve its economic growth
The economic role of the Australian Government
Reduced unemployment.
Improved public services.
A rise in material living standards.
Avoids relative decline.
Advantages to sustained economic growth
Externalities.
Increased inequality.
Demand-Pull inflation.
MPM.
Skill shortages.
Disadvantages to sustained economic growth
Promotes international competitiveness.
Fosters a low interest rate environment.
Protects real incomes in the economy.
Confidence.
Advantages to price stability
A danger of deflation.
Fall in aggregate demand.
Allows debts to fall in real terms over time.
Disadvantages to price stability
Avoids economic costs.
Avoids costs to the government.
Avoids social costs.
Avoids personal/individual costs.
Advantages to full employment
Wage-push inflation.
Moral hazard.
Natural unemployment.
Disadvantages to full employment
Higher marginal propensity to consume.
Access to minimum living standards.
More people have the ability and power to spend.
More Harmonious.
Advantages to equitable income distribution
Expense of economic efficiency.
Remaining competitive.
Lack of reward and incentive.
Disadvantages to equitable income distribution
Competitive in overseas markets.
Greater levels of exports.
Comparative advantage.
Economies of Scale.
Reduces CAD.
Fosters a dynamic business climate
Advantages to Improving trade performance
Only some sectors are developed.
Dumping.
Crowd out domestic firms
Disadvantages to Improving trade performance
Add more to...
previous chapter