AP HUG Unit 2: Population and Migration
1/80
Name | Mastery | Learn | Test | Matching | Spaced | Call with Kai |
|---|
No analytics yet
Send a link to your students to track their progress
81 Terms
the number of people per unit of land
Arithmetic population density
number of people per unit of arable land
Physiological population density
number of farmers per unit of arable land
Agricultural population density
Redistricting
the population level that can be supported
Carrying capacity
number of people <15 + number of people >65 compared to the working age population
Dependency ratio
total births per 1000 people
CBR (crude birth rate)
the average number of children a woman would have in her lifetime
TFR (total fertility rate)
annual number of deaths <12 months compared with total live births
Infant mortality rate
the number of deaths in a specific geographic area during a given period (usually one year) per 1,000 people
CDR (crude death rate)
the difference between a population’s CBR and CDR per 1000 people
RNI (rate of natural increase)
model that describes how a country changes overtime using birth rate, development, and death rate
DTM (demographic transition model)
model that describes how causes of death change over time as societies develop
Epidemiological Transition Model
theory by Thomas Malthus that states populations grow exponentially and food production grows arithmetically leading to inevitable crises like famine, disease, and war
Malthusian Theory
Boserup Theory
theory by Ester Boserup that population growth drives agricultural innovation
policies put in place to discourage population growth. Most common among countries with high birth rates.
Antinatalist policies
policies that encourage population growth. Most common among countries with low birth rates.
Pronatalist policies
model that describes the transformation of countries from high birth and death rates to lower birth and death rates as part of the development process.
Zelinsky’s migration transition model
features that hinders or prevents a migrant from reaching their desired destination
Intervening obstacles
factors that appears on a migrant’s journey that makes them want to divert from their original path
Intervening opportunity
a mathematical formula used to predict the interaction between two locations based on their size and distance from each other.
Gravity model of migration
a pattern of migration in which people move to a destination in smaller stages
Step migration
a person that was forced to flee their home but stay within the country
IDP (Internally displaced person)
the process where immigrants are drawn to a particular location to follow others
Chain migration
the movement of animals during different seasons by herders
Transhumance
a person that has been forced to leave their country in order to escape war, persecution, or a natural disaster
Refugee
neighborhoods with people of the same ethnic group
Ethnic enclaves
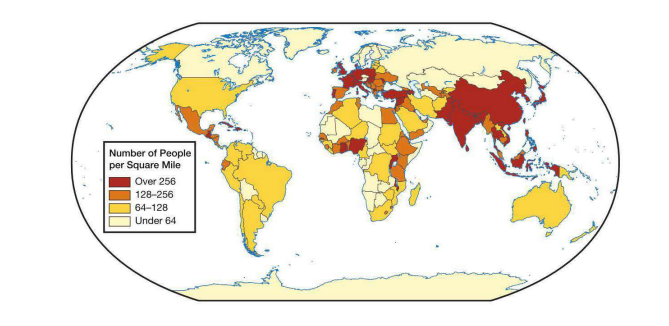
Which generalization is best illustrated by the world map above?
The majority of the world's population lives between 20° N and 60° N latitude.

Based on the map, which area is most densely populated?
Eastern Asia

According to the table, which country has a greater need for increased crop yields and imported foods and why?
Country A: Its high arithmetic and physiological densities indicate that it needs to use a high percentage of its land to grow crops.

Which of the following types of population information is shown on the map?
Arithmetic density
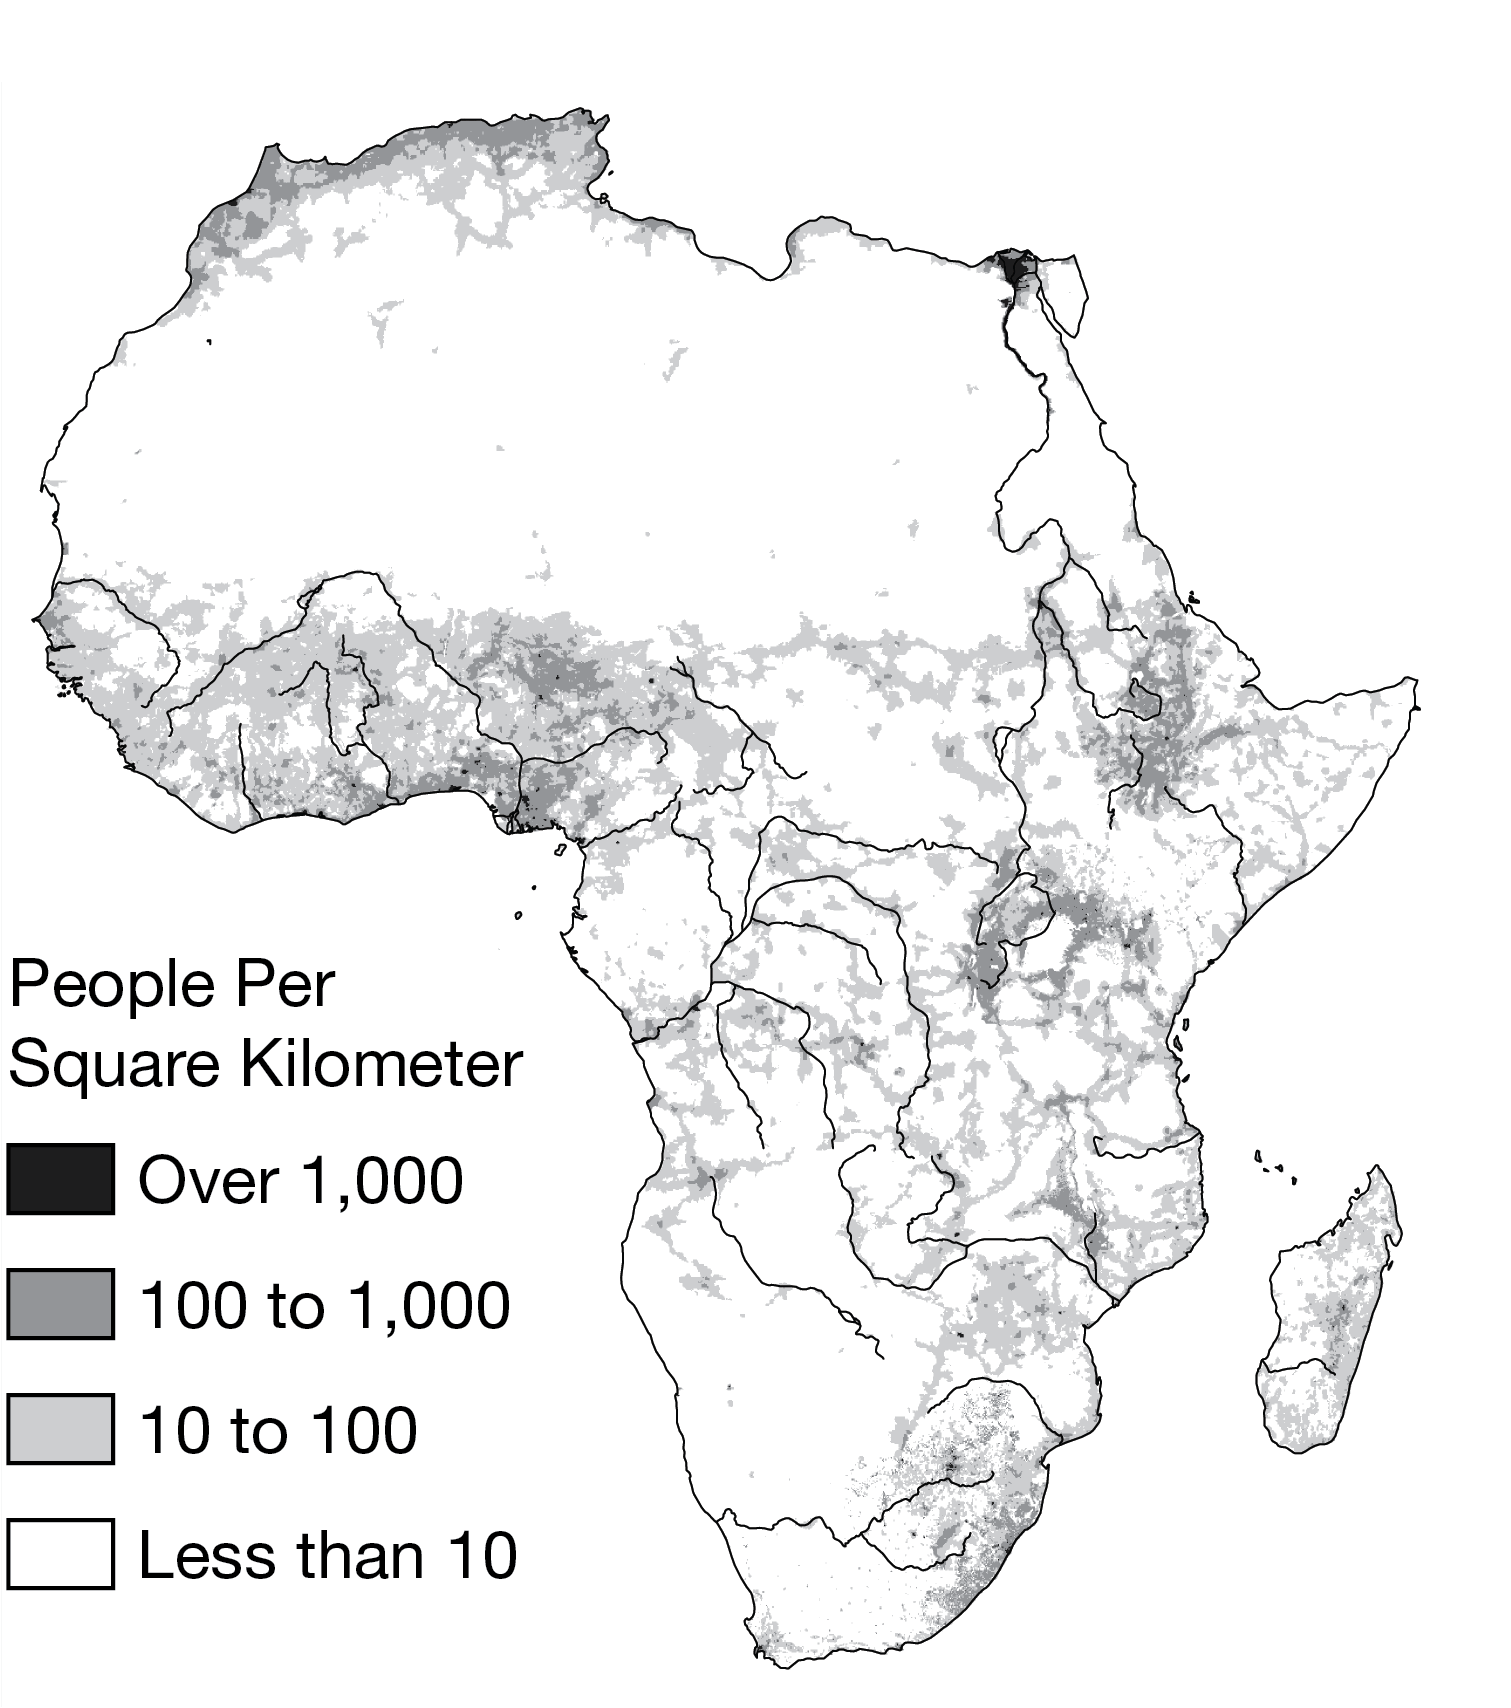
Population patterns shown on the map indicate that areas around river deltas and upland lake and river valleys have higher densities. Which of the following best explains why these regions are more heavily populated?
These regions have higher carrying capacities.

Which of the following best identifies the data for western China, shown on the map?
Low arithmetic density

If rural-to-urban migration continues in China, which of the following outcomes is most likely?
Housing shortages in urban areas will be common.
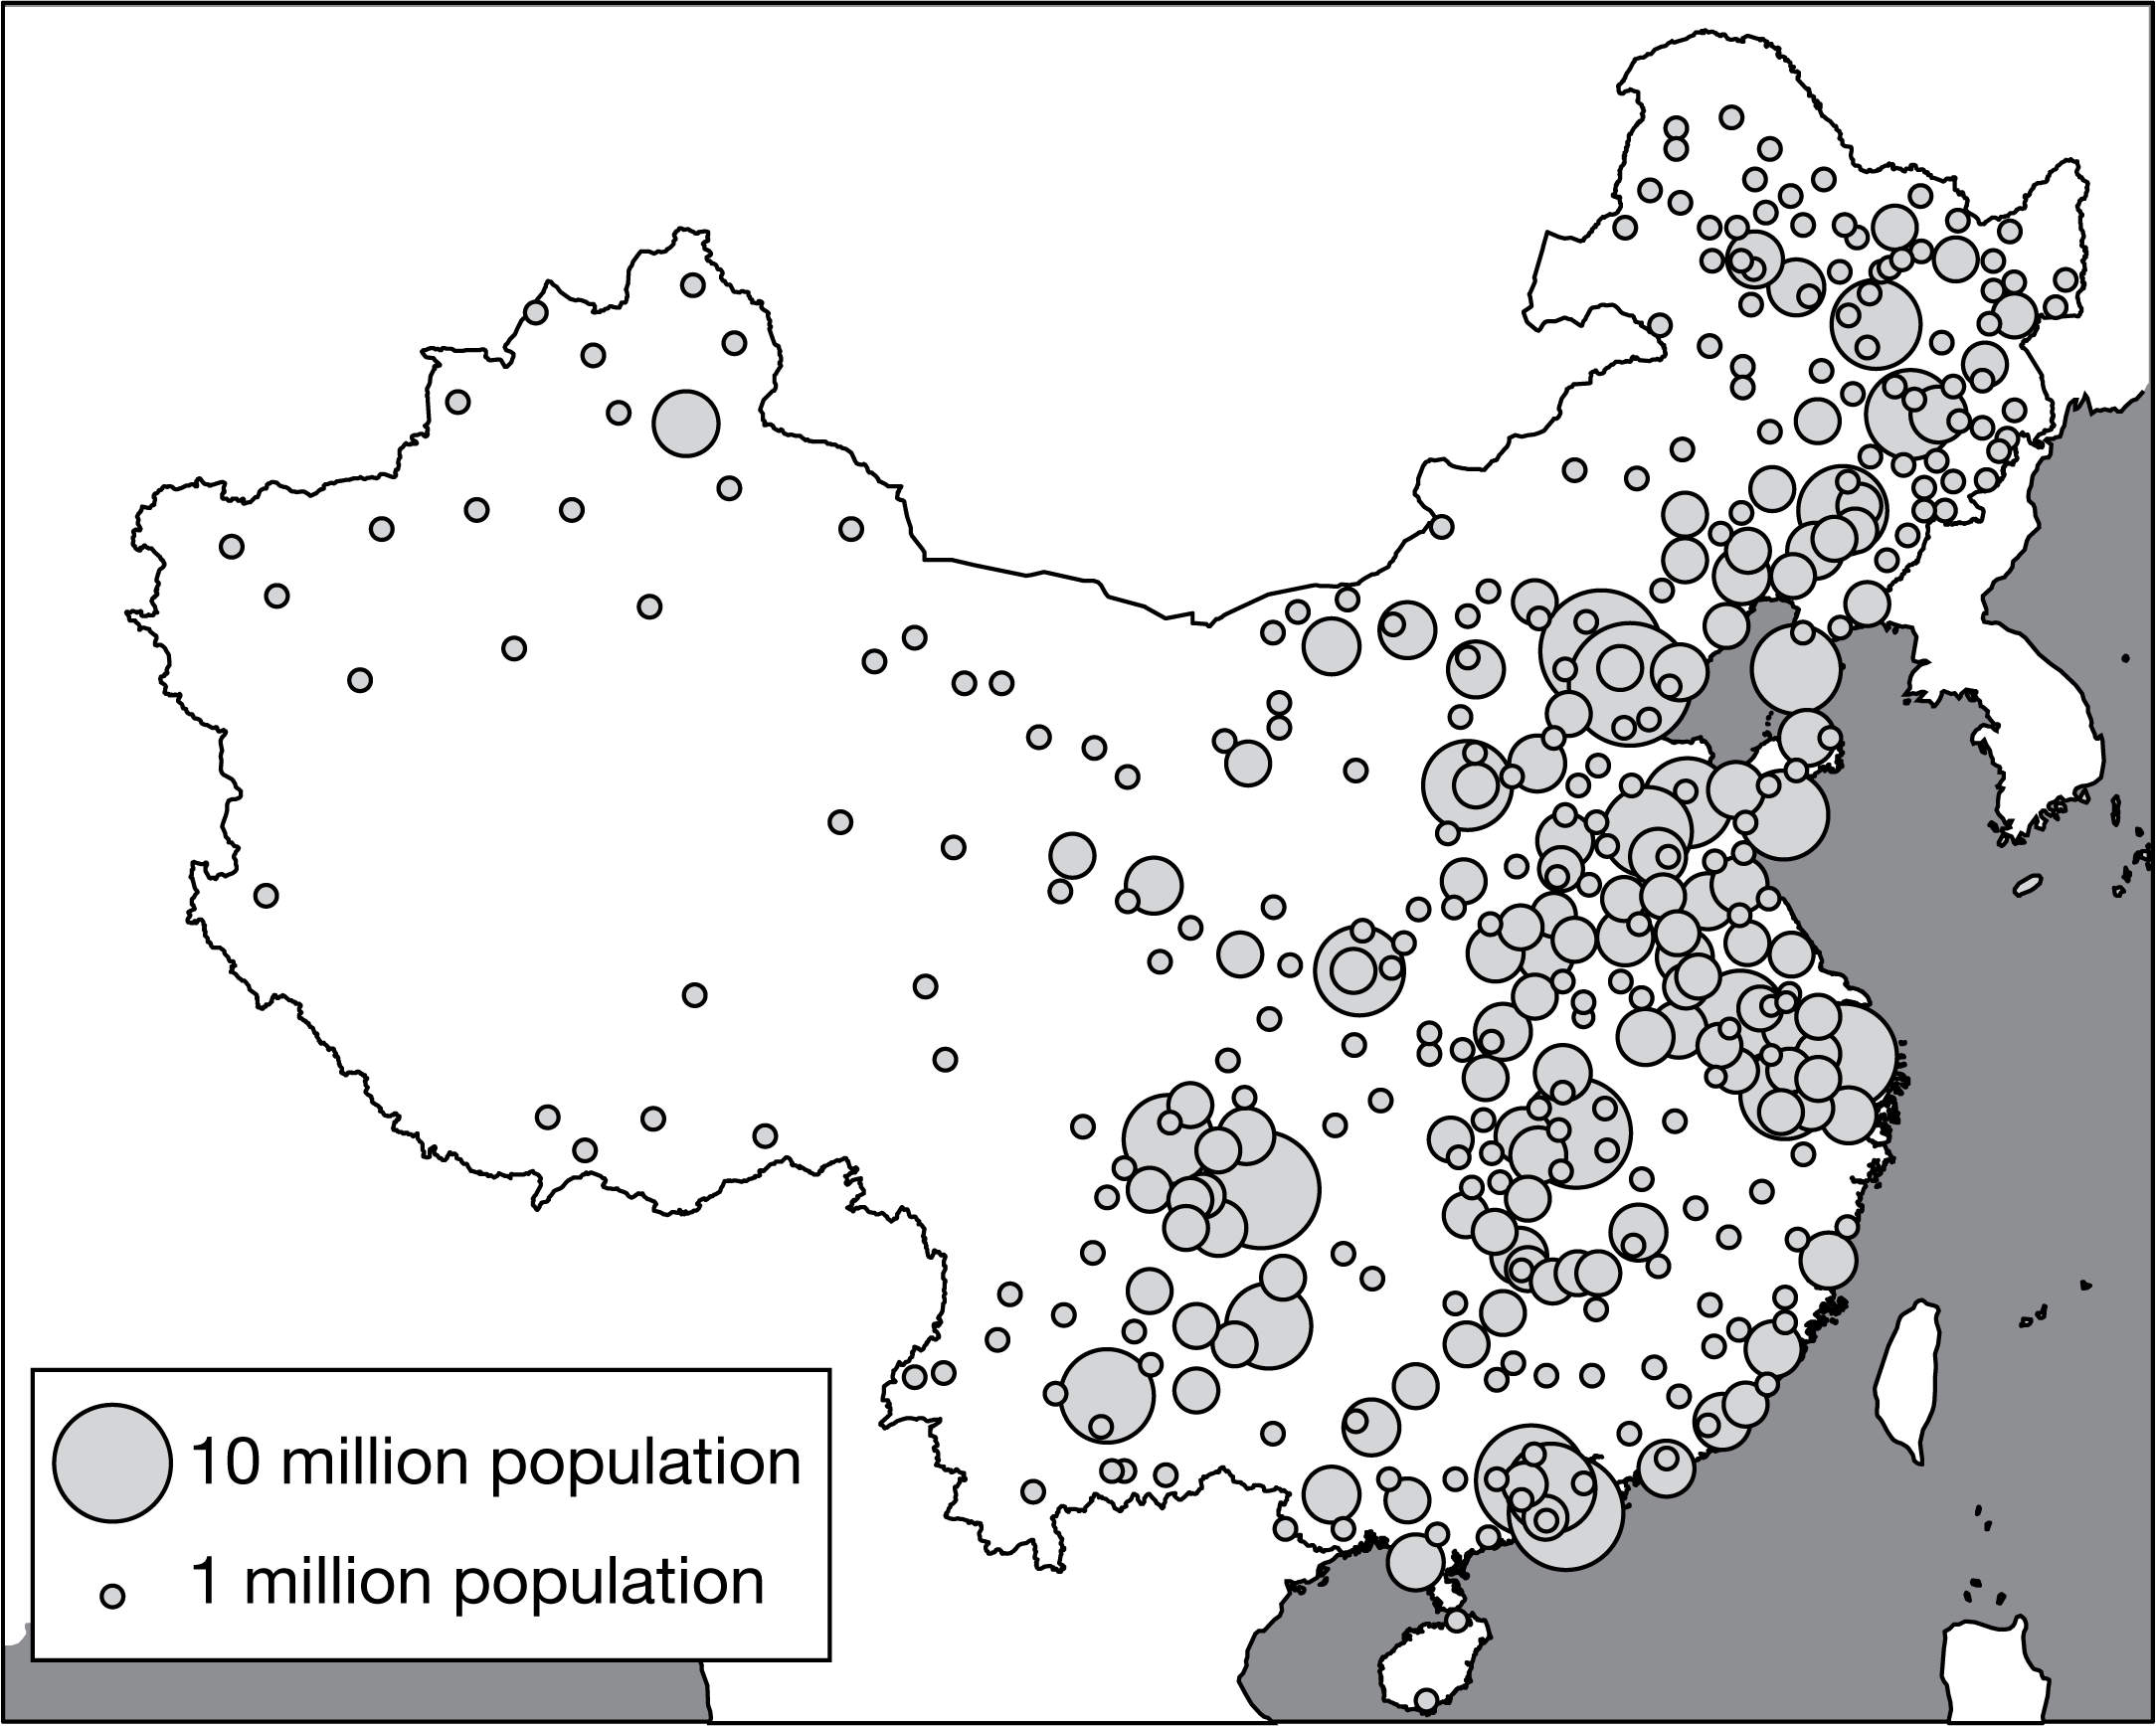
Which statement best explains an environmental impact of China's population distribution?
The population distribution shown requires more intensive use of limited soil and water resources to increase the carrying capacity of agricultural land.
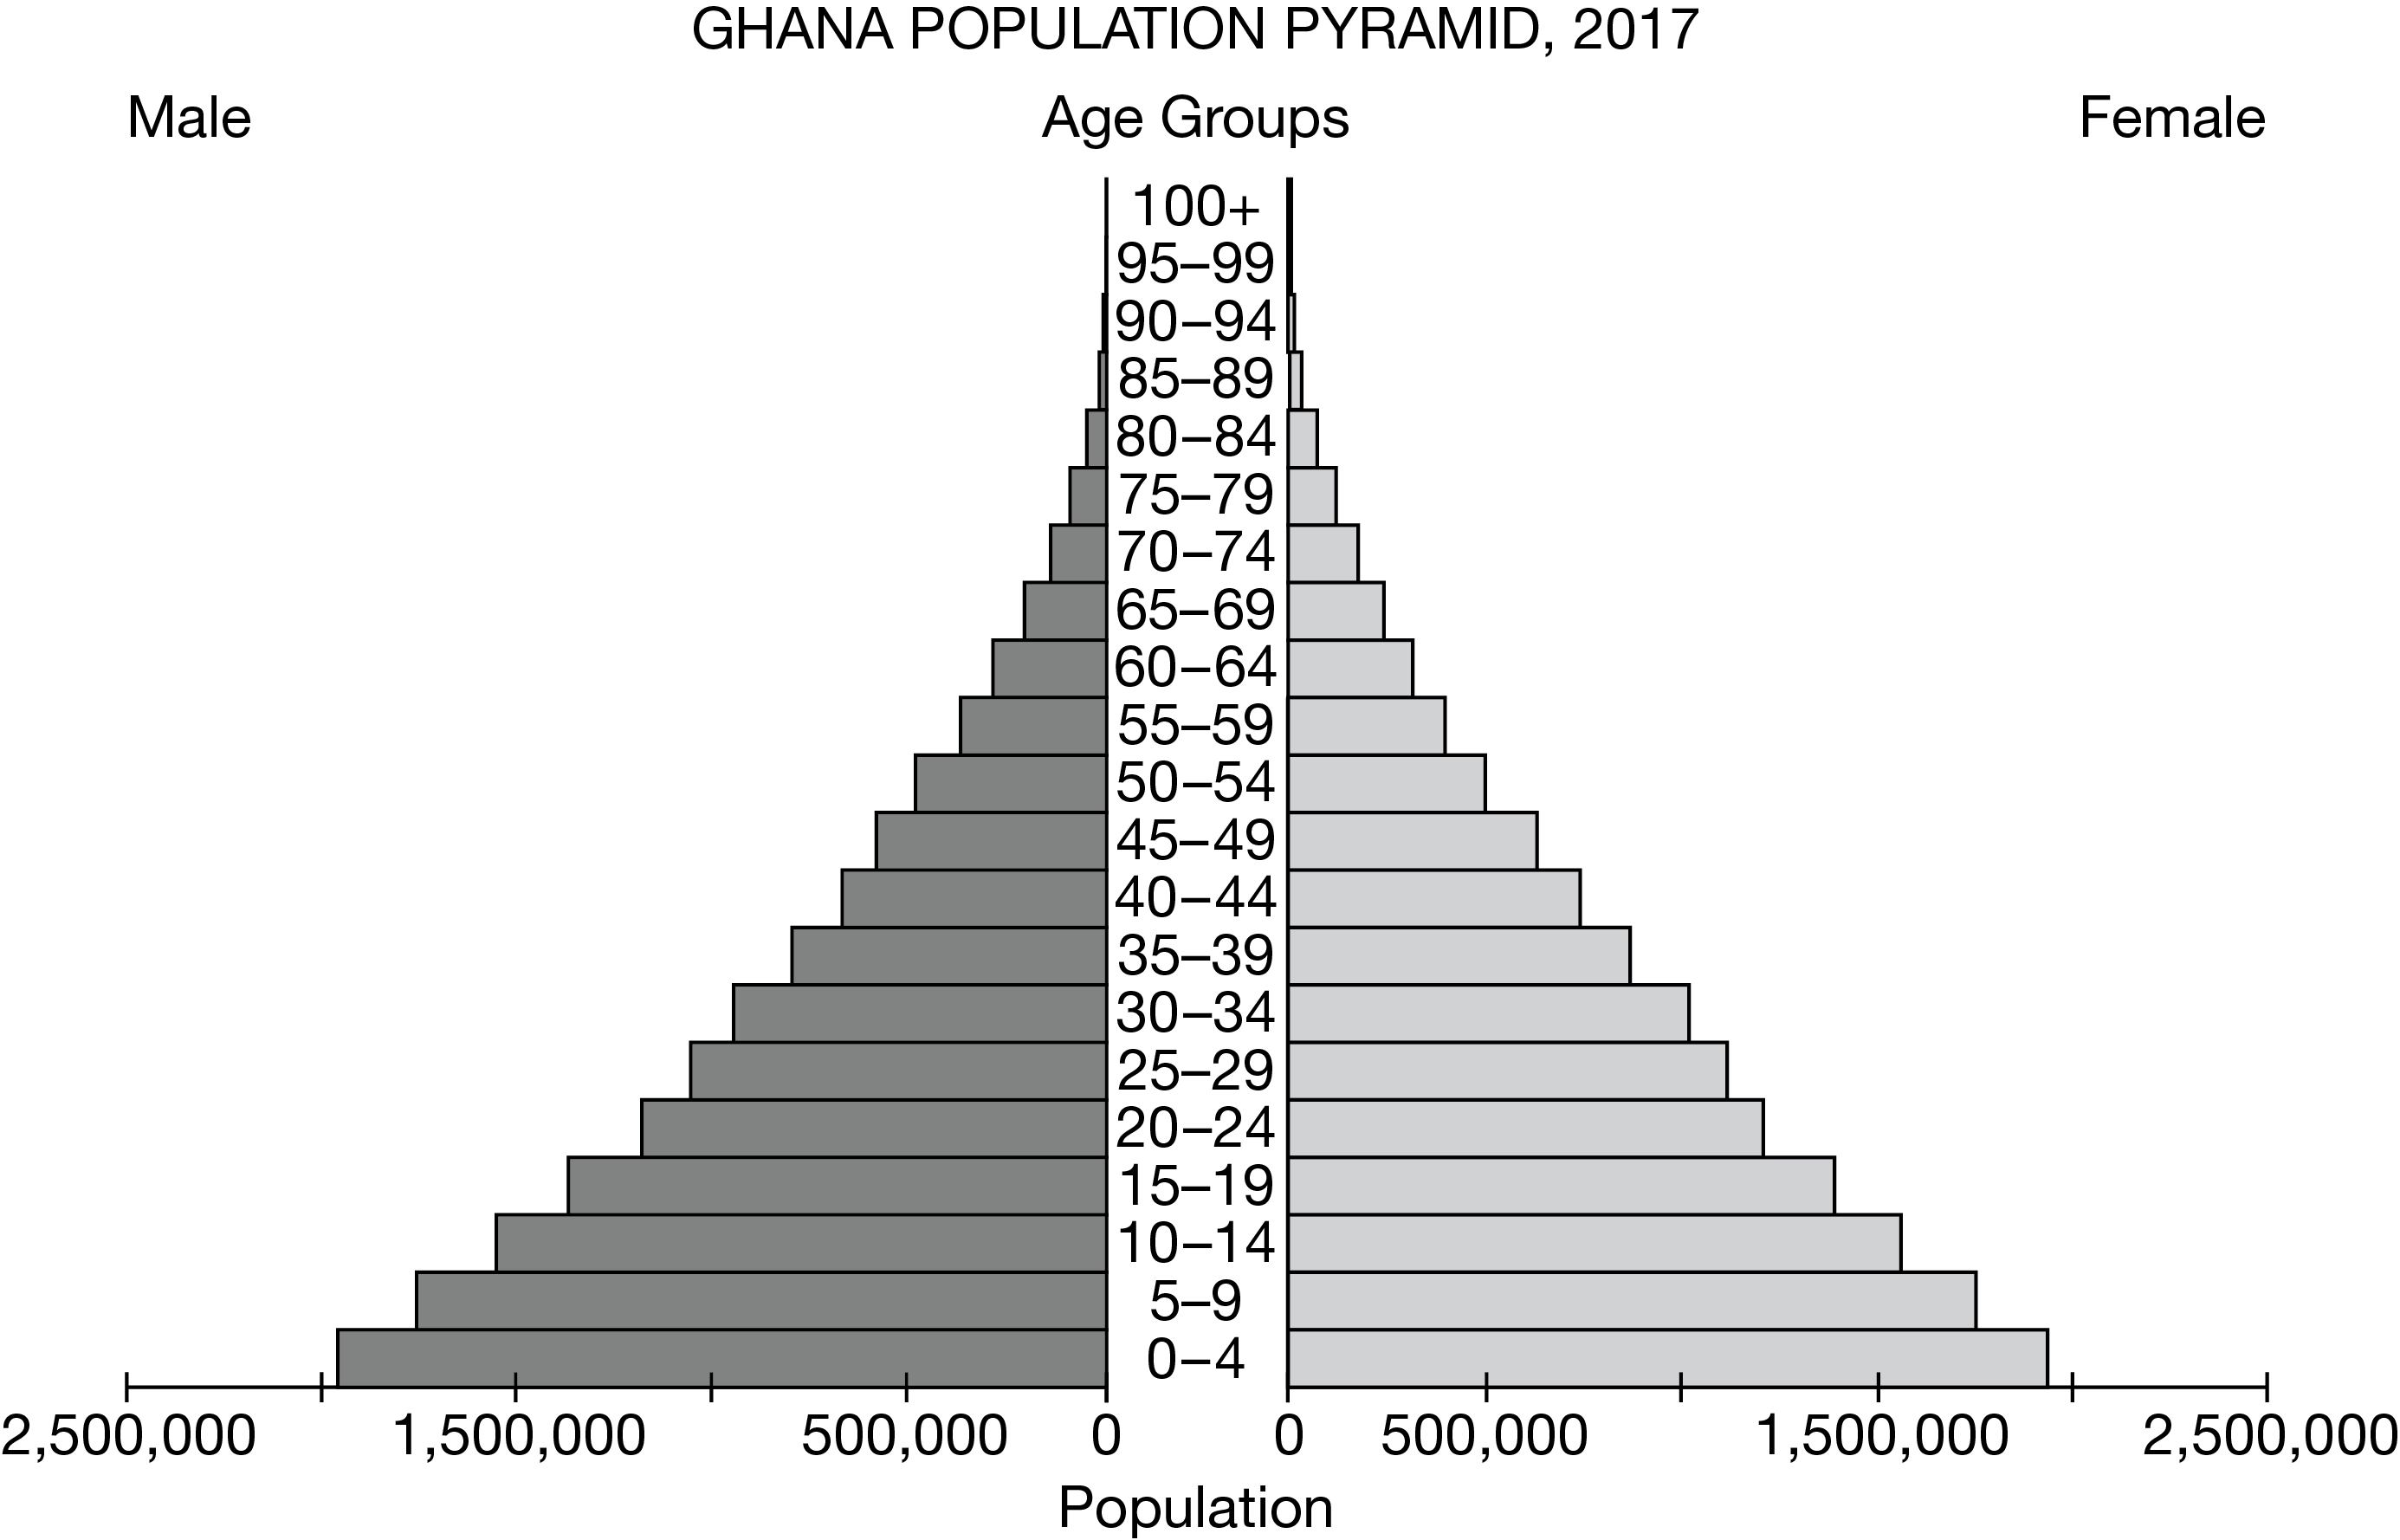
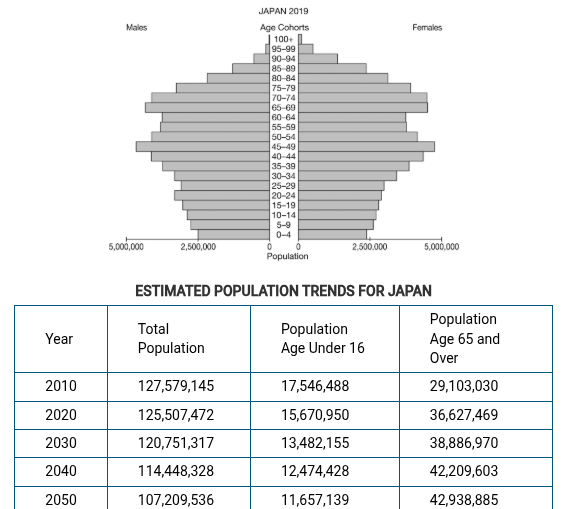
Which of the following patterns is indicated by the population pyramid shown?
The population has a high total fertility rate.
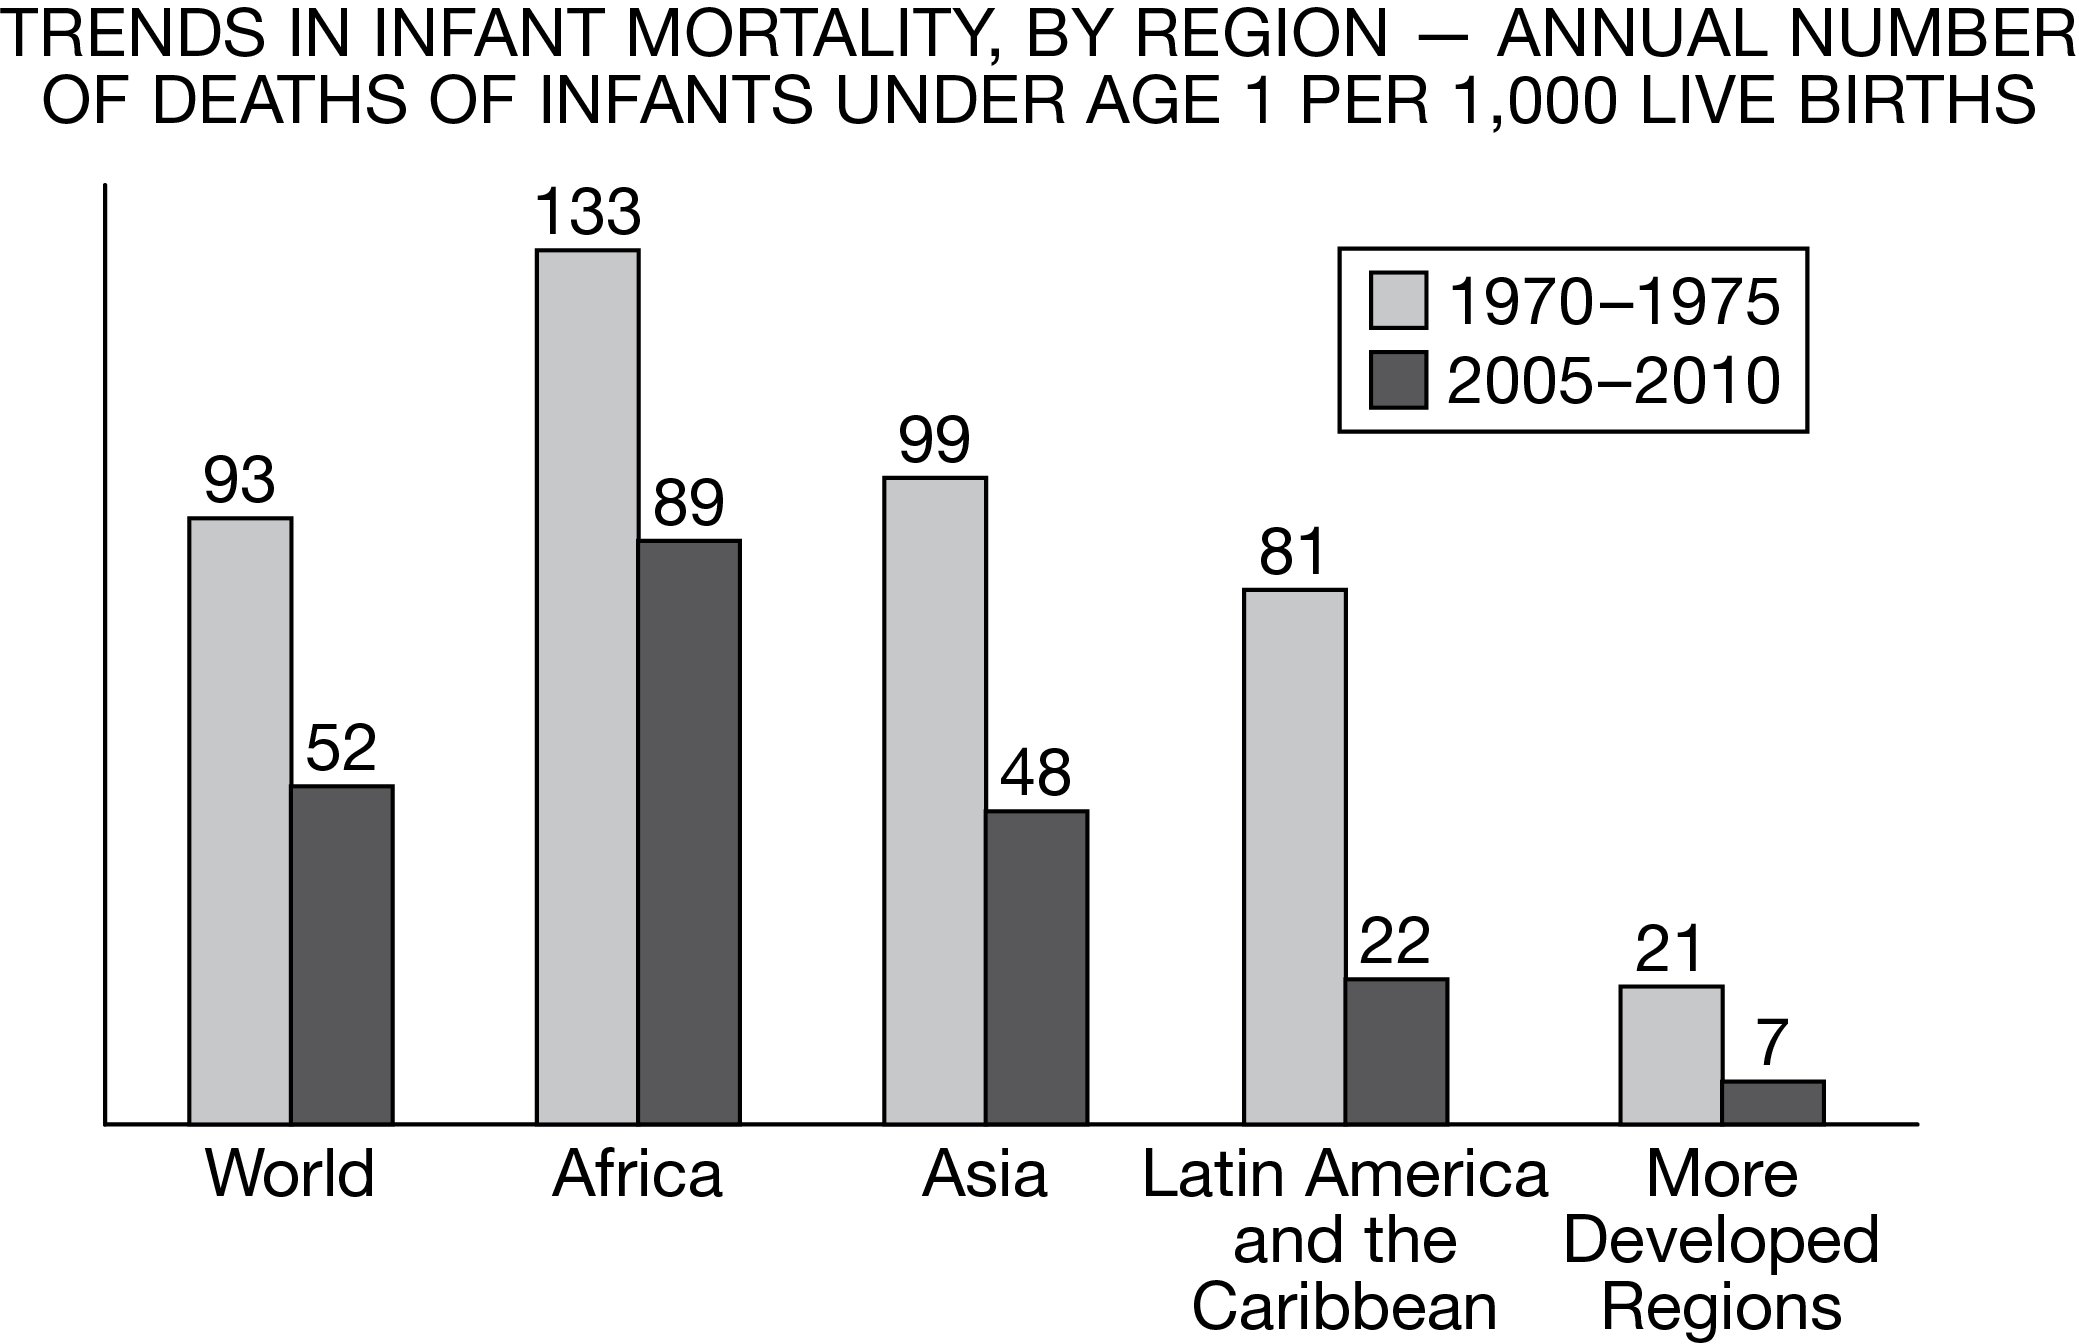
Which of the following statements best explains the trend about infant mortality shown in the bar chart?
The trend can be explained by improved health care and nutrition in all regions.
A large number of Turkish people migrated to Germany in the 1960s, when West Germany’s manufacturing economy was booming and Turkey’s economy was predominantly agricultural. Which of the following best describes Turkish migration to Germany?
Voluntary guest workers
Which of the following best explains an effect of migration within the United States between 1950 and 2010
The mean center of the population of the United States shifted to the South and West as workers migrated to areas with more jobs and a warmer climate.
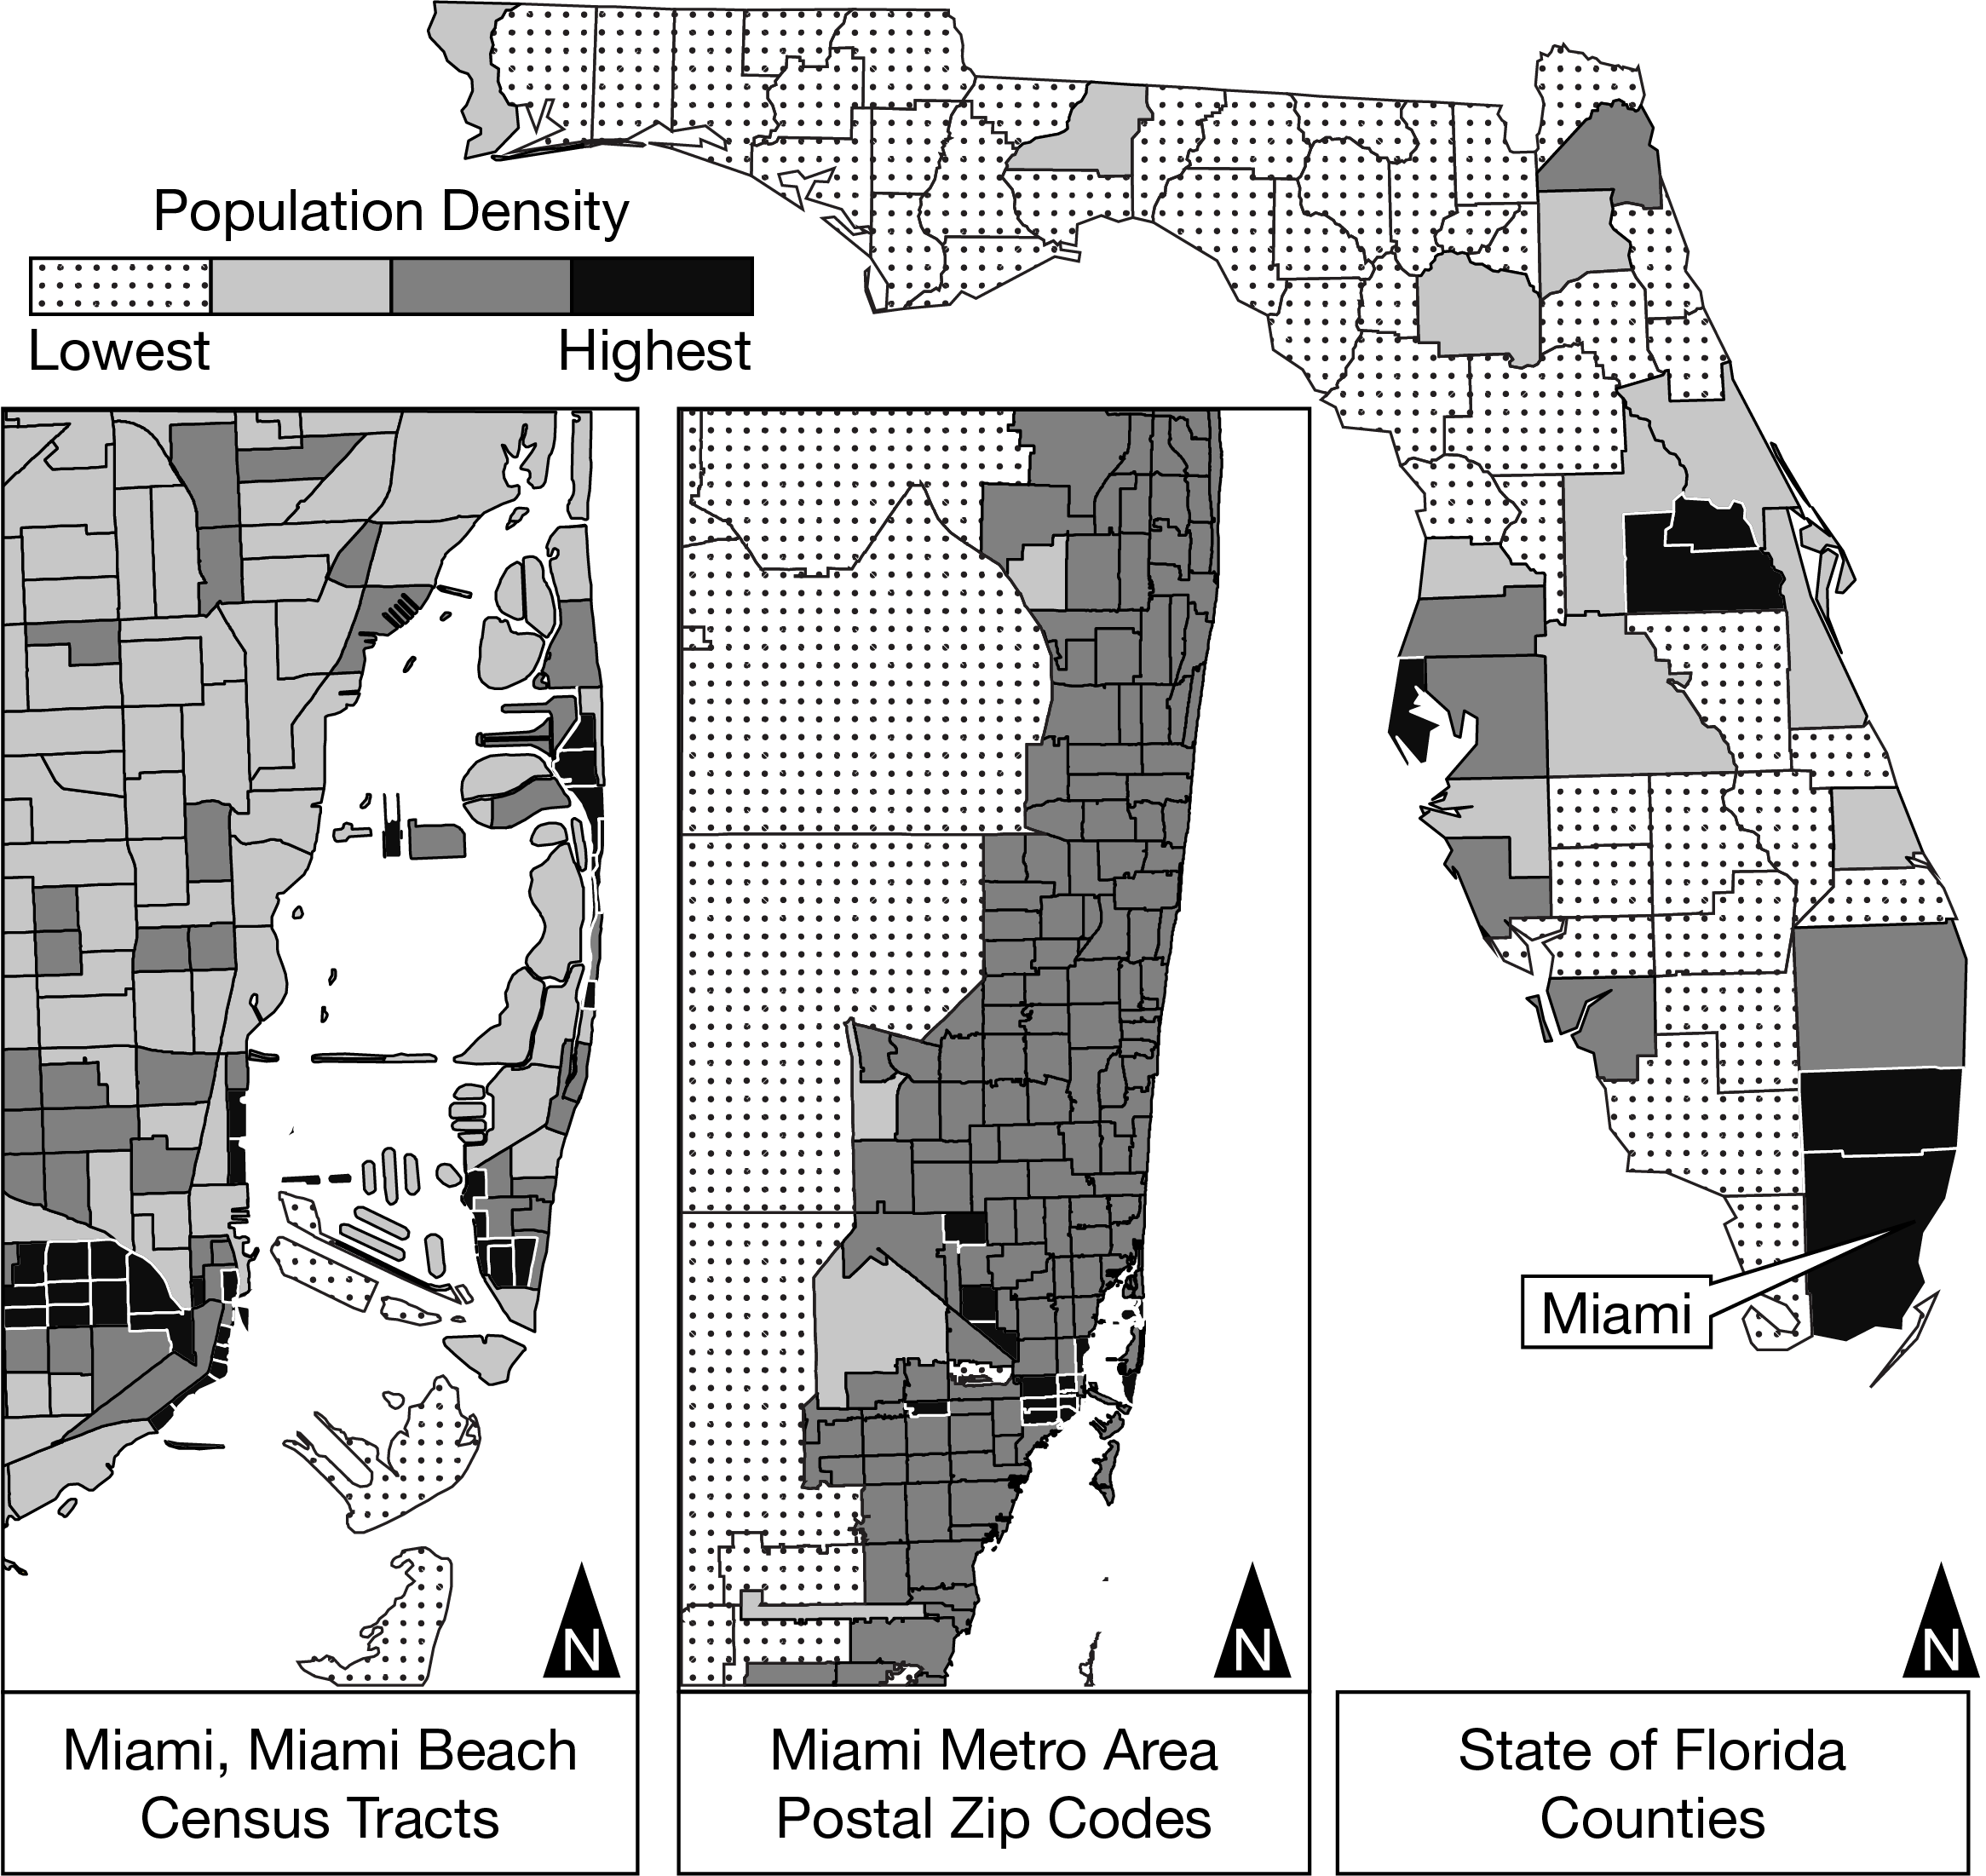
Which of the following identifies how population density is shown in the maps?
At different scales, showing administrative units
Which of the following is the best describes an example of transhumance?
Shepherds in France who move their sheep to mountain pastures each summer
Which of the following processes best explains a decrease in mortality rates worldwide?
Better hygiene and sanitation practices

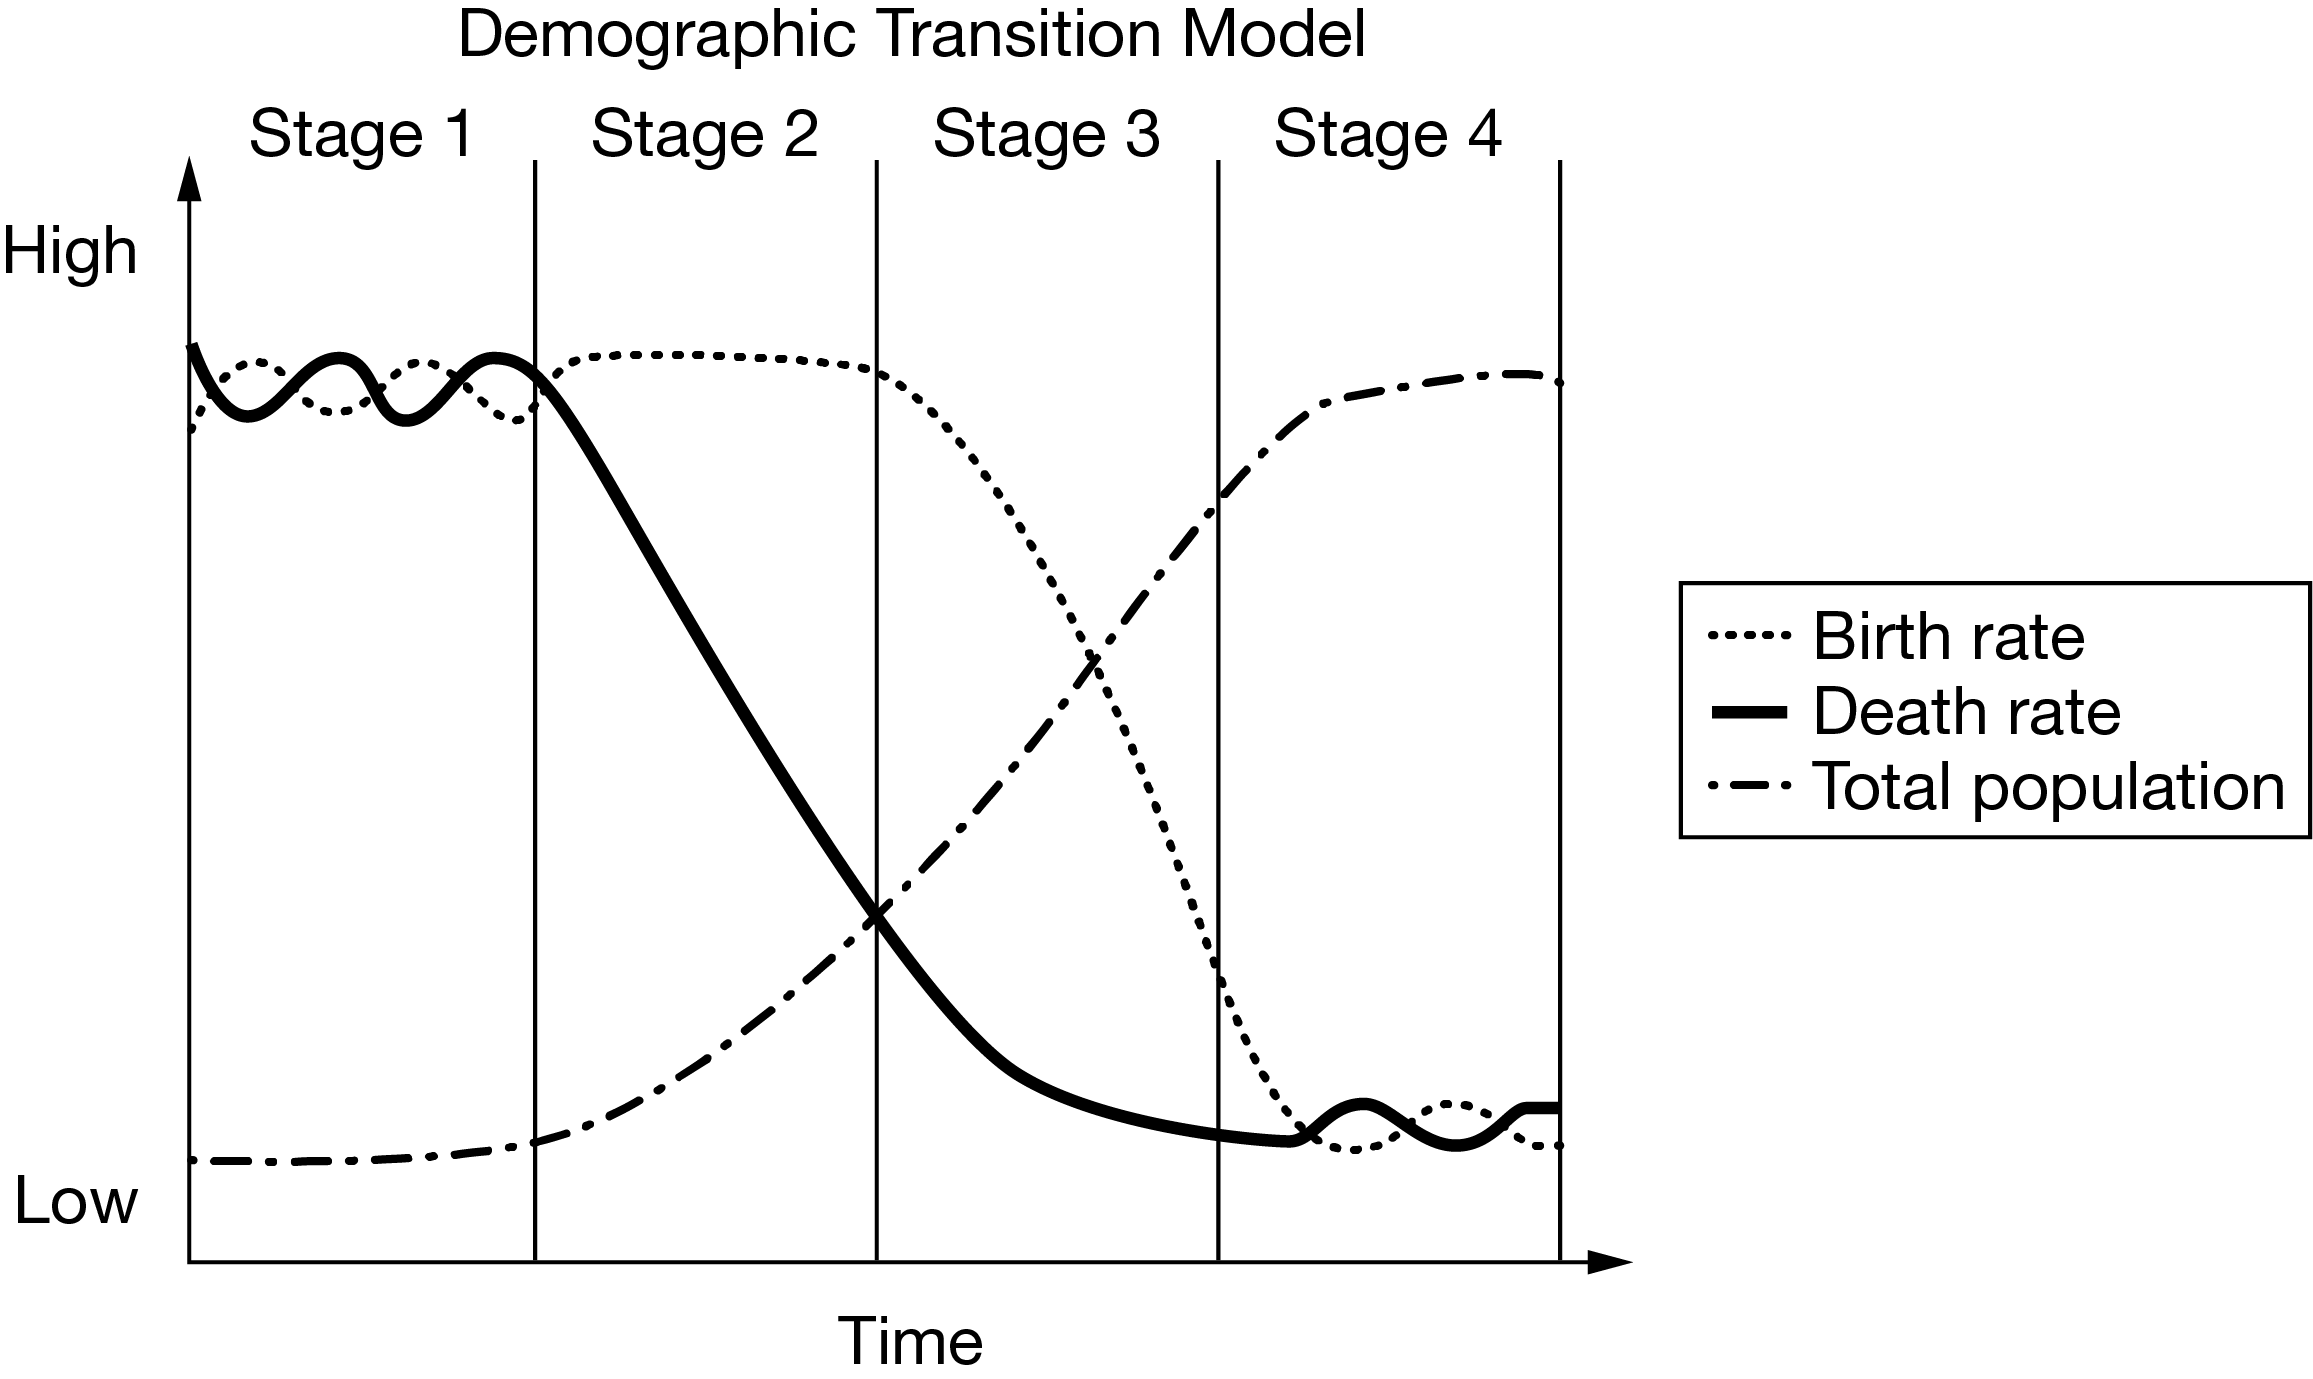
Based on the demographic transition model, which region is best described as exhibiting overall negative rates of growth in stage 4?
Eastern Europe
Deaths in Country A often occur due to outbreaks of epidemic disease, while in Country B most people are dying from chronic disorders such as heart disease. Which of the following best describes where these countries fall in the demographic transition model and in which region they are likely located?
Country A : Stage 2, West Africa; Country B : Stage 4, western Europe
Neo-Malthusian theory can be used to explain which of the following situations?
South Sudan experienced famine during the twenty-first century as a result of war and drought.
South Korea, as of 2018, has the lowest total fertility rate in the world at 1.1. Which of the following best explains a population policy South Korea could enact to promote higher birth rates?
Decreasing the cost of childcare so that families can afford to have more children
Many countries in sub-Saharan Africa have total fertility rates that exceed 5.0. Which of the following population characteristics is associated with this phenomenon?
High youth-dependency ratio
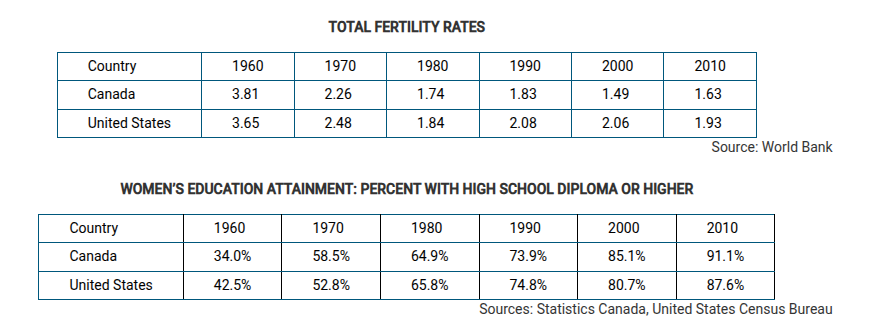
Based on the data shown in the tables, which of the following best describes the relationship between fertility and education in the United States and Canada?
The increase in the percent of women who are more highly educated correlates with the decline in fertility.
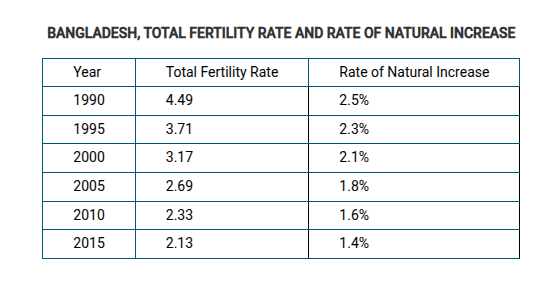
Bangladesh has seen its total fertility rate drop to 2.1, but its population is projected to be higher in 2050 than it is today. Which of the following explains why Bangladesh will continue to experience positive rates of natural increase?
Bangladesh’s population will continue to grow as a result of a large youthful population.
Which of the following explains an impact of open-border policies regarding migration within the European Union?
Growing political tensions as immigration increases, due to competition between immigrants and local people for available jobs
From 2010 through 2017 there was a large increase in the number of migrants from Africa to Europe. Which of the following explains a possible impact on the emigrant countries of origin during and after that time period?
As more emigrants sent money home, the influx of money created an economic boom in the countries of origin.
Immigration of asylum applicants from Africa to the European Union, Norway, and Switzerland increased from approximately 50,000 in 2010 to approximately 200,000 in 2016. In 2017, there were approximately 175,000 asylum applicants. Which of the following best explains the trend in asylum seekers from African countries to Europe since 2010?
Political instability and conflict along with high fertility levels over the long term has led to an increase in asylum seekers.
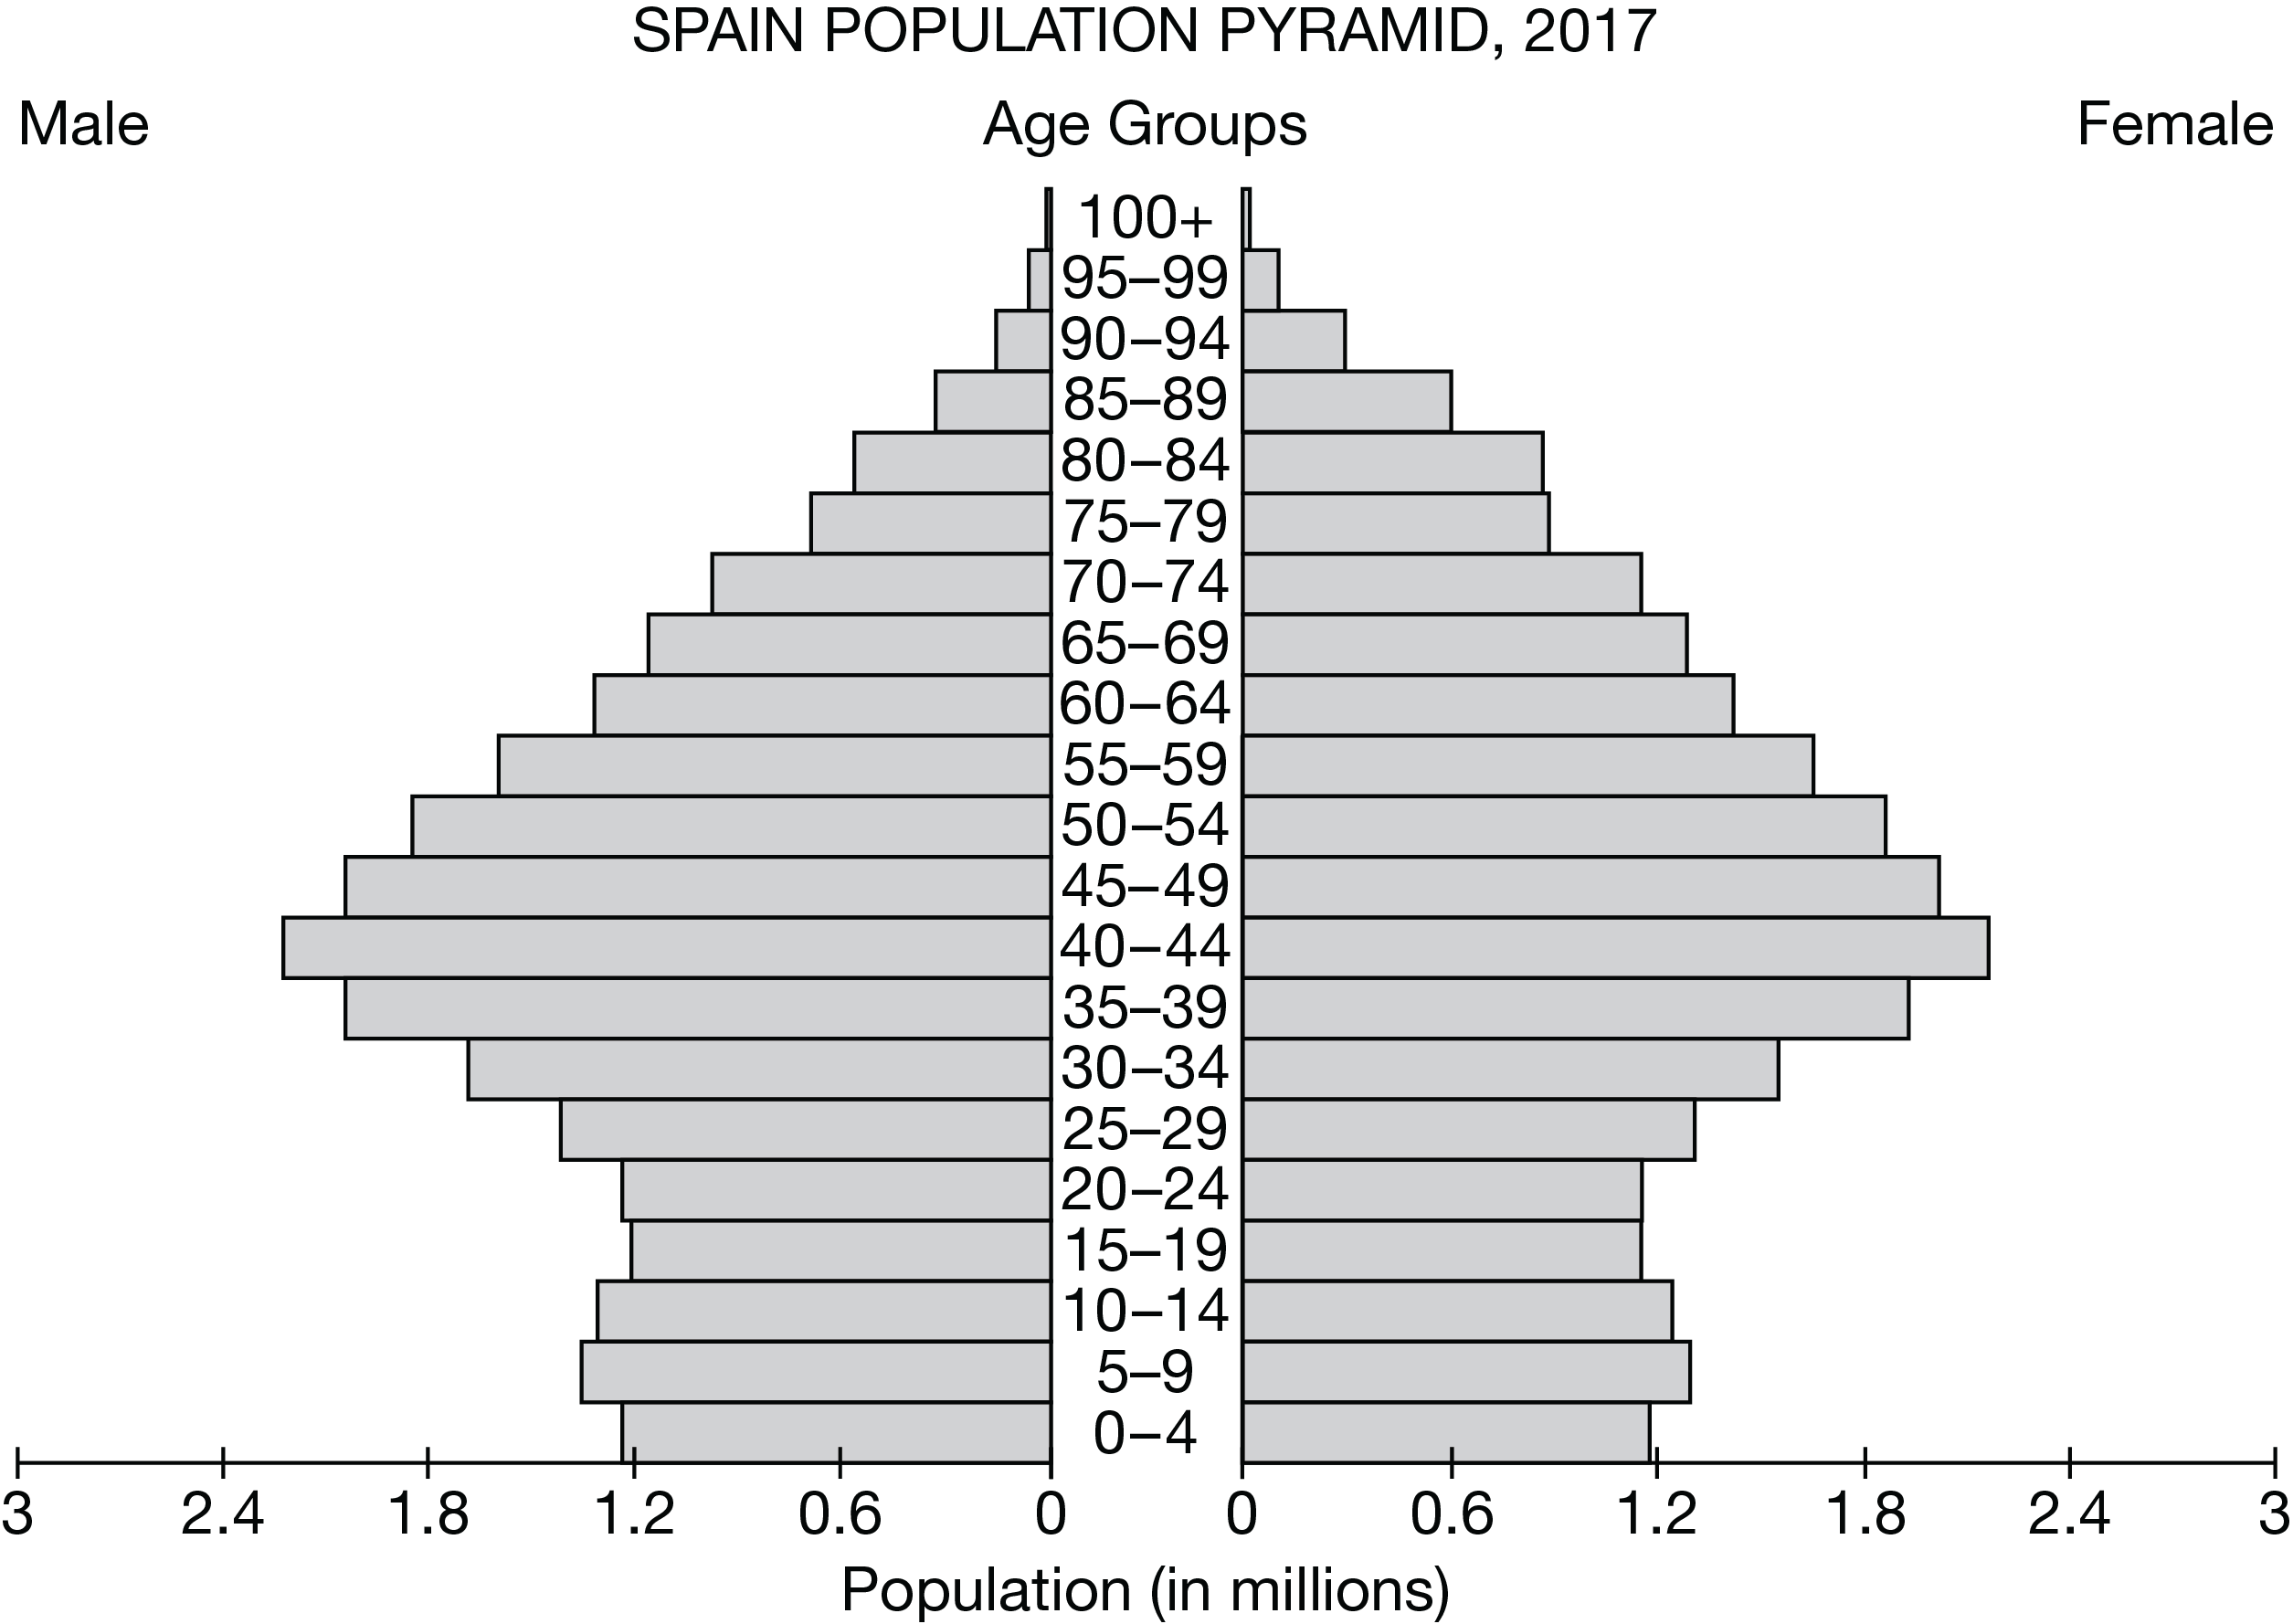
Which of the following explains how data from the population pyramid for Spain would be useful for government policy makers?
Data on the size of the middle-aged population would be used to plan for retirement and social security benefits.
In 1980 China implemented an antinatalist one-child policy. Which of the following explains an unintended consequence of the policy?
There are more men than women because of a cultural preference for male children.
Malthusian theory would explain which of the following possible consequences of high birth rates in a less developed country?
Famine and starvation will occur as demand outpaces agricultural production.
Which of the following scenarios explains a demographic push factor for less developed countries?
A large youth population, lacking educational opportunities, seek schooling in more developed countries.
Japan has a low birth rate and a high life expectancy. Which of the following explains why Japan will struggle with demographic challenges in 30 years?
An aging population needing health care will require more public funding.
A country develops new technologies for farming, which help stabilize and increase food supply. According to Malthusian theory, which of the following would best explain those results?
The new technologies would reduce positive checks on population
From 2010 through 2017 there was a large increase in the number of migrants from Africa to Europe. Which of the following explains a possible impact on the emigrant countries of origin during and after that time period?
Political instability and conflict along with high fertility levels over the long term has led to an increase in asylum seekers.
Many European countries provide families one or more of the following: tax credits, flexible parental leave, monthly payments, public-transportation fare reduction, free vaccines, and subsidized childcare.
Which of the following would explain why a country such as Belgium would implement the described policies?
Belgium has concerns about an aging population and wants to encourage higher birth rates.
Which of the following describes forced migration?
British convicts shipped to Australia in the mid-eighteenth to mid-nineteenth centuries
Which of the following population patterns is common in more developed countries?
Declining levels of fertility and mortality, leading to older age structures

Which of the following statements accurately explains the population dynamics of a country on the table shown?
Germany has a negative rate of natural increase.

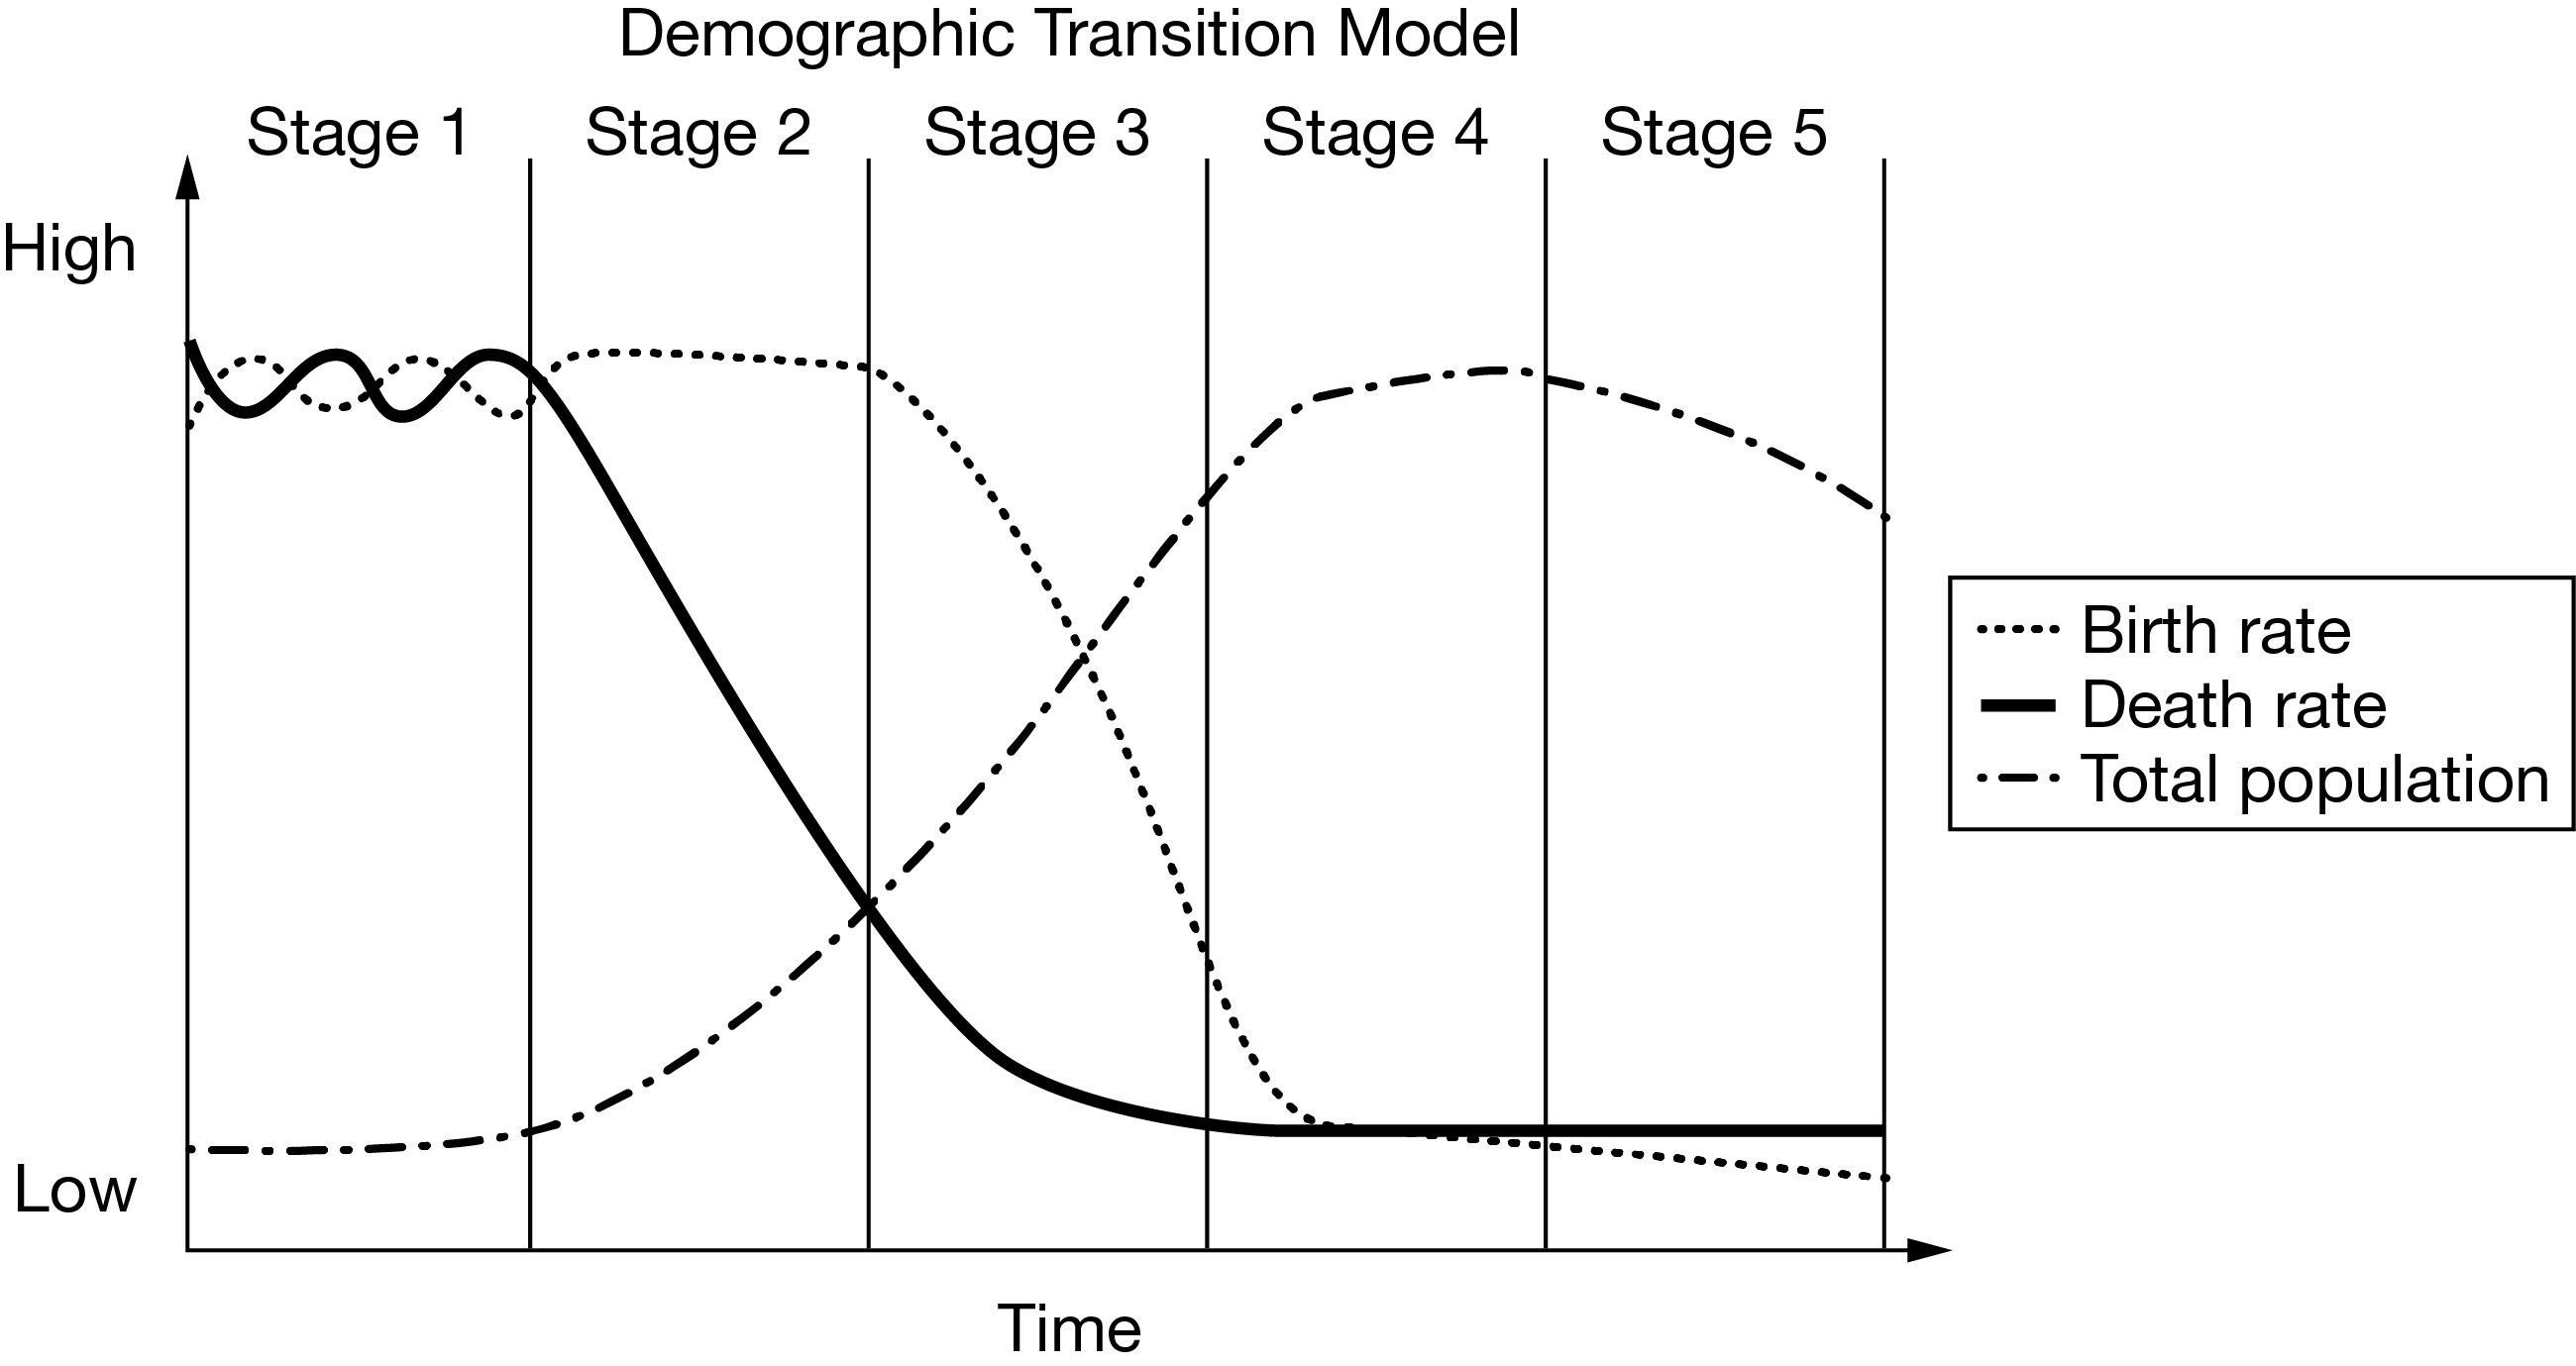
Based on the diagram of the demographic transition model, which of the following correctly describes the expected population change over time?
As birth rates are higher than death rates, population growth remains high.
A population pyramid that is wide at the top and narrow at the bottom most likely represents which of the following populations?
A population of retirees
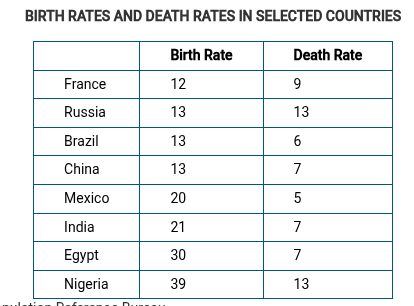
Using the data shown in the table, which of the following most accurately describes the changing role of women in different parts of the world?
The relatively low death rate for Mexico indicates that women may have increased access to health care.
Which of the following countries is best described as being at Stage 3 of the demographic transition model?
Bolivia: birth rate = 24 , death rate = 7
Which of the following best explains a possible limitation of the trends assumed from the population pyramid and estimates in the data table?
Labor shortages may cause the government to reduce the legal barriers to immigration, and immigrant populations could increase the working-age cohorts.
Even though total fertility rates have been declining in some less-developed countries, the total population has continued to grow. This is primarily because a high percentage of the population is
under the age of 15

Which of the following describes a characteristic of a country moving from stage 2 to stage 3 of the demographic transition model?
Declining death rate
Which of the following types of migration are correctly explained by the example given?
International migration and voluntary migration: Family A from Mumbai has convinced their close friends Family B to emigrate to London as they did in order help start up their business.
Since the 1970s changes in the social roles, lifestyles, and employment patterns of women in Europe, Canada, and the United States have affected the overall population through which of the following?
Decreased fertility rates

Which of the following statements best describes how the epidemiologic transition affects the demographic transition?
Improvements in nutrition, sanitation, and health care cause death rates to fall in stage 2 of the demographic transition.
Which of the following best explains why, in the late eighteenth and early nineteenth centuries, Thomas Malthus proposed his population theory?
Malthus theorized that, if left unchecked by regular cycles of famine and misery, population would increase beyond the ability to feed itself.
A high level of mobility for international migration and employment is best explained by which of the following demographic groups?
Unmarried men in their late twenties with no children and a university education
Which factor is most responsible for the increase in Japan’s dependency ratio?
An increase in life expectancy
In the first decade of the twenty-first century, which of the following countries had the lowest fertility rate?
South Africa
Physiological population density is viewed as a superior measure of population density for which of the following reasons?
It is more reflective of population pressure on arable land.
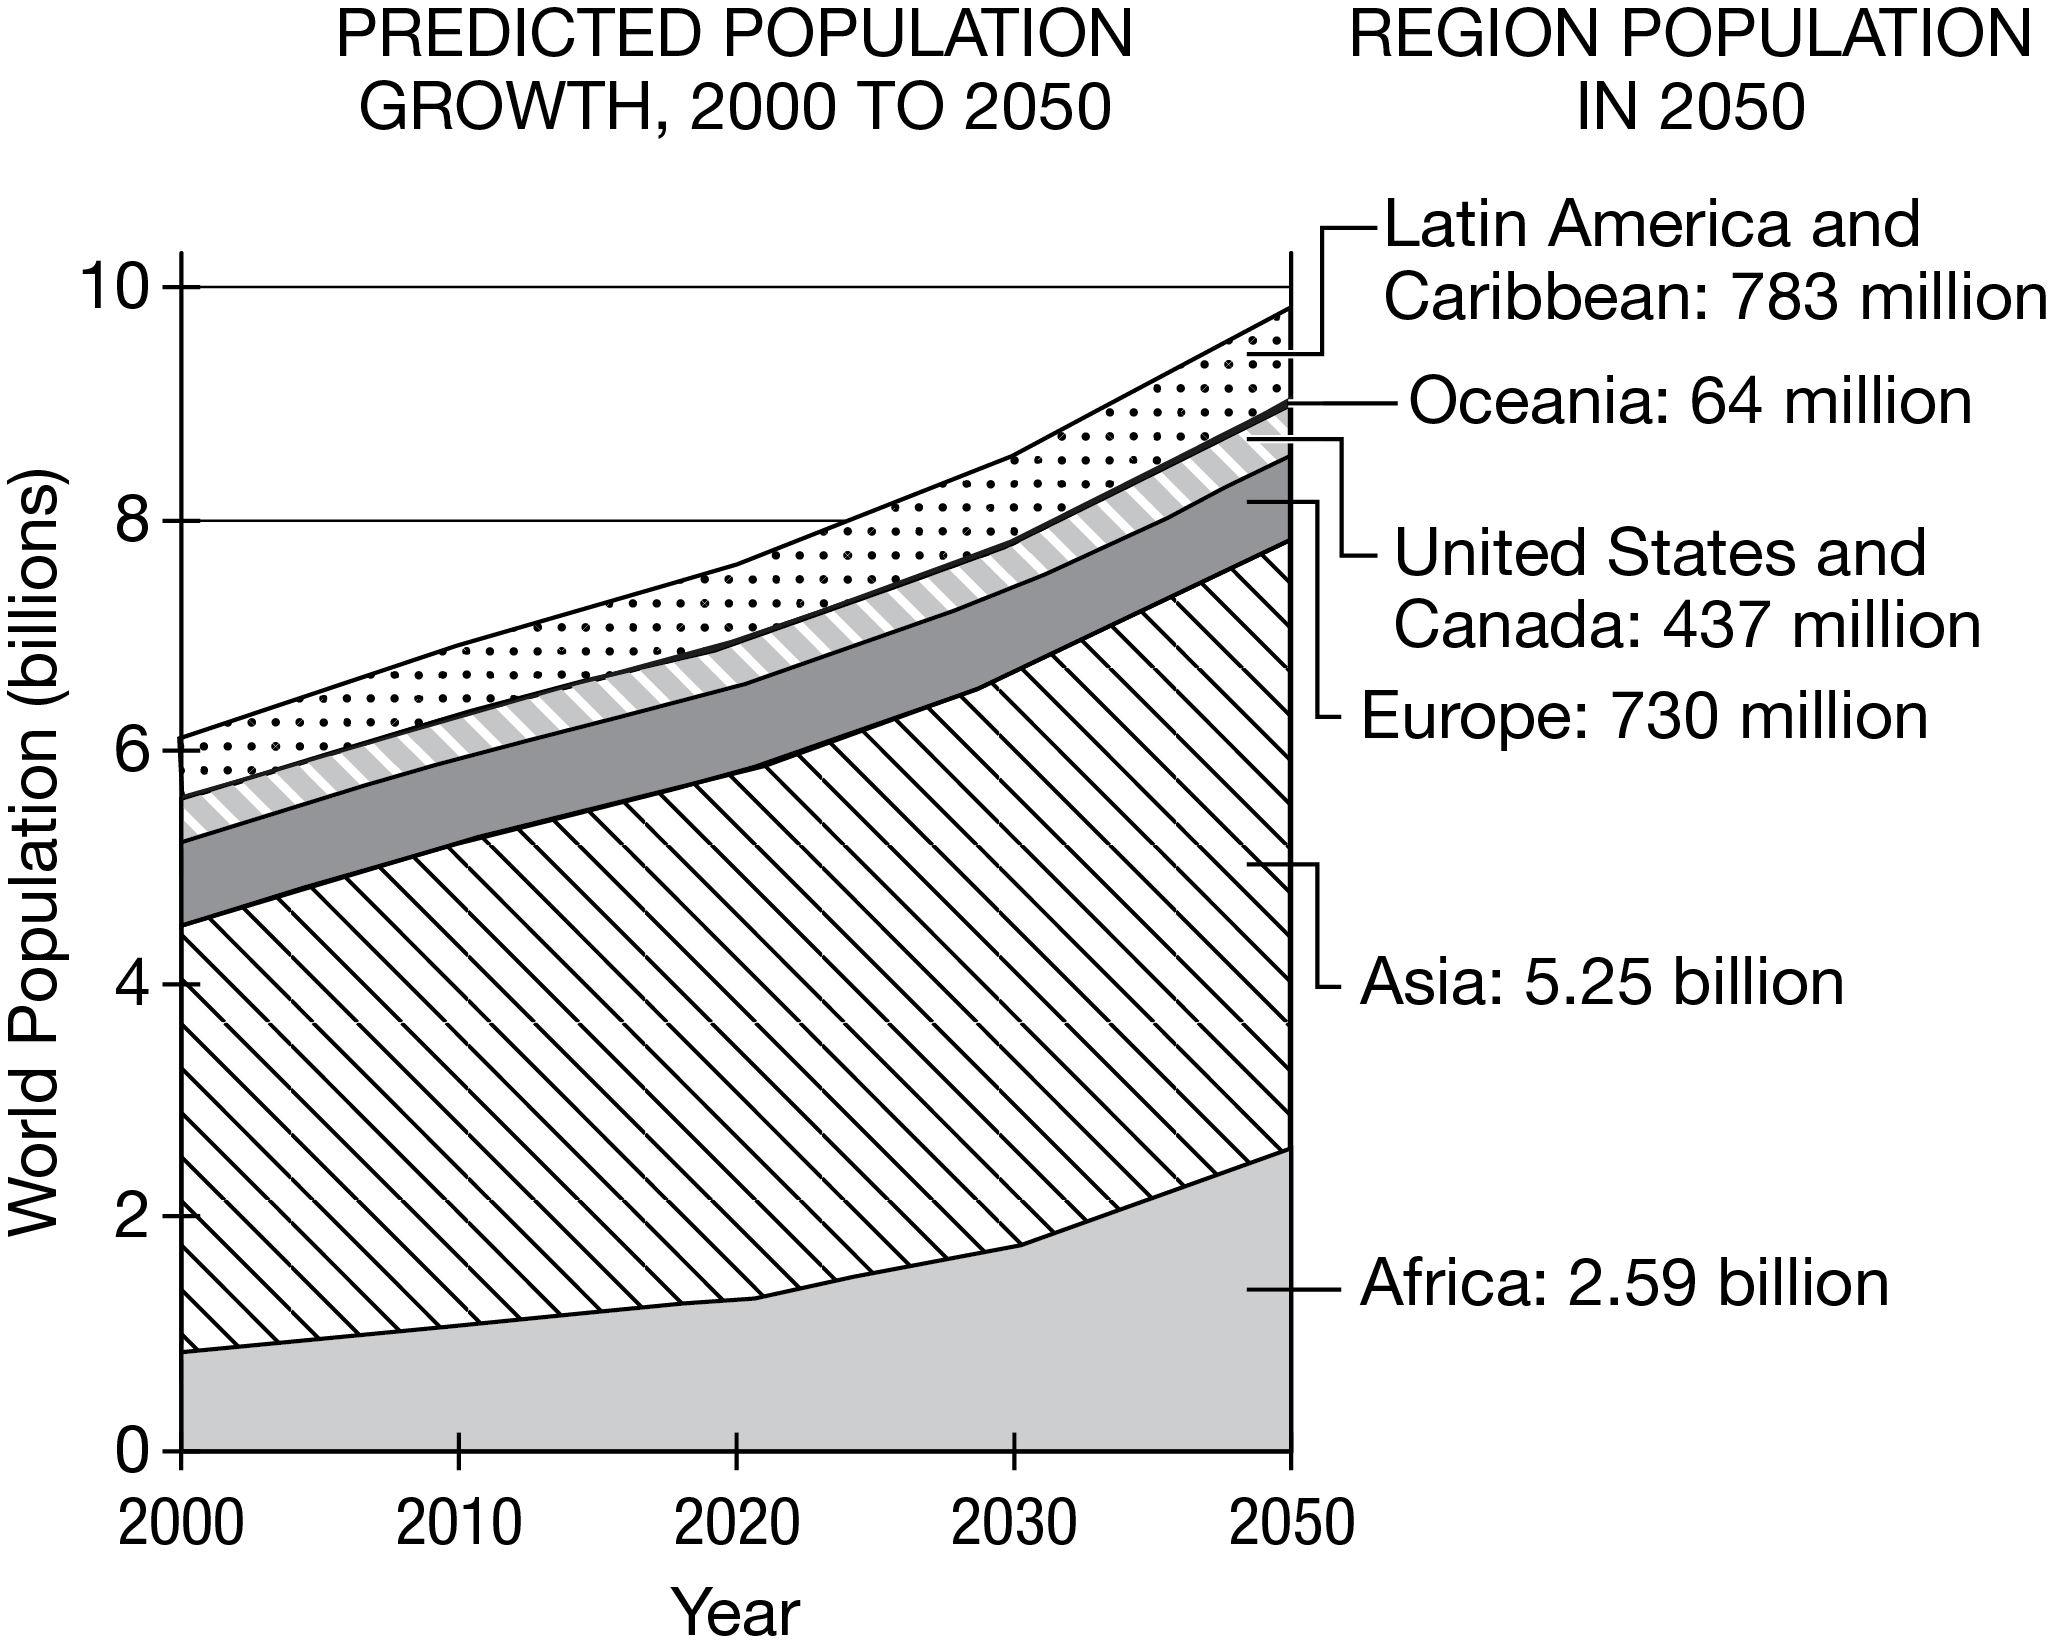
Based on the graph, predicted population growth in which of the following regions is explained by a high total fertility rate?
Africa
Based on the data shown in the table, which of the following accurately describes changes in the roles of women as countries develop economically?
More women work in professional jobs
One would expect to find a population with a relatively young age structure in
less developed countries