taxation and redistribution
1/29
Earn XP
Description and Tags
Name | Mastery | Learn | Test | Matching | Spaced |
|---|
No study sessions yet.
30 Terms
– P,m/P,c > 𝑀𝑅?
you get more utility buying fewer cakes and
more movies.
Substitution effect
Holding utility constant, a relative rise in
the price of a good will always cause an individual to choose
less of that good.
Income effect
A rise in the price of a good will typically cause
an individual to choose less of all goods because her income
can purchase less than before.
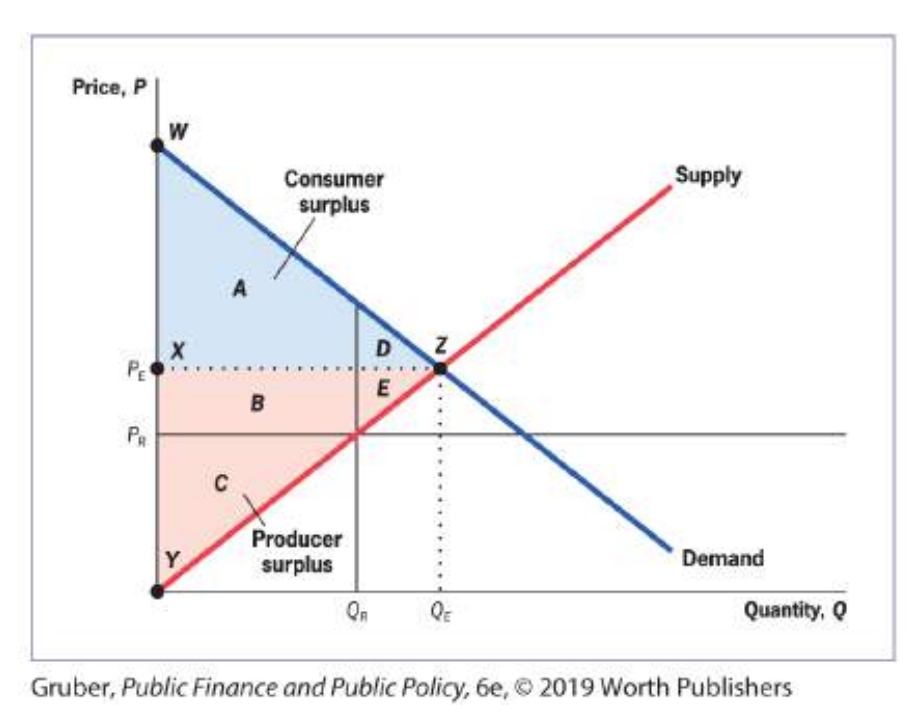
Social efficiency
Social efficiency represents the net gains to society from all
trades that are made in a market, and it consists of the sum of
two components: consumer and producer surplus. Also called
total social surplus.
• Consumer surplus: The benefit that consumers derive from
consuming a good, above and beyond the price they paid for
the good.
• Producer surplus: The benefit that producers derive from
selling a good, above and beyond the cost of producing that
good.
Social surplus
Social surplus for this market in equilibrium is the sum of the
shaded areas A + B + C + D + E
Explain why a consumer’s optimal choice is the point at which her budget constraint is
tangent to an indifference curve.
Consumers optimize their choice when they are on the highest possible indifference curve given
their budget constraint. Suppose a consumer’s choice is feasible (on the budget constraint) but not
at a tangency, as at point A in the accompanying figure. Under these circumstances, the budget
constraint must pass through the indifference curve where it intersects the chosen point. There
must then be at least a segment of the budget constraint that lies above (up and to the right of)
the indifference curve associated with that choice. Any choice on that segment would yield higher
utility. Only when no part of the budget constraint lies above the indifference curve associated with
a consumer’s choice are no feasible improvements in utility possible. The single tangency point (C
in the figure) is the only point at which this occurs.
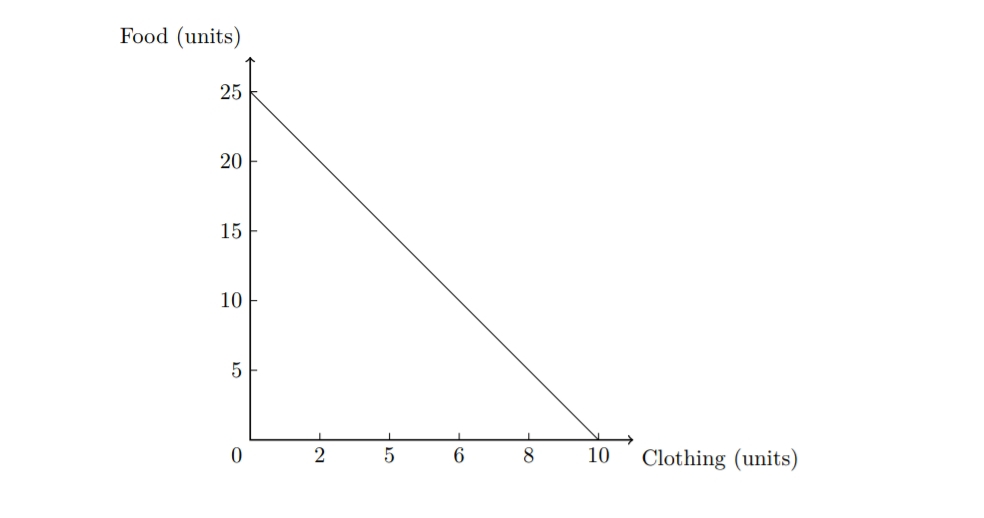
You have $100 to spend on food and clothing. The price of food is $4 and the price
of clothing is $10.
First we determine the maximum amounts of food and clothing we can obtain if we buy only one
good. These values represent our intercept points.
Suppose a nation has a tax rate of 10% on the first $10,000 of taxable income, then 15% on the next $20,000, then 20% on the next $30,000, and 30% on all taxable income above $60,000. There is a $4,000 exemption per family member. Anand’s family has eight members and earns $80,000 per year. What is his family’s average tax rate?
9.5%
Gross income: 80 000
Exemptions: 4 000 per household member
8 household members
Taxable income = Gross income – Exemptions = 80 000 – 8 4 000 = 80 000 – 32 000 = 48 000
Taxable income
First 10 000 of taxable income: tax rate is 10% Taxes: 10 000 0.1 = 1 000
Next 20 000 of taxable income: tax rate is 15% Taxes: 20 000 0.15 = 3 000
Last 18 000 of taxable income: tax rate is 20% Taxes: 18 000 0.2 = 3 600
Total taxes: 1 000 + 3 000 + 3 600 = 7 600
Average tax rate: total taxes / gross income = 7 600 / 80 000 = 0.095 9.5%
Entertainment Budget
You have $4,000 to spend on entertainment this year (lucky you!). The price of a day trip (T) is $40 and the price of a pizza and movie (M) is $20.
Utility Function
Suppose that your utility function is:
U(T, M) = T3/4 M1/4
Question
What combination of T and M will you choose?
You take 75 trips and go on 50 movie-and-a-pizza evenings.
(T=75 and M=50).
Entertainment Budget
You have $4,000 to spend on entertainment this year (lucky you!). The price of a day trip (T) is $40 and the price of a pizza and movie (M) is $20.
Utility Function
Suppose that your utility function is:
U(T, M) = T3/4 M1/4
Question
What combination of T and M will you choose?
Suppose that the price of day trips rises to $50. How will this change your decision?
T=60 and M=50
Consider a free market with:
Demand: Q = 900 - 10P
Supply: Q = 20P
Questions
What is the value of consumer surplus?
What is the value of producer surplus?
CS=18.000 and PS=9.000 and TS=27.000
Consider a free market with:
Demand: Q = 900 - 10P
Supply: Q = 20P
Now the government imposes a $15 per unit subsidy on the production of the good.
Consumer Surplus
What is the consumer surplus now?
Producer Surplus
What is the producer surplus?
Deadweight Loss
Why is there a deadweight loss associated with the subsidy, and what is the size of this loss?
Note that the area of the deadweight loss is the area of the cost of subsidy that was not transferred to either consumer surplus or producer surplus.
Key Data Points
Consumer Surplus (CS): 24,500
Producer Surplus (PS): 12,250
Cost of Subsidy: 10,500
Total Surplus (TS): 26,250
Deadweight Loss (DL): 750
You are hired by the government to evaluate the impact of a policy change that affects one group of individuals but not another. Before the policy change:
Affected group: averaged $17,000 in earnings
Unaffected group: averaged $16,400 in earnings
After the policy change:
Affected group: averaged $18,200 in earnings
Unaffected group: averaged $17,700 in earnings
The question here is one of differences in changes: both groups experienced a change in earnings, but it is not immediately obvious whether either group experienced a bigger change. The appropriate approach to estimate the impact on each group is called a difference-in-difference approach.
Calculating Differences
Here are the calculations for each group:
Treatment group difference: 18.200 - 17.000 = 1.200
Control group difference: 17.700 - 16.400 = 1.300
Conclusion: We estimate that the impact of the policy change was to lower earnings by $100.
Your state introduced a tax cut in the year 2021. You are interested in seeing whether this tax cut has led to increases in personal consumption within the state. You observe the following information:
Consumption Data
Year | Consumption in Your State |
|---|---|
2016 | 330 |
2018 | 350 |
2020 | 370 |
2022 | 430 |
Discussion
Your friend argues that the best estimate of the effect of the tax cut is an increase in consumption of 60 units. However, you think that the true effect is smaller because consumption was trending upward prior to the tax cut. What do you think is a better estimate?
Prior to the tax cut, there was a steady increase in consumption of 20 units every two years. If that trend had continued, and there had not been a tax cut, you might have predicted that consumption in 2024 would be 390. The actual consumption was 430, so an argument could be made that the additional increase of 40 units can be attributed to the tax cut, over and above the general trend.
Your state introduced a tax cut in the year 2021. You are interested in seeing whether this tax cut has led to increases in personal consumption within the state. You observe the following information:
Consumption Data
Year | Consumption in Your State |
|---|---|
2016 | 330 |
2018 | 350 |
2020 | 370 |
2022 | 430 |
Suppose that you find information on a neighboring state that did not change its tax policy during this time period. You observe the following information in that state:
Consumption in Neighboring State
2016: 300
2018: 320
2020: 340
2022: 350
Estimating the Effect of the Tax Cut
Given this information, what is your best estimate of the effect of the tax cut on consumption?
Required Assumptions
What assumptions are required for that to be the right estimate of the effect of the tax cut? Explain.
This new information suggests that growth in consumption would have been slower than the past trend indicates if there had been no tax cut. The neighboring state saw its growth rate fall between 2020 and 2022 relative to earlier years. We can make use of a difference-in-difference estimate, using the neighboring state as a control.
Difference-in-Difference Estimates
Here are the key figures:
2020-2022 difference in consumption in your state: 60
2020-2022 difference in consumption in neighboring state: 10
Difference-in-difference estimate: 60 - 10 = 50
We therefore estimate that the tax cut increased consumption by 50 units.
Conditions for Accuracy
For this estimate to be correct, the following must be true:
Trends in the two states would have been the same except for the tax cut in your state.
Common trends prior to the tax cut suggest this, but do not guarantee it.
Other consumption-affecting policy changes could make the estimates incorrect.
Sudden changes in employment or other factors in the neighboring state could also affect the estimate.
The difference-in-difference estimate relies on no such sudden changes occurring in state-specific consumption trends.
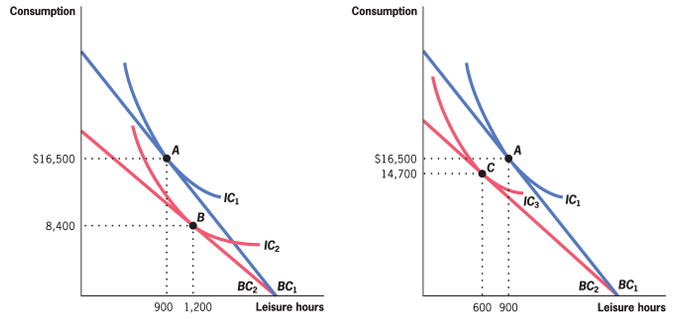
Which one is the substitution effect and which one is the income effect? And explain: When do people increase their work hours?
A tax shifts the budget constraint inward from BC1 to BC2. If the substitution effect of the change in the after-tax wage is larger, work is less attractive, and Taylor chooses to have more leisure. If the income effect is larger, Taylor feels poorer and thus reduces her leisure (increases her work hours) in order to regain some of that lost income.
Left one is the substitution effect
Right one was the income effect..
Which of these is FALSE concerning taxes on labor supply?
a) Increasing taxes induces a substitution effect, which decreases labor.
b) Increasing taxes induces an income effect, which increases labor.
c) Studies generally show that the net effect of a change in taxes on labor force participation is negligible.
d) The elasticity of labor supply determines the net effect of a change in taxes on labor force participation
c) Studies generally show that the net effect of a change in taxes on labor force participation are negligible. (correct answer)
1. The nation of Fishkasar has a tax rate of 5% on the first 20 000 walops (the national currency) of taxable income, then 20% on the next 30 000 walops, then 50% on all taxable income above 50 000 walops. Fishkasar provides a 5 000-walop exemption per family member.
a) Jamil’s family has three members and earns 60 000 walops per year. Calculate the family’s marginal and average tax rates.
MRS = 50% and average 10%.
Calculating Taxable Income
The first step is to compute Jamil’s family’s taxable income. Before exemptions, their income is 60,000.
Exemptions
They receive a 5,000 exemption for each of the three family members, totaling 15,000 in exemptions.
Hence, taxable income is calculated as:
60,000 - 15,000 = 45,000
Since this is between 20,000 and 50,000, the family faces a 20% marginal tax rate.
Calculating Average Tax Rate
To compute the average tax rate, first compute the total tax liability.
Tax Calculation
The first 20,000 of taxable income is taxed at 5%. The next 25,000 is taxed at 20%.
The total tax is thus:
(0.05 · 20,000) + (0.2 · 25,000) = 1,000 + 5,000 = 6,000
Average Tax Rate Calculation
The average tax rate is calculated by dividing the total tax paid by gross income and multiplying by 100% to obtain a percentage value:
ATR = total tax / gross income · (100%)
The average tax rate is then:
(100%) · 6,000 / 60,000 = 10%
The nation of Fishkasar has a tax rate of 5% on the first 20 000 walops (the national currency) of taxable income, then 20% on the next 30 000 walops, then 50% on all taxable income above 50 000 walops. Fishkasar provides a 5 000-walop exemption per family member.
b) Boba’s family has five members and earns 100 000 walops per year. Calculate the family’s marginal and average tax rates.
Boba’s Family Tax Calculation
Taxable Income: Boba’s family’s taxable income is calculated as follows:
100,000 − (5 · 5,000) = 75,000
Since this amount is greater than 50,000, the family is in the 50% marginal tax bracket.
Total Tax Liability
The family’s total tax liability is calculated as:
(0.05 · 20,000)
(0.2 · 30,000)
(0.5 · 25,000)
This results in a total of: 19,500
Average Tax Rate
The average tax rate is thus calculated as:
(100%) · 19,500 / 100,000 = 19.5%
The nation of Fishkasar has a tax rate of 5% on the first 20 000 walops (the national currency) of taxable income, then 20% on the next 30 000 walops, then 50% on all taxable income above 50 000 walops. Fishkasar provides a 5 000-walop exemption per family member.
c) Suppose that Fishkasar changed its tax code to a flat tax of 30% with a 10 000-walop per family member exemption. Would this change in the tax system make the system more progressive, more regressive, or neither?
Marginal Rate Schedule Analysis
The flattening of the marginal rate schedule tends to make this change less progressive. The flat 30% marginal rate structure is not progressive at all: any two families with positive taxable income will face the same marginal tax rate, regardless of their income.
Impact of Exemption Increase
On the other hand, the increase in the per-family-member exemption tends to make the average rates more progressive. For simplicity, consider two single-member households with incomes of 11,000 and 15,000 walops, respectively:
Under the old system:
First household: average tax rate of 300/11000 ≈ 2.7%
Second household: average tax rate of 500/11000 ≈ 2.7%, 15000 ≈ 3.33%
Under the new system:
First household: average tax rate of 30%·1000/11000 = 2.7%
Second household: average tax rate of 30%·5000/15000 = 10%
Thus, the new system is more progressive in this income range.
Ed and Wendy are a married couple with no children. Each earns 75 000 per year, and their combined household adjusted gross income is 150 000. John and Kristen also have 150 000 in combined household adjusted gross income and no children. However, Kristen earns all of the income; John does not work. [Note: To answer this question, you may need to look up some tax rates for individuals with different filing status. These can be found on: https://taxfoundation.org/data/all/federal/2024-tax-brackets/.
a) Use the 2024 tax rates for married couples filing jointly to compute how much income tax each couple owes. Assume that both take the standard deduction of 14600 for individual filing and 29200 for joint filing.
Tax Calculation for Married Couples Filing Jointly
The standard deduction for married couples filing jointly is $29,200. Hence, each family has a taxable income of:
Taxable Income Calculation: $150,000 - $29,200 = $120,800.
Tax Rates from the 2024 IRS Schedule
Referring to the 2024 income tax rate schedule from the IRS, each pays:
10% tax on the first $23,200 of taxable income
12% tax on taxable income from $23,201 to $94,300
22% tax on taxable income from $94,301 and above
Total Tax Liability Calculation
Their total tax liability is therefore calculated as:
Total Tax Liability:
0.1 · $23,200 + 0.12 · ($94,300 − $23,200) + 0.22 · ($120,800 − $94,300) = $16,682
Ed and Wendy are a married couple with no children. Each earns 75 000 per year, and their combined household adjusted gross income is 150 000. John and Kristen also have 150 000 in combined household adjusted gross income and no children. However, Kristen earns all of the income; John does not work. [Note: To answer this question, you may need to look up some tax rates for individuals with different filing status. These can be found on: https://taxfoundation.org/data/all/federal/2024-tax-brackets/.
b) Does either couple pay a “marriage tax?” Does either couple receive a “marriage benefit?”
Tax Liability for Ed and Wendy
Ed and Wendy each earn $75,000. If they were single, their taxable income would be:
Taxable income: $75,000 - $14,600 = $60,400 (standard deduction for a single taxpayer)
Tax Rates
Referring to the 2024 income tax rate schedule from the IRS, each would pay:
10% tax on the first $11,600 of taxable income
12% tax on taxable income from $11,601 to $47,150
22% tax on the rest of their taxable income
Total Tax Liability
Ed and Wendy would each have a total tax liability of:
Calculation: 0.1 · 11,600 + 0.12 · (47,150 - 11,600) + 0.22 · (60,400 - 47,150) = $8,341
Together, their total tax paid would be:
Total: 2 · $8,341 = $16,682
Since this is exactly the same as they would have paid if they were married, Ed and Wendy neither pay a marriage tax nor receive a marriage benefit.
Tax Liability for John and Kristen
If John and Kristen were single, only Kristen would pay any tax. Her taxable income would be:
Taxable income: $150,000 - $14,600 = $135,400
Tax Rates
Kristen would pay:
10% tax on the first $11,600
12% tax on taxable income from $11,601 to $47,150
22% tax on taxable income from $47,151 to $100,525
24% tax on the rest of her taxable income
Total Tax Liability
Her total tax liability would therefore be:
Calculation: 0.1 · 11,600 + 0.12 · (47,150 - 11,600) + 0.22 · (100,525 - 47,150) + 0.24 · (135,400 - 100,525) = $25,538.50
This is substantially higher than what John and Kristen would pay when married. So, John and Kristen receive a sizable marriage benefit.
The government of Utopia plans to offer a transportation tax credit in which families receive a share of their expenditures on transportation to and from work or school as a reduction in their tax bill. Utopia is considering two forms of this tax credit, one that is fully refundable and one in which the tax credit is limited to the amount of taxes the family pays. Which form of the tax credit is more progressive? Explain.
It is more progressive to allow for a refundable tax credit than to limit the credit to taxes actually paid. Unless a tax credit is fully refundable, families whose incomes are so low that they do not owe any income taxes do not receive the credit. Critics of refundable tax credits might claim that it isn’t a tax refund if you haven’t paid taxes in the first place, but this is not quite correct. Everyone pays some taxes, whether in the form of sales taxes when they purchase goods or in the form of increased prices when taxes are passed through to the consumer. Thus, a fully refundable tax credit sent to families who have not paid income taxes will offset other taxes they have paid.
1. The demand for rutabagas is Q = 2000 − 300P and the supply of rutabagas is Q=−100+100P. Who bears the statutory incidence of a $2 per unit tax on the sale of rutabagas? Who bears the economic incidence of this tax?
Consumer tax burden: 0,50
Producer tax burden: 1,50
Tax Overview
If the tax is on the sale of rutabagas, the buyer bears the statutory incidence, since the “sticker price” of rutabagas does not include the tax. Economic incidence is determined by relative elasticities. To calculate the relative burdens, solve the equilibrium condition with and without the tax.
Price Calculation
First, we set demand and supply equal to each other to calculate the price without the tax:
2000 − 300P = −100 + 100P
400P = 2100
P = 5.25
In this case (without tax), the price that the consumer pays and the price that the producer gets is equal.
Impact of Tax
With the tax, the price that the consumer pays is increased by $2.00. The equilibrium condition is:
2000 − 300(P + 2) = −100 + 100P
2000 − 300P − 600 = −100 + 100P
400P = 1500
P = 3.75
This is the price that the producer will get. On the other hand, the price that the consumer will pay is equal to this price plus the tax: 3.75 + 2 = 5.75.
Tax Burden Calculation
The consumers’ tax burden is calculated as:
Post-tax price that consumer pays: 5.75
Pre-tax price that consumer pays: 5.25
Consumer tax burden: 5.75 − 5.25 = 0.50
The producers’ tax burden is calculated as:
Pre-tax price that producer gets: 5.25
Post-tax price that producer gets: 3.75
Producer tax burden: 5.25 − 3.75 = 1.50
In this case, the producer bears a larger share of the tax burden than the consumer, despite the statutory incidence falling on the consumer.
The demand for football tickets is Q = 360−10P and the supply of football tickets is Q =20P. Calculate the gross price paid by consumers after a per-ticket tax of $4. Calculate the after-tax price received by ticket sellers.
12$
Tax Impact on Prices
For this answer, it does not matter whether the tax is added to the price paid by the consumers or subtracted from the price the sellers keep.
Example of Tax Addition
Adding the tax to the consumers’ price and setting demand equal to supply yields:
Equation: 360 − 10(P + 4) = 20P
Simplified: 360 − 10P − 40 = 20P
Result: 30P = 320
Price: P = 10.67
Consumers thus pay the equilibrium price + tax for a total of $14.67. Producers receive $14.67, but since the tax is $4, they only keep $10.67.
Without the Tax
In the absence of tax, we have the following situation:
Equation: 360 − 10P = 20P
Result: 30P = 360
Price: P = 12
The price paid by consumers and kept by sellers is $12.
The elasticity of demand for maracas is-2,0 and the elasticity of supply is 3,0. How much will the price of maracas change with a per-unit tax of $2? Who bears the larger burden of the tax, consumers or producers?
Elasticity of Supply and Demand
Elasticity of supply has a greater magnitude than that for demand, indicating that consumers will bear the greater burden. To calculate specific burdens, use the expressions for ∆P given in the appendix, derived from the definitions of elasticity of demand and elasticity of supply.
Calculating Price Change
When a tax is imposed on a consumer, the change in price will be equal to:
∆P = elasticity of demand / (elasticity of supply - elasticity of demand) · tax
Solving for the values given, we have:
P = (-2 / (3 + 2)) · 2 = (0.2 / 5) · 2 = -4/5
Net-of-Tax Price
The net-of-tax price paid by the consumers is the original price minus 0.80 (4/5 of a dollar). Therefore, the total price increase paid by the consumer is 1.20. This outcome is consistent with our initial expectation: the consumer ends up bearing 0.20 more than half the total tax.
The government of Byngia has introduced a new tax on tickets for airline travel. Byngia has two types of travelers, business travelers and leisure travelers. Business travelers in Byngia have an elasticity of demand of-1,2, while Byngian leisure travelers have an elasticity of-3,0. Airlines can price-discriminate among these groups; that is, they can charge different prices to the different types of fliers in the market. Which type of traveler will bear a larger fraction of the burden of the new tax on their tickets? Explain.
Impact of Tax on Business Travelers
Business travelers will bear the larger burden of this tax due to their less price elastic demand compared to leisure travelers.
Leisure Travelers' Response
Leisure travelers may:
Choose other modes of transportation
Decide to not travel at all if prices increase
Business Travelers' Constraints
Business travelers often:
Do not have a choice about whether to travel
Find that other modes of transportation are often not fast enough
With few substitutes, business travelers are price inelastic, allowing airlines to pass the tax burden onto them.
The city of Malaise is considering a 10% tax on the revenues of all hotels/motels inside the city limits. Although not completely different from hotels and motels in the nearby suburbs, the ones in Malaise have a distinct advantage in their proximity to the interesting sights and convention centers. So individuals will pay some premium to stay in Malaise rather than to stay nearby. Furthermore, all land is used equally well by hotels/motels and other forms of business; any Malaise land not taken by a hotel/motel is readily absorbed by other forms of business. Mayor Maladroit calls you in to advise him on the incidence of such a tax. He is particularly concerned with who will bear this tax in the short run (one month) and the long run (five years).
a) What is the incidence of the tax in the short run? Answer intuitively, and use a diagram to illustrate.
Impact of Tax on City Hotels and Motels
Short-term effects: The city hotels and motels will share the burden of the tax with their guests. From the description of the town, it appears that demand for lodging near the city center is relatively inelastic, allowing businesses to increase their rates without losing many customers.
Supply Considerations
The supply of hotel and motel space is likely to be:
Fairly inelastic in the short run
Time-consuming to convert hotels and motels to other uses
Graphically, both demand and supply will be steep
Overall Tax Impact
In the short run, this tax yields very little quantity change but a significant price change.
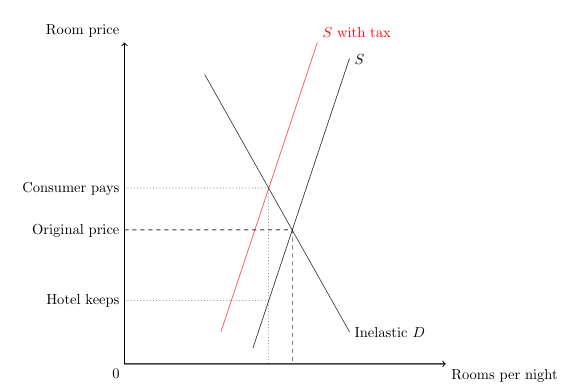
The city of Malaise is considering a 10% tax on the revenues of all hotels/motels inside the city limits. Although not completely different from hotels and motels in the nearby suburbs, the ones in Malaise have a distinct advantage in their proximity to the interesting sights and convention centers. So individuals will pay some premium to stay in Malaise rather than to stay nearby. Furthermore, all land is used equally well by hotels/motels and other forms of business; any Malaise land not taken by a hotel/motel is readily absorbed by other forms of business. Mayor Maladroit calls you in to advise him on the incidence of such a tax. He is particularly concerned with who will bear this tax in the short run (one month) and the long run (five years).
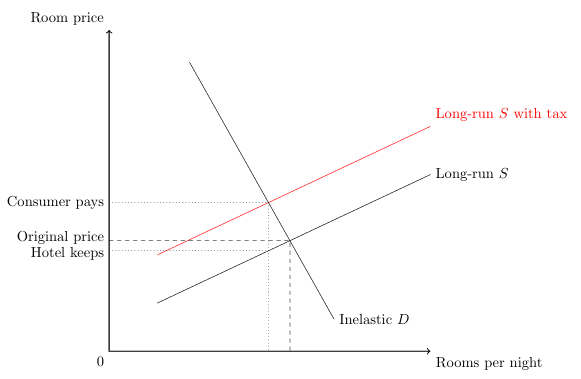
b) What is the long-run incidence? Once again, use a diagram to illustrate
In the long run, the number of hotel and motel rooms can be adjusted; thus, supply is more elastic. In the long run the tax incidence will fall primarily on the inelastically demanding guests. The price kept by the firms is close to the original price.
The city of Malaise is considering a 10% tax on the revenues of all hotels/motels inside the city limits. Although not completely different from hotels and motels in the nearby suburbs, the ones in Malaise have a distinct advantage in their proximity to the interesting sights and convention centers. So individuals will pay some premium to stay in Malaise rather than to stay nearby. Furthermore, all land is used equally well by hotels/motels and other forms of business; any Malaise land not taken by a hotel/motel is readily absorbed by other forms of business. Mayor Maladroit calls you in to advise him on the incidence of such a tax. He is particularly concerned with who will bear this tax in the short run (one month) and the long run (five years).
(b) What is the long-run incidence?)
c) How would your analysis in part (b) change if hotels/motels in the suburbs were perfect substitutes for those in Malaise? What would happen to tax revenues?
The availability of an untaxed substitute in the suburbs would make demand more price elastic. This elasticity would have two effects on the market. First, the firms would not be able to shift the lion’s share of the tax burden to the consumers because if they did visitors to the area would simply stay in the suburbs. Second, the number of rooms rented would fall, so the revenue raised by this tax would decline relative to the answer given in part (a).