POL20050 - Research Methods in Pol Sci
1/145
There's no tags or description
Looks like no tags are added yet.
Name | Mastery | Learn | Test | Matching | Spaced |
|---|
No study sessions yet.
146 Terms
External Validity
Knowledge/answer that we get from one study can be applied outside that study
What does MIDA stand for?
Model, Inquiry, Data & Answer Strategy (M&I are theory and D&A are empirics)
What is MIDA?
The "procedure for generating answers to questions"
Model
How we think the world works (is a like a theory)
Identifies: units, conditions/treatment, potential outcomes
Inquiry
Research question (e.g. does rain affect voter turnout?) the theoretical answer to the question is the estimand
Data Strategy
Data we gather to answer the inquiry
Selects units, uses observed (natural variations) & experimental (experimental variation) conditions and measures outcomes
Answer Strategy
How we summarize & explain the data, this leads us to the estimate
Can be statistical/qualitative
What is the difference between correlation & causation?
The former means two factors moving together where as the latter means that one factor leads to another
What is a research diagnosis?
Does the design work? (use simulated data/formal theory)
Diagnostic Statistics (error/significance)
Diagnosands (summary of distribution of diagnostic statistics)
What are the 6 research design principles?
Design holistically (all parts matter)
Design agnostically (Don't design based on how you think the data looks)
Design for purpose (What are you trying to do?)
Design early (Design first)
Design often (Update your design based on experience)
Design to share (Should be replicable)
What are model elements?
Signature
Functional relationships
Probability distributions over exogenous variables
Signature
Variables in the models & their ranges
Exogenous (often the treatment variable) & endogenous (often the outcome variable)
Observed & unobserved variables
Endogenous Variable
Endogenous variable (dependent variable) are caused by other variables
Exogenous Variable
Exogenous variables are not caused by other variables in the model (independent variable)
What are functional relationships?
Describes how endogenous variable are produced (e.g. if weather affects voter outcome)
Parametric Functional Forms: Imposes assumptions about the nature of the relationship between the outcome & input variable(s)
Non-Parametric Functional Forms: No assumptions about the relationship
What are DAGs?
Direct Acyclic Graphs (DAGs): A way of conceptualizing relationships between variables. It contains:
Nodes = variables
Arrows = causal effects (can be direct/indirect)
NOTE: If we have missing nodes/arrows that data does not matter
Outcome variable
our inquiry to understand the variation of this variable (also known as "response"/"dependent"/"left-hand side")
Treatment variable
the variable that out theory thinks explains the variation in the outcome (also known as "independent")
Moderator
Variables that affect the outcome (not related to treatment) & affect the strength of the treatment variable
Confounder
Causes both treatment & outcome variable and creates and open backdoor pathway (makes treatment variable endogenous)
Collider
Caused by both treatment & outcome variable (creates closed backdoor pathway)
Mediator
Variables along the causal path from treatment to outcome (e.g. D -> X -> Y )
Instrumental Variable
No direct effect on the outcome, only through the treatment variable - are always exogenous (makes treatment variable endogenous)
This is called the exclusion restriction
How do we close a backdoor?
Write down all the paths between D & Y
Check if each path is open/closed by checking for colliders
Check if you can close backdoor paths with a conditioning strategy
If all backdoor paths are closed we have met the backdoor criterion & we can argue for causal inference
Should you always condition for variables in a model (conditioning strategy)?
No, we don't condition a collider variable because you will introduce a collider bias
We condition for confounder variables
What is the consequence of an open backdoor path?
Creates a bias
How do we create a theory?
From past work
Explanatory research
Hypothesis
Specific expectations about the direction (and potential size) of the relationship between treatment & outcome
Null Hypothesis
a hypothesis that there is no relationship (we often test it & we want to reject it)
What are the different types of inquiries?
Descriptive
Causal
Simple or Complex
What should inquiries be?
Interesting
Answerable
What are elements of inquiries?
Units (people, places or things)
Outcomes
Treatment Conditions
Different Units
Based on estimand
Population of units
Treated units
Untreated units
Complier units: take treatment if assigned, don't take treatment if not assigned
Treatment Conditions
Descriptive (observational data)
Causal (manipulated data)
What are descriptive inquiries?
Is a summary statistic.
There is no counterfactual: Comparing what happens in the world where a unit is treated with a world where the unit is not treated
Types of descriptive inquiries
Measures of central tendency
Conditional Values
Variance
Covariance
Linear predictors (line of best fit)
Measures of central tendency
Mean (most used)
Median
Mode (least used)
Variance
A measure of the dispersion of a set of values and is calculated as the average of the squared differences from the mean. (how spread out are the variables)
Covariance
A measure of how much two variables change together calculated as the average of the product of their deviations from their respective means.
What are causal inquires?
A comparison of at least two possible treatment conditions (in reality we cannot observe the counterfactual).
Types of causal inquiries
(Population) Average Treatment Effect - (P)ATE = mean (treated) - mean (untreated)
Average Treatment Effect on the Treated (ATT): Only the group that received treatment, we observe the potential outcome if the group had been untreated
Average Treatment Effect on Untreated (ATU): Only the group that did no receive treatment, we observe the potential outcome if the group had been treated
Potential Outcome
What would have happened to the treated units had they been untreated and vice versa
What are data strategy components?
Sampling (of units): To justify inference
Treatment Assignment (treatment conditions): To justify causal inference
Measurement (of outcomes): To justify descriptive inference
What is sampling?
Process by which units are selected from the population to be studies
Why do we sample?
Cost: diminishing returns (past a certain point the cost)
Feasibility
What are the two types of sampling?
Randomized Sampling (Design based inference)
Non-Randomized Sampling (Model based inference)
Types of Randomized Sampling
Simple: Every unit has same chance of being sampled
Stratified: Every unit within a group has same chance of being sampled
Cluster: Groups are brought into the sample with the same chance
Multistage: First clusters, then units within clusters
Types of Non-Randomized Sampling
Convenience Sampling
Low cost however, potential bias
We get Sample Average Treatment Effect
Purposive Sampling
Quota sampling: sample by type, like stratified (not random therefore potential bias)
Respondent- Driven Sampling (Snowball)
What is treatment assignment?
Similar to sampling (for causal inquiries).
What are the types of treatment assignments/designs?
Two arm designs (2 treatment conditions)
Multi-arm designs: Units can receive one of multiple treatments
Factorial designs: Units can receive one/more of multiple treatments
Over-time designs
Non-Randomized treatment assignments
Types of Two Arm Designs
Simple Random Assignment: All units have the same probability of assignment - treatment & no treatment (2 conditions)
Complete Random Assignment: a specific number of units
Block Random Assignment: Units within the same block have the same probability of assignment (similar to stratified sampling)
Cluster Random Assignment: Units within the same block have the same probability of assignment (similar to stratified sampling)
Block and Cluster Assignment: Cluster random assignment within blocks of clusters (similar to multistage sampling)
Saturation Random Assignment: First clusters are assigned to a saturation level, then units within clusters are assigned to treatment conditions according to the saturation level (clusters chosen but some units in clusters not treated)
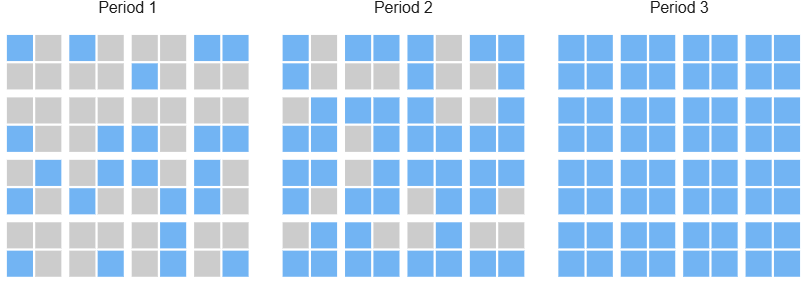
Types of Over-time Designs
Step-wedge: assign some units at different time period
Crossover: get treatment in first time period then don't get treatment in second time period (no carry over assumption: treatment does not affect unit in second time period)
Types of Non-Randomized treatment assignments
Alternating Assignment: first person shows up & gets treatment, second person that shows up doesn't
Discontinuity: we have cut offs & we look at units just before/after the cut off
Bayesian: Based on predicted treatment effectiveness – “optimal assignment”
Latent Outcomes (measurement)
Things we can't easily directly observe.
Trust
Ideology
Polarization
Media Tone
What do we look for when measuring latent outcomes?
Validity (is it accurate)
Reliability (is it reproducible)
What are measurement strategies?
Who measures?
Researchers, survey company, self-measure?
How are things measured?
In person, online, on the phone, “administratively”?
How often are things measured?
Once, multiple-times, frequency consistency
How many things are measured?
One measure of a latent outcome or multiple?
How are multiple measures summarized?
Additive, averages, weighted, non-linear
What are threats to data strategies?
Noncompliance: units who are assigned treatment but don't take it or vice versa (ITT Effect & CATE)
Attrition: do not have outcome measures for all sampled units (not usually random but ok if random)
Excludability: sampling, assignment &/ measurement have a direct effect on outcome (we do not want this)
Interference: sampling, assignment &/ measurement of one unit/outcome have an effect on the outcome of some other unit or outcome (we don't want this)
Intent to Treat Effect (ITT)
if you know you will get treatment does that change the outcome
Complier Average Treatment Effect (CATE)
only those that comply are counted
Table of Randomized Sampling
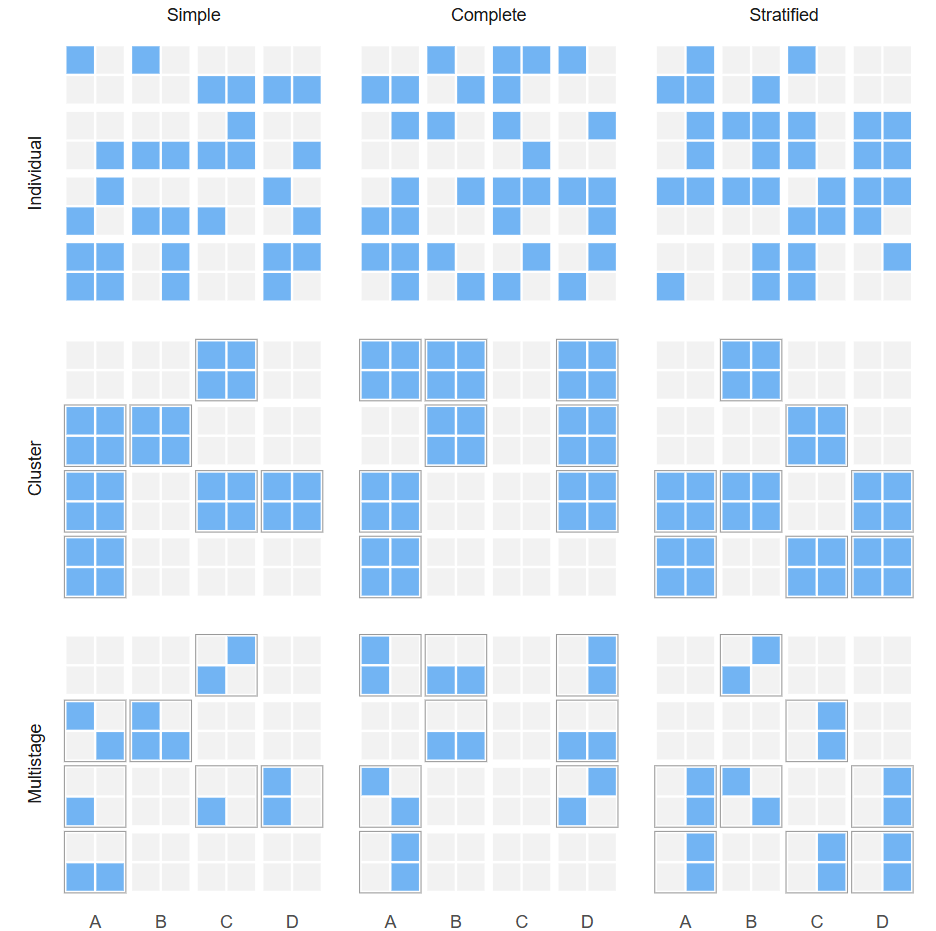
Table of Random Assignment
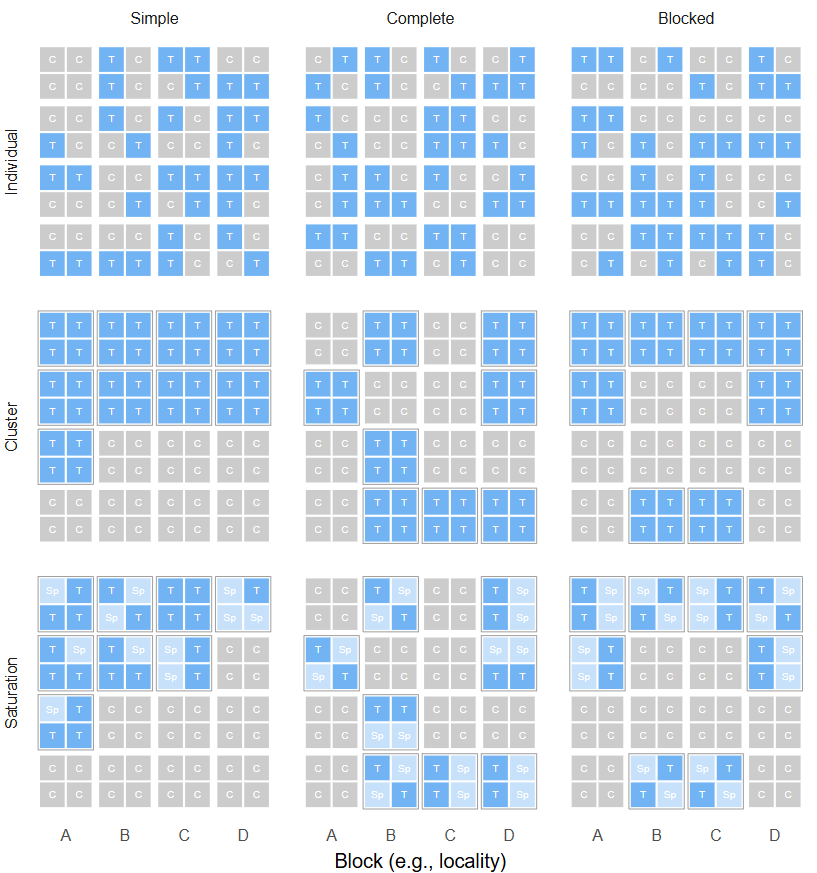
Table of Multi-Arm Random Assignment
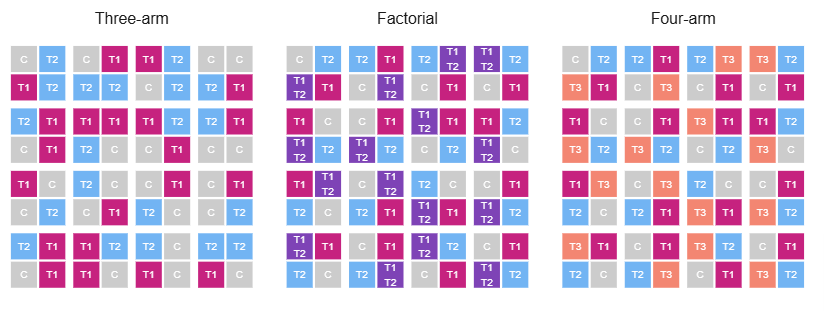
Table of Over-time designs (Step-wedge)
What are Answer Strategy elements?
Answer Characterization
Uncertainty: answers are often uncertain
Procedure: how outcomes of study units are analysed (we arrive at an estimator/case study approach)
Types of Answer Characterization
Domain (type of answer) e.g. number, T/F, percentage, statement, model
Units (from inquiry)
Ecological inference fallacy: draw answers about units on one level using answer strategies at a different level (e.g. if the units are individuals but the data available is only countrywide education & income)
Outcomes (need to pay attention to latent (unobservable) measures e.g. trust, attitude)
Conditions/treatments: dealing with unobserved counterfactuals
Types of Uncertainty
Bayesian uncertainty: rational beliefs over possible values of estimand (we have a prior belief by theory/empirics & uncertainty is built in)
Frequentist uncertainty: generates an actual probability distribution over possible data, d
What are the types of Answer Strategies?
Point Estimation: an estimate of a scalar parameter
Descriptive statistics
Regression coefficients
Uncertainty: how far estimates are from the expected value for a given sample
Hypothesis Tests: can be quantitative or qualitative
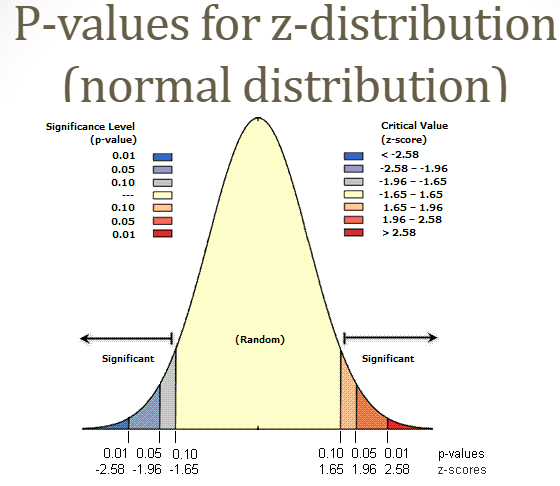
Statistical Significance
p<0.05, where p is the probability that your estimate could have occurred if the true population parameter = 0
Type I Error
reject null when it is true (false positive)
Type II Error
fail to reject null when it is false (false negative)
What is interval estimation?
Estimate a range of answers where we think the estimand lies
Bayesian: credible interval (*informed by prior belief*)
Frequentist: 95% confidence interval
How do we choose an Answer Strategy?
Plug-in Principle: estimating a parameter by substituting observed data into a (inquiry) function that represents the parameter.
Doesn't work for non-mathematical functions
Analyse as you randomize: adjusting the answer strategy when the data strategy is distorted (*in sampling/assignment*)
Robustness Checks: considering multiple different answer strategies
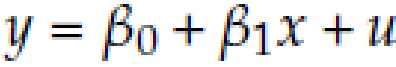
What is Linear Regression Equation?
y = outcome/dependent variable/effect/left-hand side variable
x = independent variable/cause/right-hand side variable
u = error term
β0 = intercept parameter
β1 = slope parameter
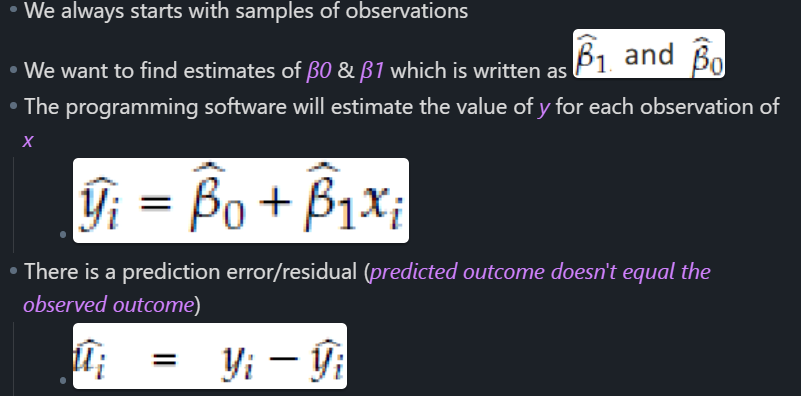
How do we use the Linear Regression Equation to calculate estimates?
What is an example when OLS (least squares) is biased?
This is a specification bias
When x is small, u is consistently positive
When x is mid-rage, u is consistently negative
When x is large, u is consistently positive
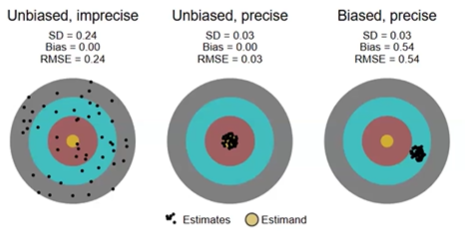
What are Diagnosands?
Properties that use diagnostic statistics/other diagnosands to allow for evaluation of different aspects for a research design
What are primary diagnostic statistics?
Estimate
Estimand
Sample Size
Variance (SD)
Estimated Standard Error
P-value
Confidence Interval
Estimate
estimated answer from answer strategy/answer from the data. Can be a central tendency statistic
Can be numerical/not
Estimand
conceptual answer to our inquiry (true answer)
Can be numerical/not
Estimated Standard Error
measure of how much the sample mean differs from true population mean due to random sampling
P-value
how likely it would be to see your results if the null hypothesis was true
Confidence Interval
indicates how confident we are that the interval contains the true population parameter
What are common diagnosands?
Bias
Average Estimated Standard Error
Root-Mean Squared Error (RMSE)
Power
Type S Error Rate (incorrect sign)
Type 1 Error Rate (false positive)
Type 2 Error Rate (false negative)
Minimum Detectable Effect (MDE)
Bias
expected difference between estimate & estimand (*we want estimates to be close to estimand*)
Average Estimated Standard Error
how much we expect an estimate to differ from sample to sample
We need SD (*which needs estimate*) & Sample size
Root-Mean Squared Error (RMSE)
combined measure of accuracy & precision
We need estimate, estimand, SD (*needs estimate*) & sample size
Power
p of correctly rejecting null/how likely to avoid type 2 error
We need p-value, a significance level (alpha)
Type S Error Rate (incorrect sign)
the p that the sign of your estimate is different from the sign of your estimand given a significant p-value for the estimate
We need estimate, estimand, p-value
Type 1 Error Rate (false positive)
the p of rejecting the null hypothesis when its true (e.g. finding an innocent person guilty)
We need estimate, estimand, p-value
Type 2 Error Rate (false negative)
the p of failing to reject the null hypothesis when its false (e.g. letting guilty people go free)
We need estimate, estimand, p-value
Minimum Detectable Effect (MDE)
power for different effect sizes (*estimates*) holding other features (*e.g. sample size*) constant
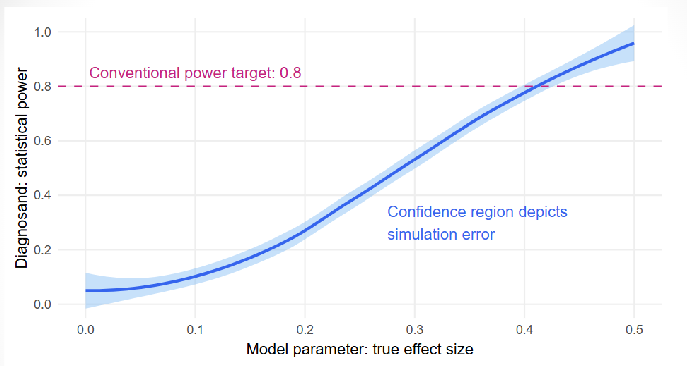
Table of Bias, Variance & Precision
3 is biased because they are away from the estimand
What are characteristics of ODDs?
Inquiry is descriptive (*not looking for treatment*)
Measure & summarize the world through surveys/official statistics
Quantitative/Qualitative (*informed by our model)
What are examples of ODDs?
How old are homeowners in Ireland?
Which political party has been the most popular over the past 60 years?
How much do Irish voters trust politicians?
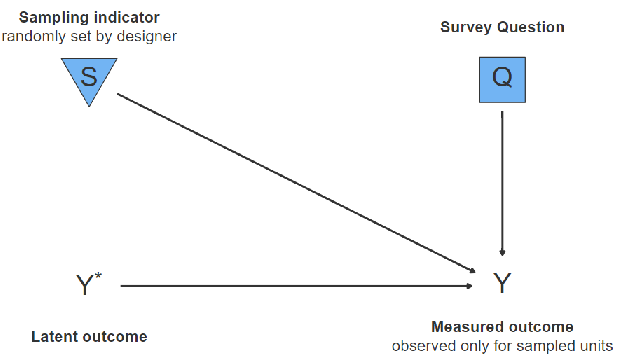
What is the Political Ideology Example?
Y* is the political ideology of a town (*is unobserved variable*)
We make it observed as Y via a survey question (Q) of a sample of the town (S)
Inquiry is the mean Y (*estimand*)
Answer strategy is the sample mean estimator
What is the Intra-Cluster Correlation (ICC)? (type of ODD)
Used when we expect an outcome to be influenced by characteristics at both unit & cluster level (*e.g. individual & village*)
ICC = 1: all variation in outcome explained by cluster level factors
ICC = 0: all variation in outcome explained by unit level factors
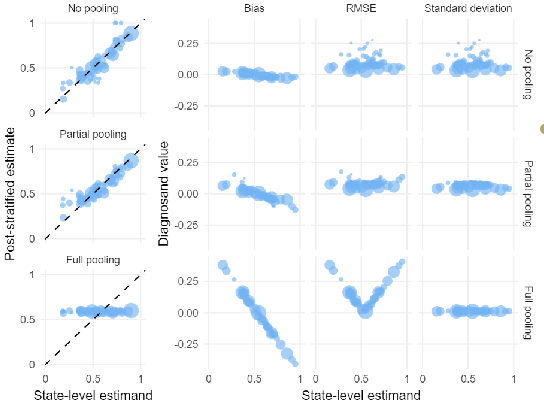
What is Multi-level Regression and Post-Stratification (MRP)? (type of ODD)
MRP: Used for hierarchical data and then applying poststratification to adjust estimates based on individual/cluster levels
Post-stratification: reweights estimates to know proportions of individual characteristics at the cluster level
Table for MRP & Partial Pooling?
No Pooling: bias is very low, but the RMSE and standard deviation for small states is very high
Partial Pooling: we have some positive bias for low-opinion states and negative bias for high-opinion states, but variance has been brought under control. As a result, the RMSE for both small and large states is small. (*Goldilocks compromise*)
Full Pooling: the standard deviation is very low, but bias is very positive for states with low support and very negative for states with high support. The resulting RMSE has a funny “V” shape – we only do well for states that happen to have opinion that is very close to the national average.
Index Creation (type of ODD)
Often for latent (unobserved) variable Y*
What is the assumption for Index Creation?
combining multiple measures may cancel some of measurement error out
Since Y* is latent it has no objective scale, we use proxy indicators (variables)