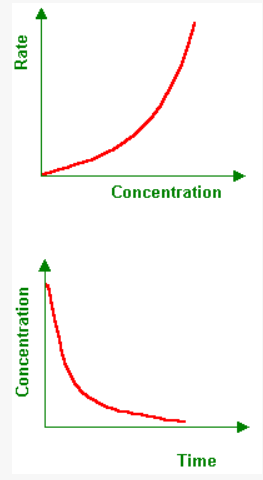
Concentration graphs
0.0(0)
Card Sorting
1/3
There's no tags or description
Looks like no tags are added yet.
Study Analytics
Name | Mastery | Learn | Test | Matching | Spaced |
|---|
No study sessions yet.
4 Terms
1
New cards
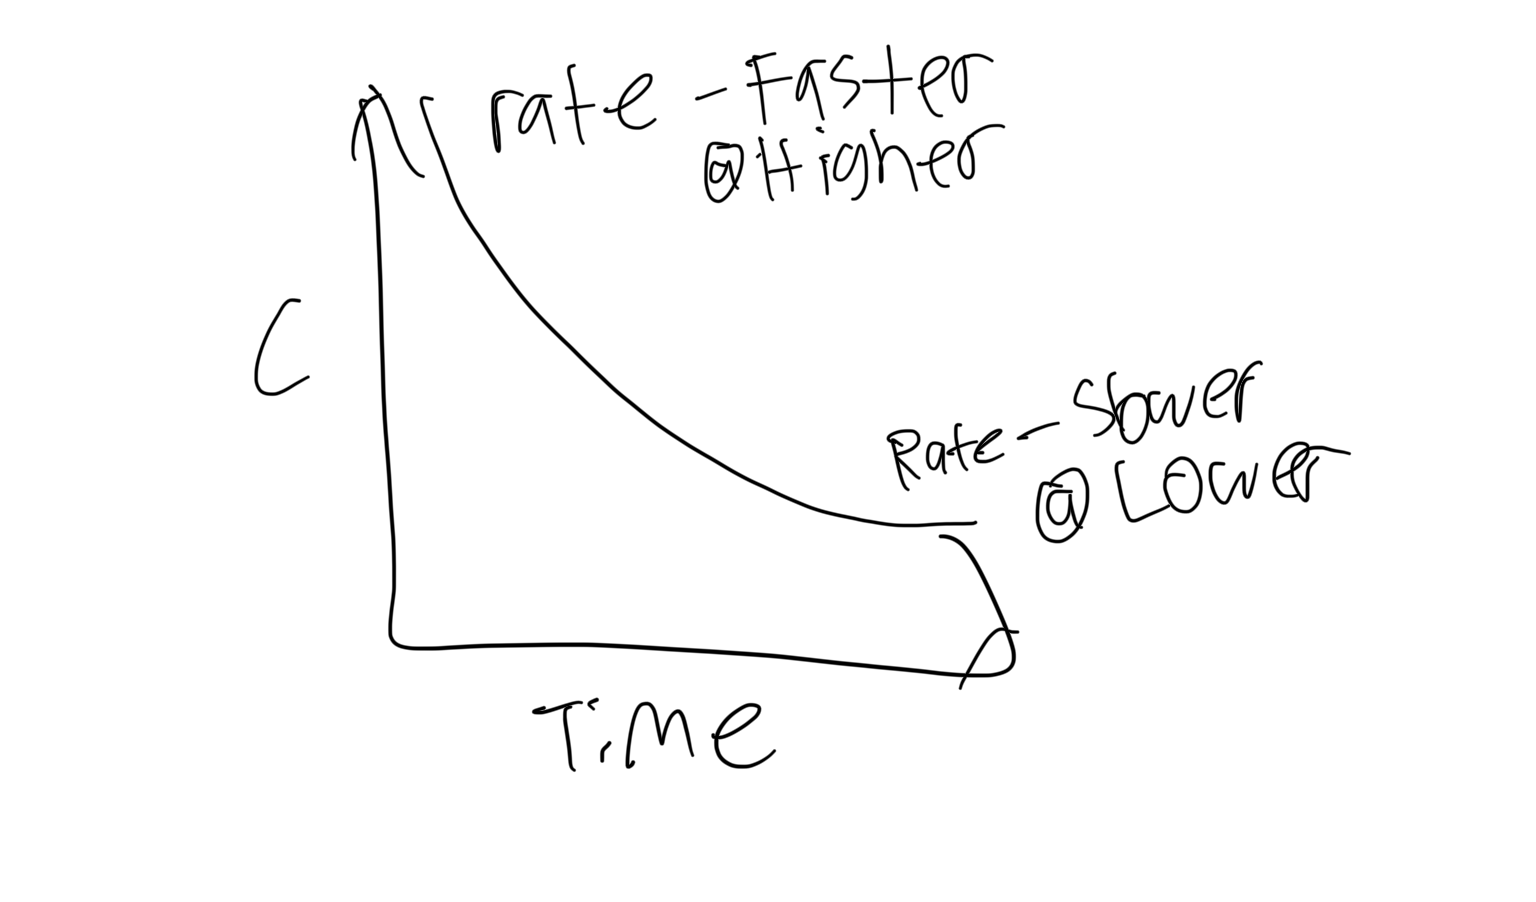
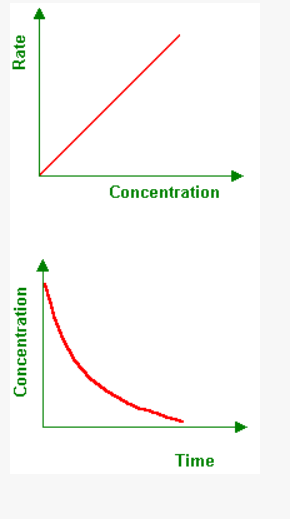
In a concentration v time graph, the rate gets faster at the higher part of the graph and slower at the lower part of the graph
2
New cards
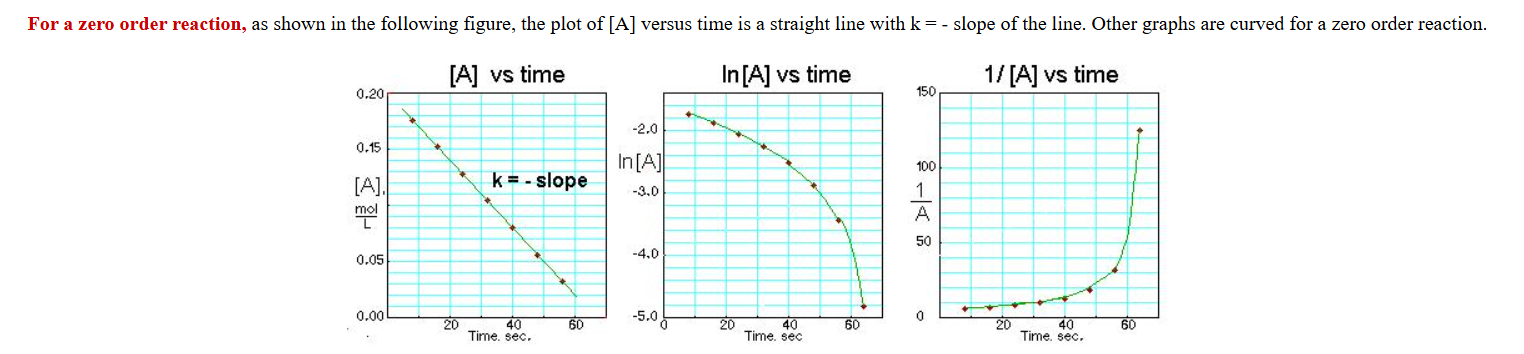
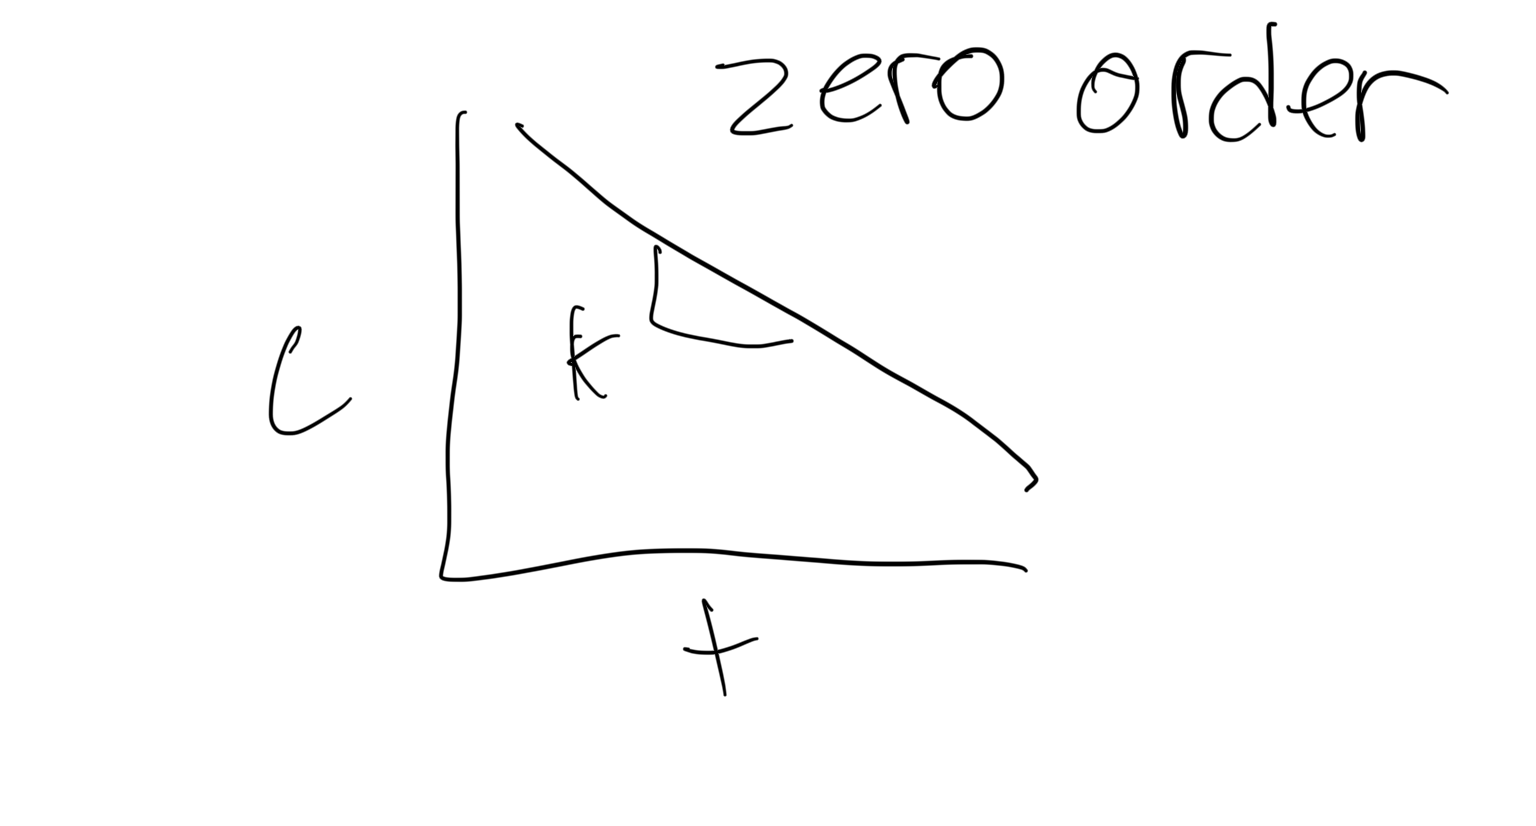
What does a zero order concentration graph look like?
n=o
c(t)= -k+concentration
t=time
c=concentration
k=rate of change
3
New cards
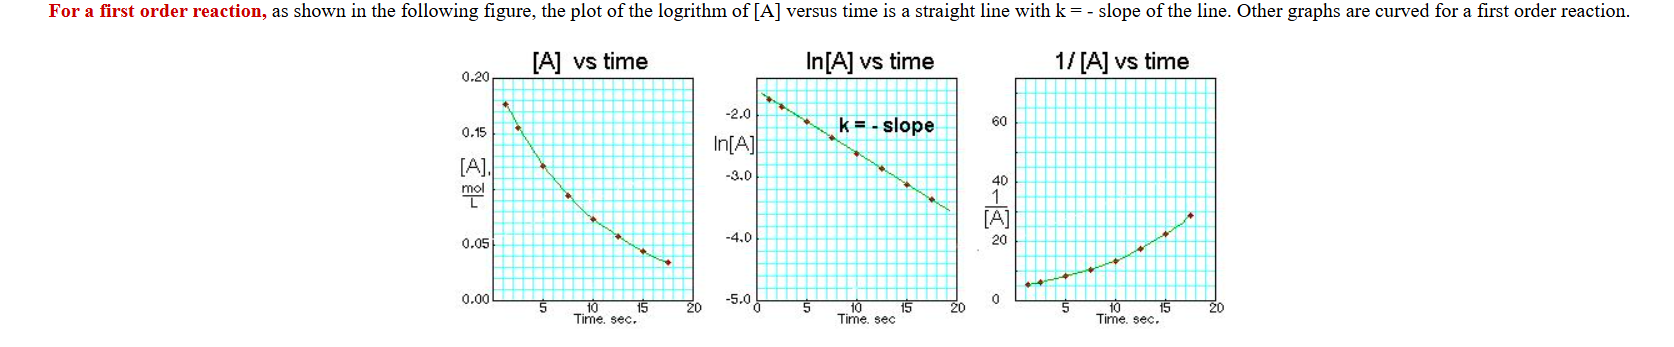
What does a first order concentration graph look like?
ln c(t)=-kt+ln concentration
ln= natural log
c=concertation
t=time
k=rate
4
New cards
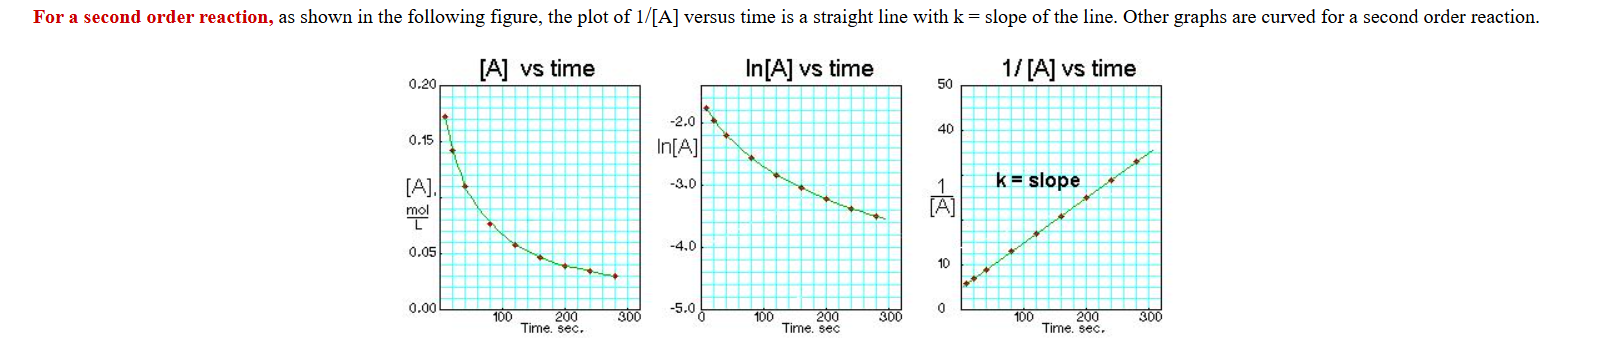
What is the second concentration graph look like?
1/c(t)=kt+1/c