CS 4460 Info Vis Exam 1 Charts
1/51
There's no tags or description
Looks like no tags are added yet.
Name | Mastery | Learn | Test | Matching | Spaced | Call with Kai |
|---|
No analytics yet
Send a link to your students to track their progress
52 Terms

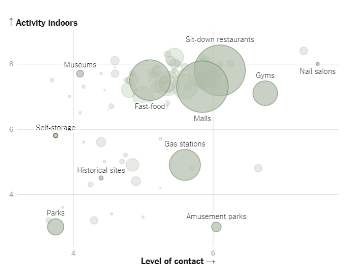
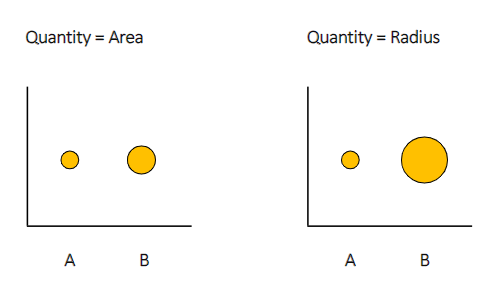
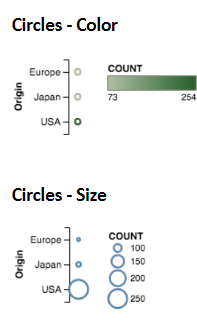
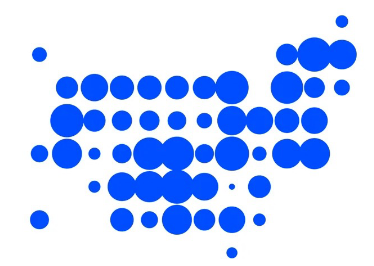
what type of chart is this?
bubble chart: a scatterplot with a third variable (normally encoded in size)

what visual encodings are in this bubble chart?
x-axis and y-axis are used for position
size of circles used
different colors used
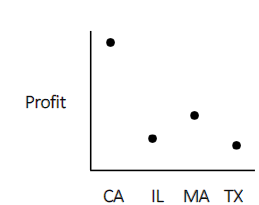
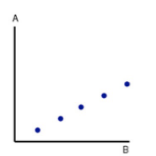
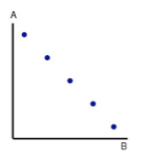
what type of chart is this?
scatterplot

what visual encodings are in this scatterplot?
position with y-axis
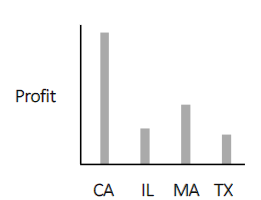
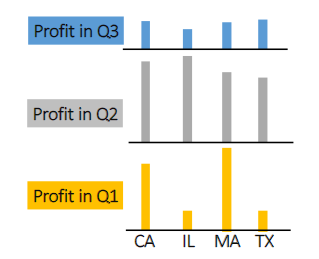
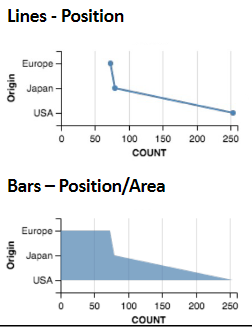
what type of chart is this?
bar chart

what visual encodings are in this bar chart?
size with length of bars
position with y-axis
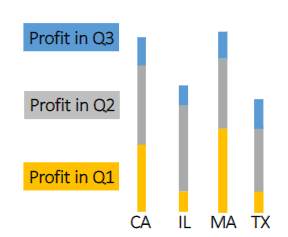
what type of chart is this?
stacked bar chart
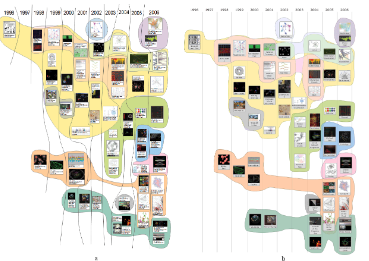
what type of chart is this?
small multiples
what visual encoding do these charts use?
2D area for size
what type of chart is this?
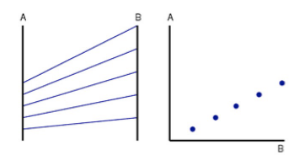
parallel coordinates
what visual encoding does this chart use?
numeracy for size
what visual encoding does this chat use?
orientation and position
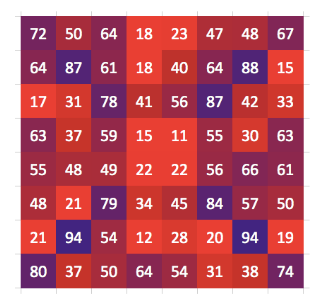
what type of chart is this?
heat map
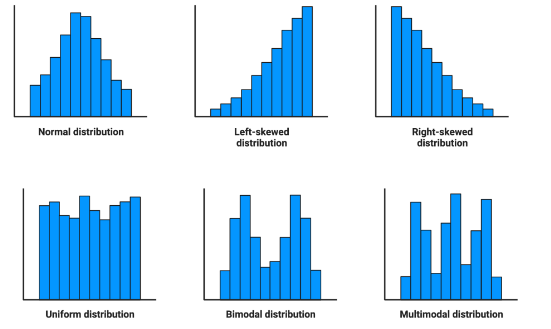
what type of chart are these?
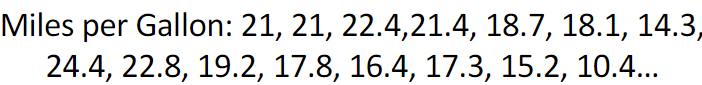
histogram
what is the con of these charts?
they encode with color and size (area) which are imprecise, it’s hard to extract actual values
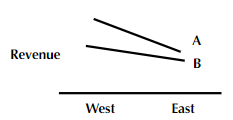
what is the con of these charts?
the lines make the nominal data feel continuous even though it’s not
what are some charts that are effective in visualizing continuous data?
if continuous raw data: strip plot*, dot plot (rescaled or not)
if continuous aggregated data: histogram*, bubble chart (size or color)
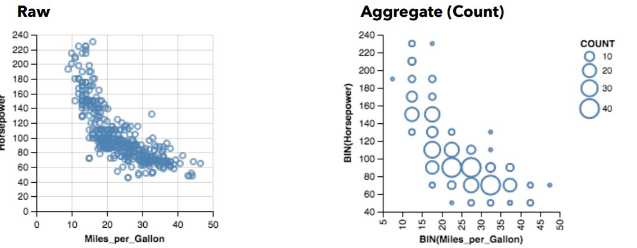
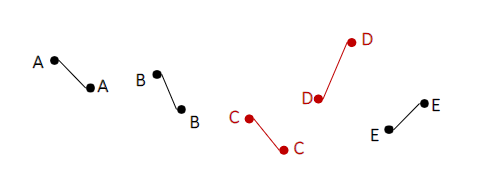
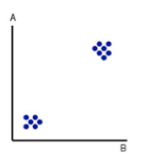
what types of charts are these?
scatter plot left
bubble chart right
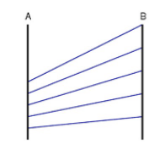
what correlation does this parallel coordinate have?
positive
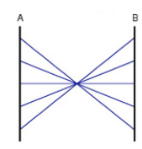
what correlation does this parallel coordinate have?
negative
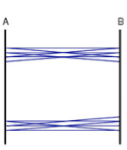
what is the characteristic of this parallel coordinate?
two clusters
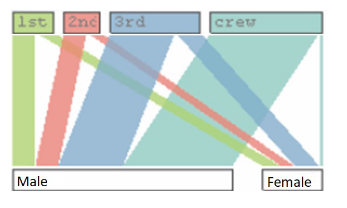
what type of chart is this?
parallel set. like parallel coordinates, but indicating frequency information for categorical variables
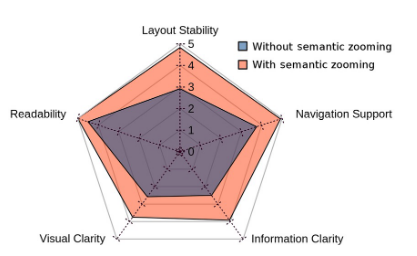
what type of chart is this?
star plot aka radar plot
what type of chart is this?
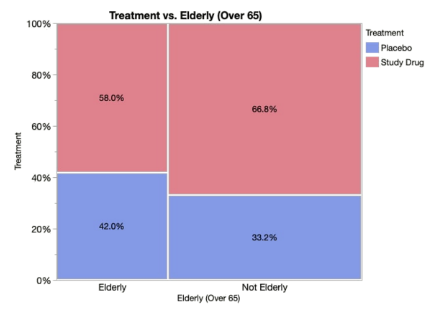
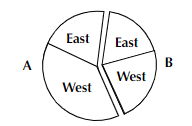
mosaic chart
a special type of stacked bar chart which shows percentages of data in groups
what type of chart is this?
tile map: bubble chart in map form
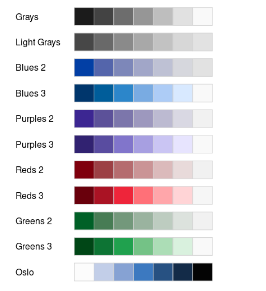
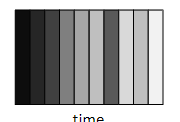
is this a sequential or diverging color scheme?
sequential color scheme
is this a sequential or diverging color scheme?
diverging
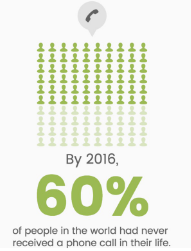
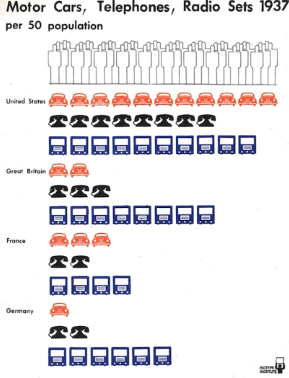
what is an ISOTYPE chart?
use visual language for icons and use multiples to represent quantitative data. harness semantic encoding & visual metaphors
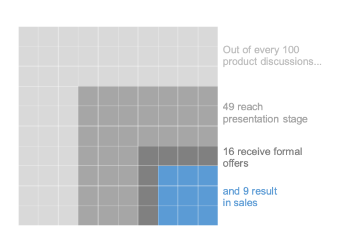
what type of chart is this?
square area chart / waffle chart
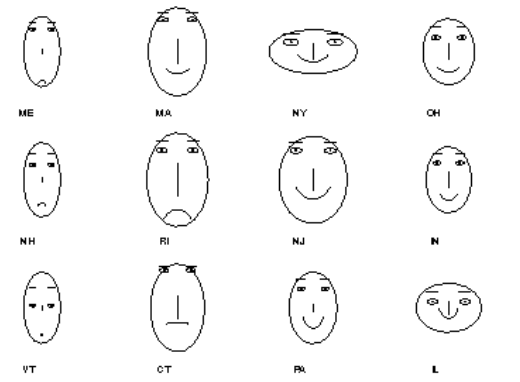
what type of chart is this?
chernoff faces
what do bar charts afford?
magnitude comparison
what do pie charts afford?
proportions
what do line charts afford?
relative changes/trends
what do scatterplots afford?
outliers
what do heat maps afford?
clusters
what do tables afford?
ratio comparisons or mathematical computations
what type of chart is this?
bubble set, a type of unit chart
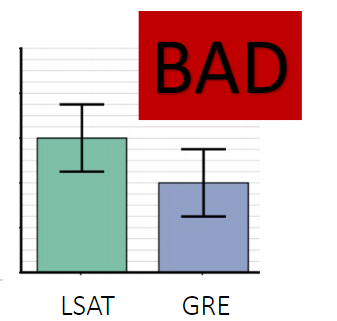
what type of chart is this?
bar chart with error bars
bad with showing measurement uncertainty because we have within-the-bar bias (we don’t think mean can go above bar)
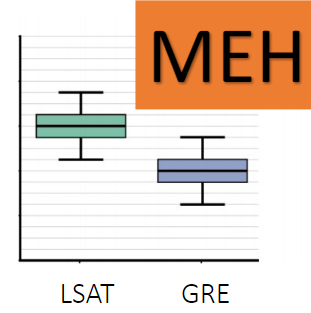
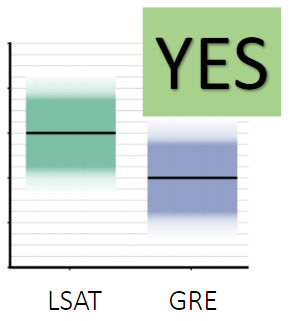
what type of chart is this?
modified box plot
what type of chart is this?
gradient plot
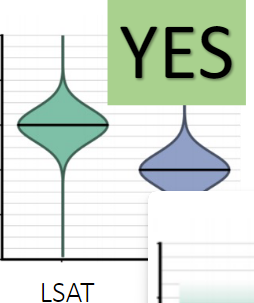
what type of chart is this?
violin plot
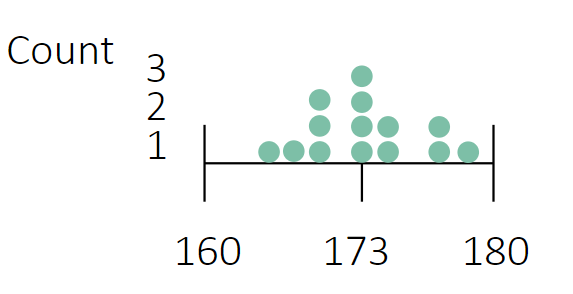
what type of chart is this?
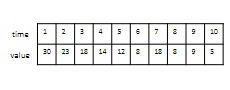
dot plot
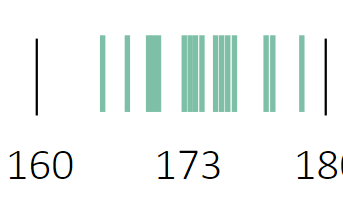
what type of chart is this?
strip chart
what type of chart is this?
beeswarm
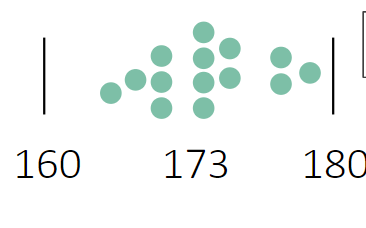
what type of chart is this?
beeswarm
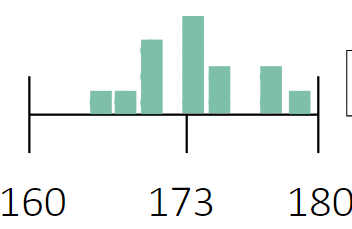
what type of chart is this?
histogram
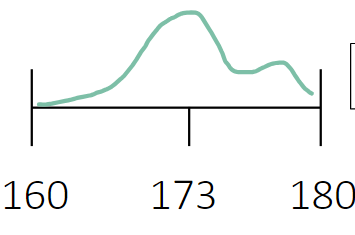
what type of chart is this?
density chart
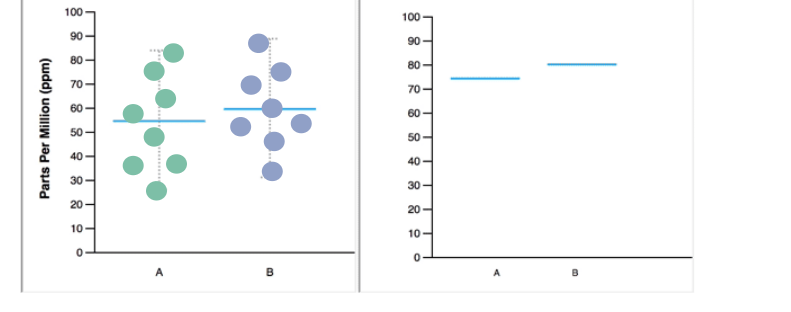
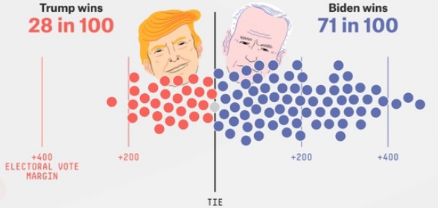
what type of chart is this on the right?
hypothetical outcome plots (imagine it’s animated)
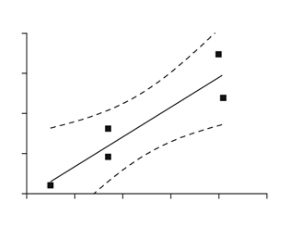
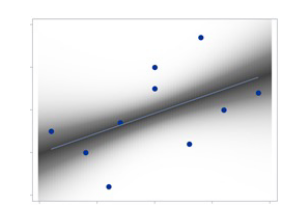
what does this chart have for model uncertainty?
confidence lines
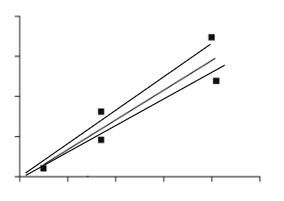
what does this chart have for model uncertainty?
model overlays
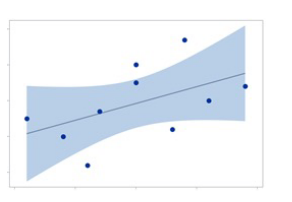
what does this chart have for model uncertainty?
confidence bands
what does this chart have for model uncertainty?
confidence gradients