2.1 - demand and supply, surplus, traditional economic theory
1/22
There's no tags or description
Looks like no tags are added yet.
Name | Mastery | Learn | Test | Matching | Spaced |
|---|
No study sessions yet.
23 Terms
demand
quantity of a good/ service that consumers are willing and able to purchase at various prices during a specific period.
demand curve
relationship between the price of a good or service and the quantity demanded by consumers.
law of demand
price ↑= quality demanded ↓
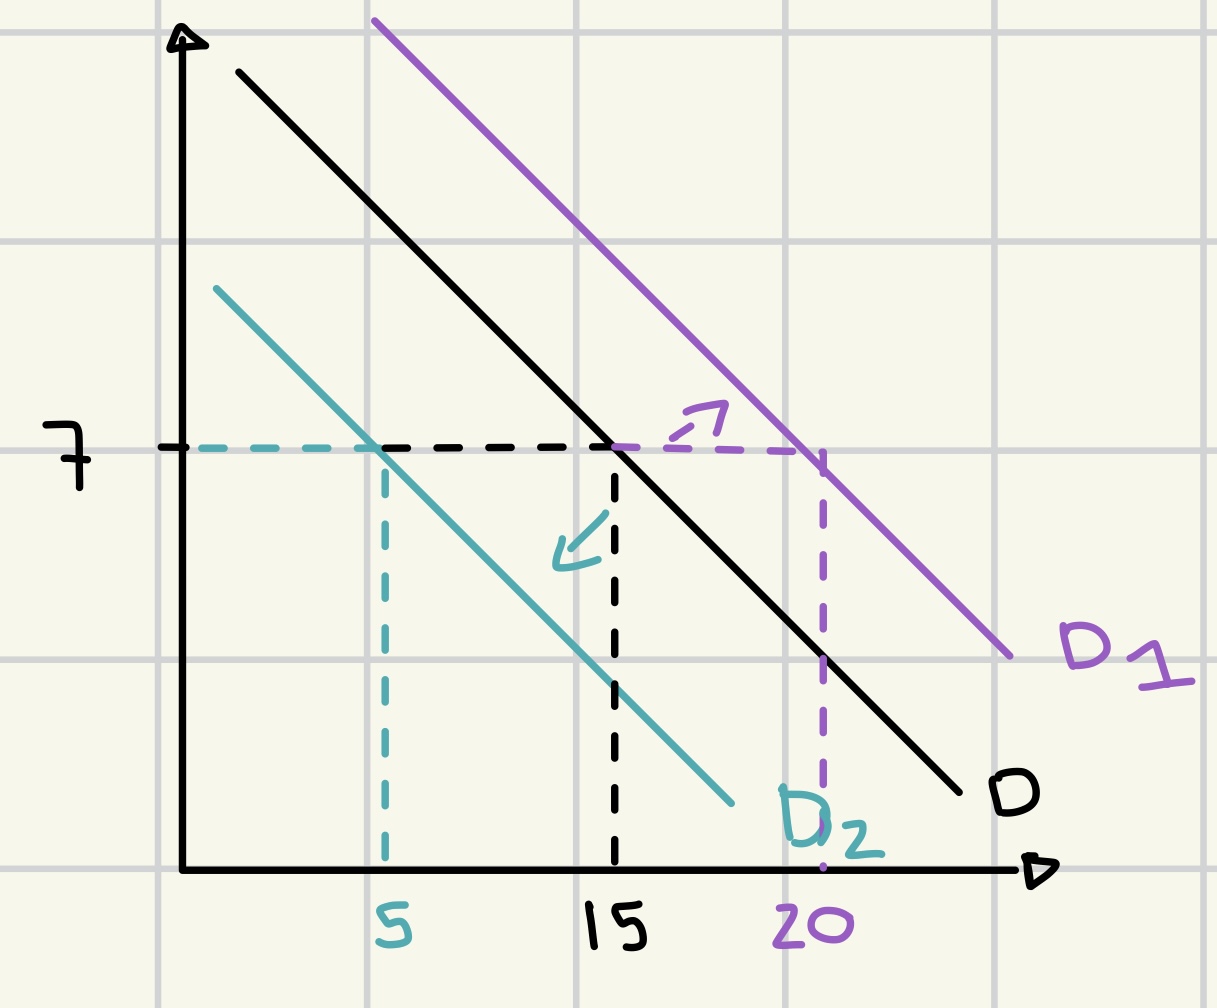
non-price determinants of demand
income ↑ = quality demanded ↑ (D → D1)
good preference ↑ = quantity demanded ↑ (D → D1)
price of substitute ↑ = quantity demanded↑ (D → D1)
number of consumers ↑ = quantity demanded ↑ (D→ D1)
price of complementary goods ↑ = quantity demanded ↓ (D → D2)
supply
amount of a good or service that producers are willing and able to sell at various prices over a specific time period.
supply curve
relationship between quantity supplied and price
law of supply
market price ↑ = quantity supplied ↑
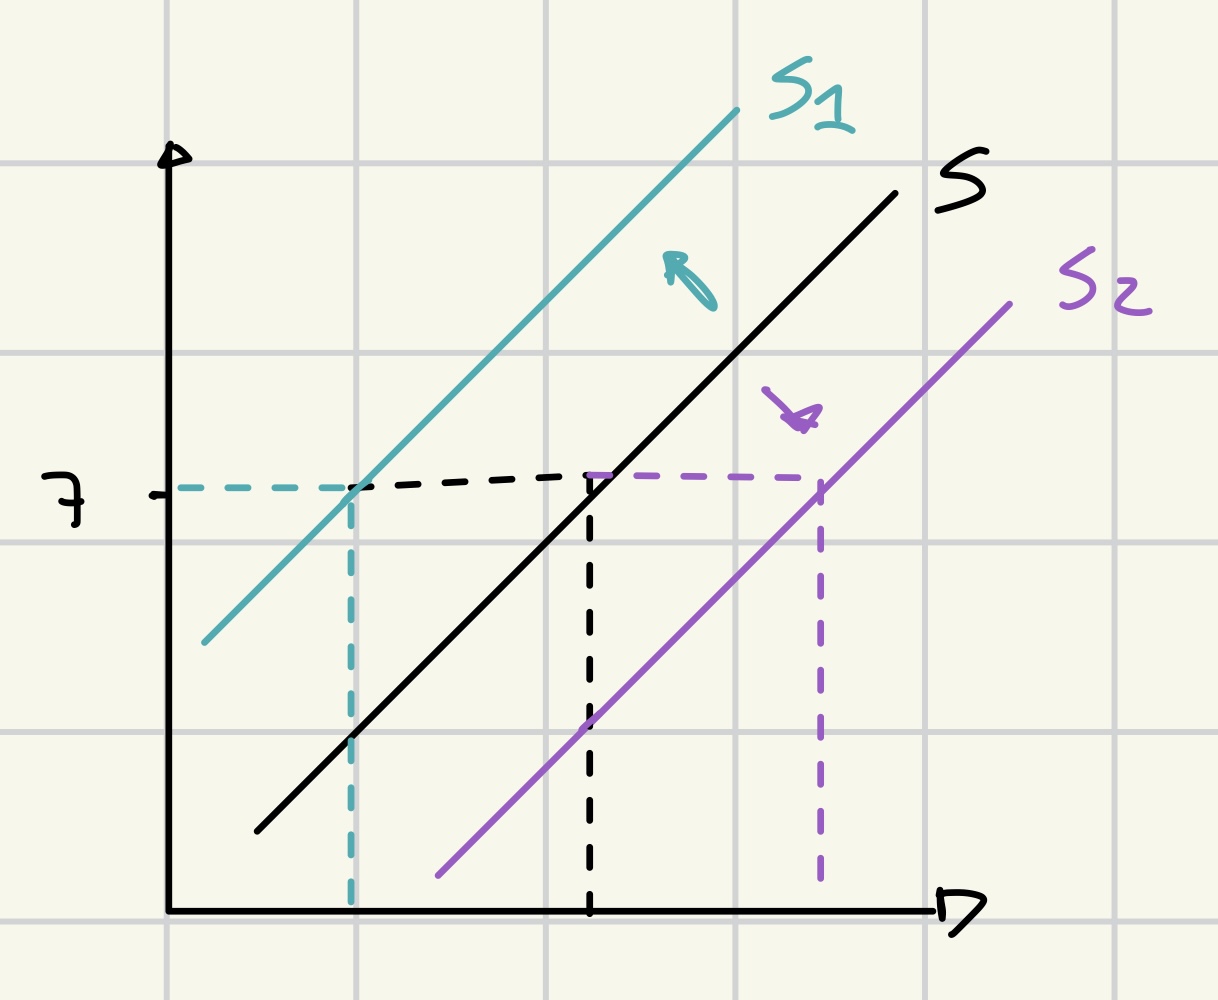
non price determinants of supply
subsidies ↑ = supply ↑ (S→ S2)
new technology ↑ = supply ↑ (S→ S2)
competitors ↑ = supply ↑ (S→ S2)
cost of production ↑ = supply ↓ (S→ S1)
taxes ↑ = supply ↓ (S→ S1)
weather disaster = supply ↓ (S→ S1)
opportunity cost of related products ↑ = supply ↓ (S→ S1)
consumer surplus
difference between the amount the consumer is willing to pay for a product and the price they have actually paid
benefit gained by the consumer for purchasing the product at a lower price.
producer surplus
difference between the price producer is willing to sell a product for and the price they actually do
benefit to producers from selling at a higher price than their minimum acceptable price.
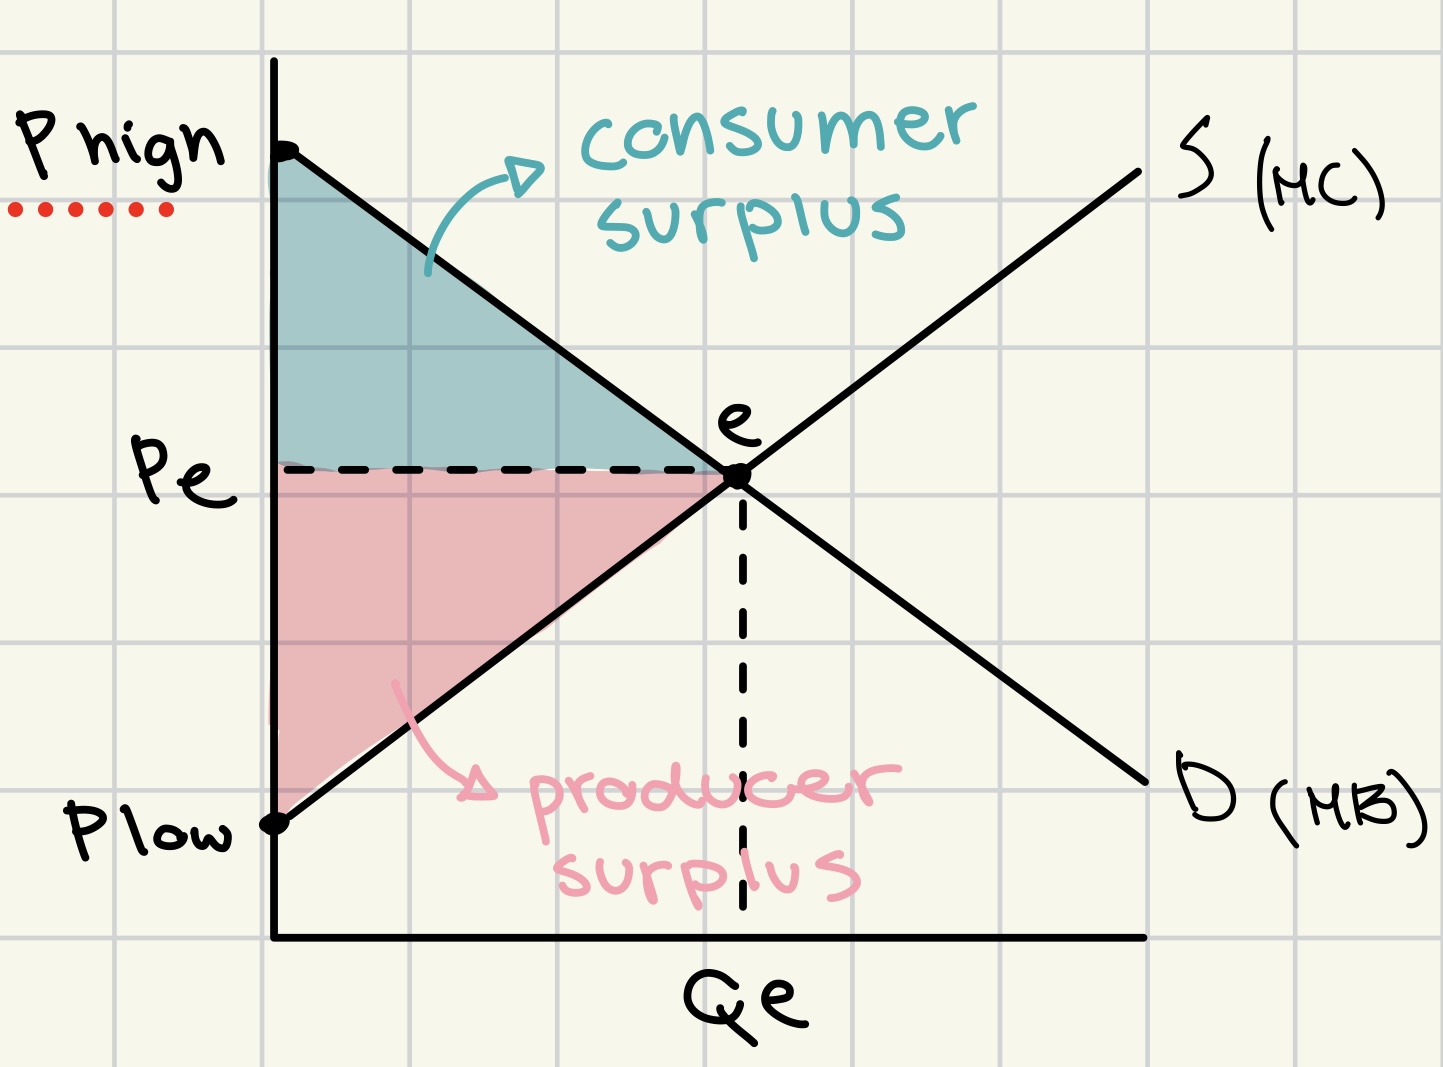
producer and consumer surplus graph
supply ↑ = producer/consumer surplus ↑
demand ↑ = producer/consumer surplus ↑
allocative efficiency/ equilibrium
resources are distributed in a way that maximizes total societal welfare
quantity of a good produced is equal to the quantity demanded.
productive efficiency
at minimum average total cost
all resources are utilized effectively.
traditional economic theory
consumer rationality
utility maximization
perfect information
limitations on rational consumer choice
biases
bounded rationality
bounded self-control
bounded selfishness
imperfect information
forms of biases
based on experience
framing ‘20% fat vs 80% fat free’
anchoring (seller suggest a higher price than the real value)
availability bias
bounded rationality theory
individuals make decisions based on the limited information available to them, leading to less-than-optimal choices.
bounded self control
the tendency to struggle with making choices that align with long-term goals due to immediate temptations and distractions.
bounded selfishness
the tendency of individuals to prioritize their own interests over the collective good, often leading to suboptimal outcomes for the group.
imperfect information
the situation where all relevant information is not available to consumers or producers, leading to suboptimal decision-making in markets.
types of choice
default
restricted
mandated
nudge theory EAST
using reinforcement and suggestions to influence decision-making of individuals.
E - easy → simplify
A - attractive → gain people’s attention
S - social → individuals may be influenced by others doing said thing
T - timely → identify when people are most responsive
advantages of nudge theory
cost effective
preserves freedom of choice
improves decision making
encourages positive behavior change.