Least-Squares Regression Line
1/7
Earn XP
Description and Tags
Khan Academy | Unit 5, Lesson 4: Calculating the equation of the least-squares line and Using least-squares regression output
Name | Mastery | Learn | Test | Matching | Spaced | Call with Kai |
|---|
No analytics yet
Send a link to your students to track their progress
8 Terms
What is the form of the equation for the least-squares regression line (LSRL), predicting y from x?
\hat y = a + bx
How do you find the slope (b) of a LSRL? (Not using a or y)
b = r * (sy / sx)
Slope = correlation coefficient * (y standard deviation / x standard deviation)
What is “r” and what does it measure?
The correlation coefficient, which measures the strength and direction of the linear relationship between two variables.
What is “r²” and what does it measure?
The coefficient of determination, which indicates the proportion of variance in the dependent variable that can be explained by the independent variable in a regression model.
How do you find the y-intercept (a) of a LSRL?
a = ȳ - bx̄, where ȳ is the mean of the dependent variable, b is the slope, and x̄ is the mean of the independent variable.
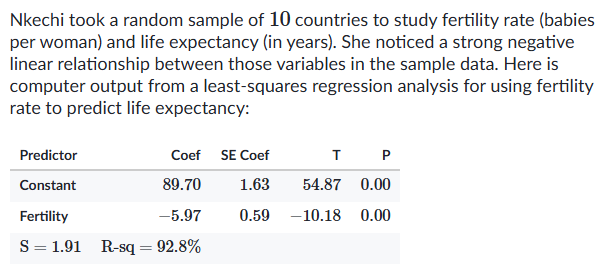
Identify the y-intercept (a) and slope (b) from the graph alone (format: y = a + bx).
a = 89.70, b = -5.97
The constant coefficient is always the y-intercept.
What is a high-leverage point?
A point whose x-value is far higher/lower than the mean x-value. No y-value requirements.
What is an outlier (simple terms)?
ANY point that does not follow the general trend (often has high residuals).