Jet Characteristics
1/165
There's no tags or description
Looks like no tags are added yet.
Name | Mastery | Learn | Test | Matching | Spaced | Call with Kai |
|---|
No analytics yet
Send a link to your students to track their progress
166 Terms
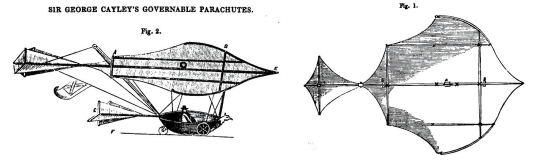
Sir George Cayley
"Father of Aerodynamics"
first to scientifically define 4 flight forces
proposed fixed-wing machines with separate systems for lift, propulsion, and control.
1st successful manned glider model which featured cambered wings, establishing basic blueprint for all future A/C
The Wright Brothers (1903)
developed a lightweight 12-horsepower engine and propellers acting as rotating airfoils.
Golden Age of Aviation (1918-1939)
Period of rapid transformation from slow, wooden biplanes to faster, all-metal Monoplanes.
World War II Aviation Impact
introduction of Radar, paving way for Jet age.
The Jet Age Manufacturers Focus
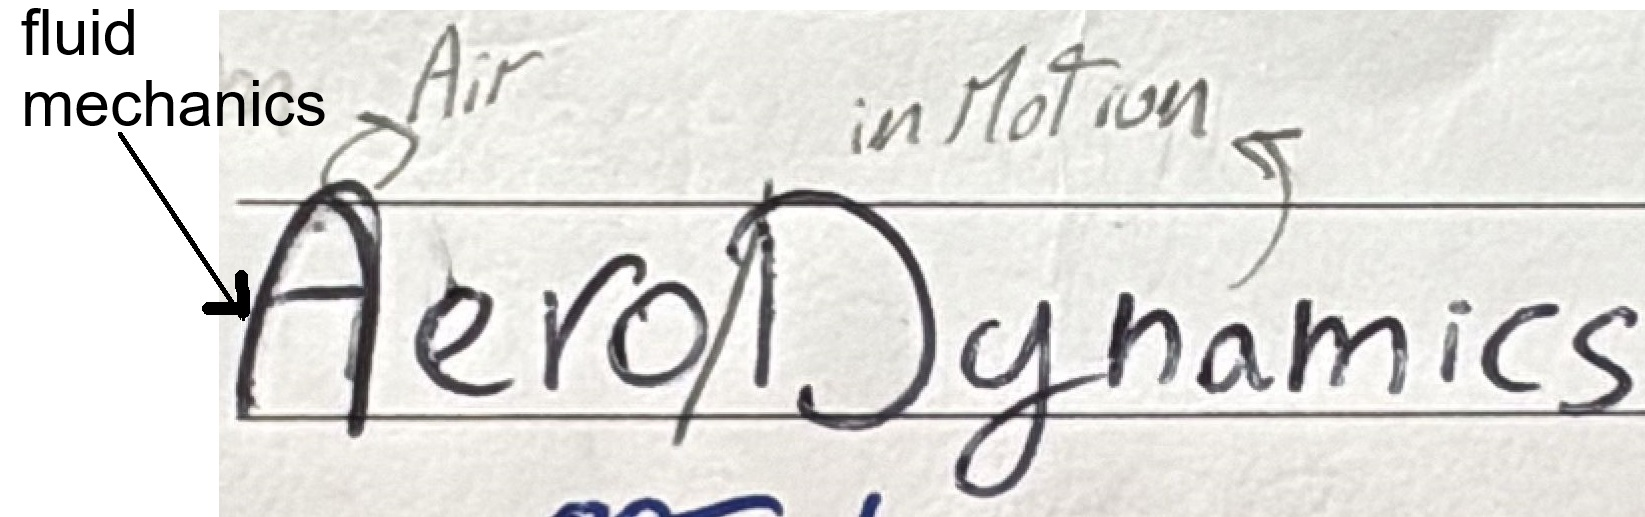
Aerodynamics
Propulsion
Flight Controls.
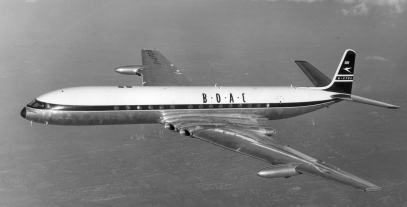
de Havilland Comet (1952)
World’s 1st commercial jet airliner

de Havilland Comet Crew
Required a crew of 4:
2 pilots
1 flight engineer
1 navigator.
Modern Jetliner Performance
A/C routinely cruise at
over 500 mph (Mach 0.85)
altitudes above 40,000’
Aerodynamics
Branch of Fluid Mechanics studying
Air in Motion
Forces Acting on Bodies moving Through it
(Main science that Aviation is Based on)
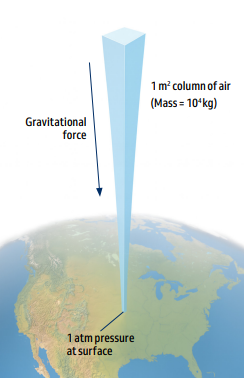
Pressure (Atmospheric or Barometric)
Force per Unit Area Exerted on a body, Above Atmospheric Column (F/A)
Decreases as Altitude Increases
Pressure Altitude
Altitude in ISA where; pressure = observed pressure; indicated when
altimeter is set to 1013.25 hPa (29.92 inHg)
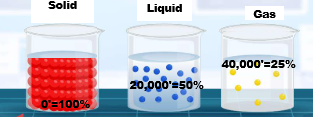
Density
Mass per unit Volume (M/V)
when Density↑, Performance↑
Typical Density Values by Altitude:
@ 20,000’ →D=50% of Surface value.
@ 40,000’ →D=25% of Surface value.
@ 60,000’ →D=10% of Surface value.
Density Altitude (densityعكس ال)
Pressure Alt. Corrected for Non-Standard Temp. ;
Critical performance parameter for
Engine Output
Aerodynamic Efficiency
High Density Altitude
Hot days or high elevation airports; results in
⬇Density
⬇Performance.
Low Density Altitude
Cold days or sea level conditions; results in
⬆Density
⬆Performance.
Temperature and Pressure Relationship
Inversely related at a given altitude;
as temperature increases, density and pressure decrease.
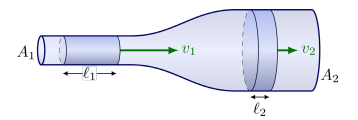
Law of Conservation of Mass
Matter (Mass) cannot be Created nor Destroyed;
in Subsonic Steady flow; Entering = Exiting
Continuity Equation
Product of AXV (areaXvelocity) is Constant
‘Smaller area makes air Speed up’
‘Larger area makes air SLow down’
because Same Mass must Pass Through
A1 × V1 = A2 × V2
Leading to Bernoulli’s Equation.
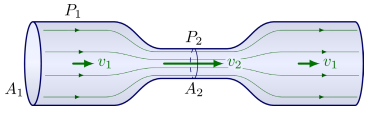
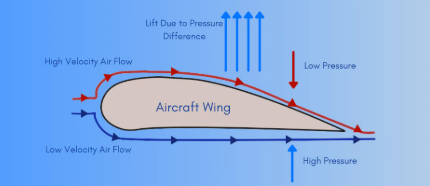
Bernoulli’s Principle
As Velocity⬆ Increase Press. ⬇ Decreases
Airfoil shape (curved upper surface) causes air over wing to accelerate,
creating lower pressure above wing.
Differential Pressure Creating Lift.
Above (⬆ Velocity, ⬇Pressure)
Below (⬇ Velocity,⬆Pressure) the Wing.
Air naturally flows from high to low pressure.
Higher pressure below the wing + lower pressure above creates lift.
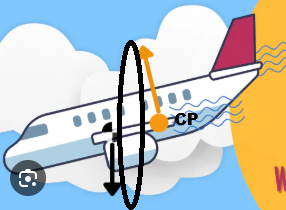
The total aerodynamic force from pressure distribution acts through the Center of Pressure (CP). ✈
Newton’s First Law (Law of Inertia)
“Inertia”
-Body in Rest Remains in Rest
-Body in Motion Remains in Motion @
Constant Speed
Same Direction
Unless acted upon by an External Force,
such as Engine Thrust Overcoming Inertia

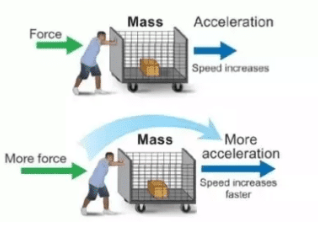
Newton’s Second Law (Law of Acceleration)
F = M x A
Acceleration is:∝ to Net Force & 1/∝ to Mass
Heavier A/C accelerate Slowler @ same thrust as lighter one.
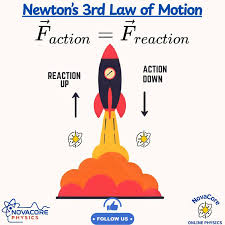
Newton’s Third Law (Action-Reaction)
Actions have Reactions,
Equal in Force & Opposite in Direction
Jet engine Pushes air Backward (Action) to
Propel A/C Forward (Reaction)
Velocity
rate of change of position with time in one direction
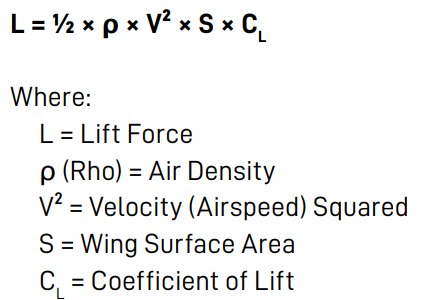
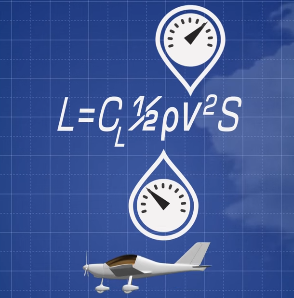
Lift
Upward Force created by Differential Pressure (Above & Below Wing)
L = ½ × ρ × V² × S × CL
Directly Proportional to;
Air Density (ρ)
Velocity Squared (V²)
Wing Surface Area (S)
Coefficient of Lift (CL).
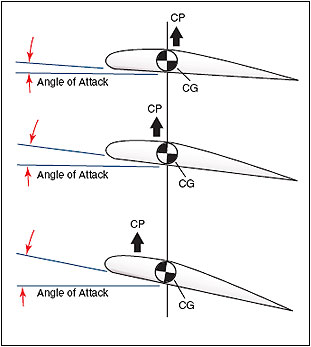
Center of Pressure (CP)
Point On MAC where Aerodynamic Force Acts
resulting from Pressure Distribution
Coefficient of Lift (CL)
Dimensionless Number representing;
Lift Generation Efficiency
depending on: Shape & Inclination of airfoil.
Relative Wind
Air moving in;
Opposite Direction
Parallel to Airfoil.
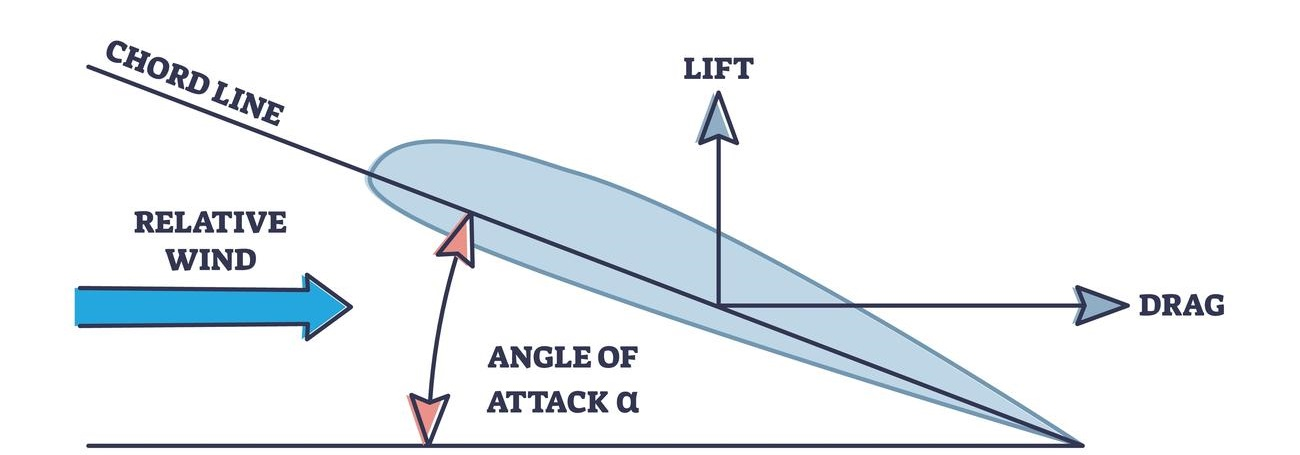
Angle of Attack (AOA or α)
Angle° between:
Chord line & Relative Wind Opposing it

Maximum Lift Coefficient (CLmax)
where Highest Efficiency is Achieved.
As AoA ⇡, CL ⇡ (Linearly)
Until reaching Critical Angle of Attack. before Stall occurs.
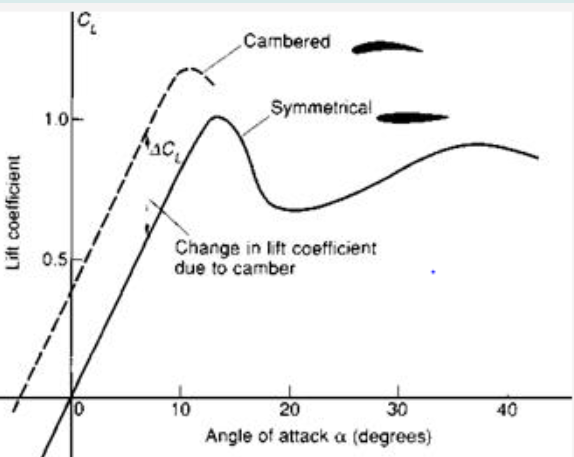
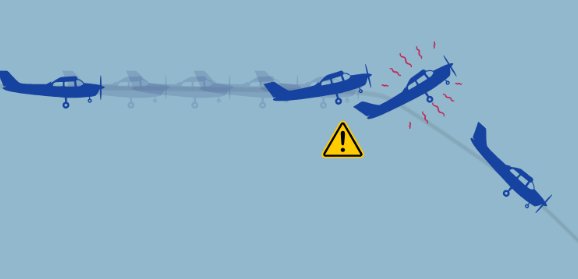
Stall
Rapid Decrease in Lift caused by
Separation of Airflow from wings surface,
Leading to a Rapid decrease in CL.
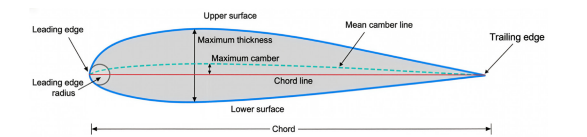
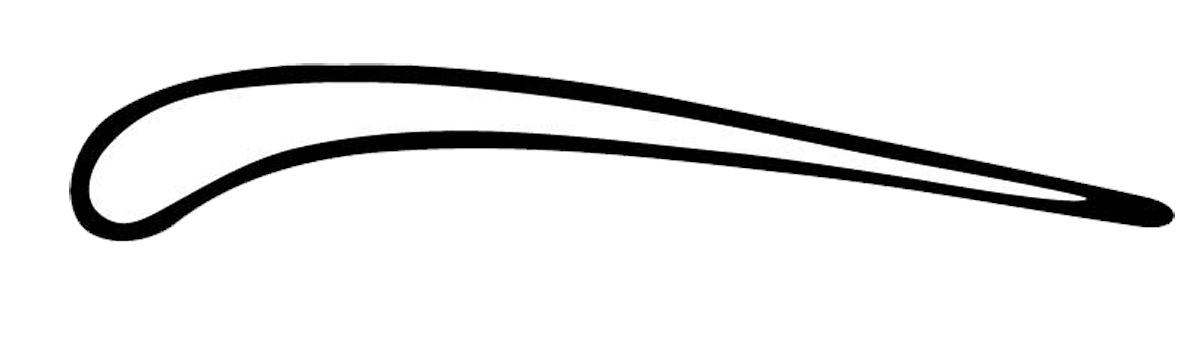
Basic Elements of the Wing
-Leading Edge; meets the Oncoming air,
-Trailing Edge; where airflow Reunites.
-Chord Line; Straight Line between them,
-Mean Camber Line: Halfway between Upper & Lower surfaces.
-Camber; Max. Dis. between them, Measures Curvature of Wing
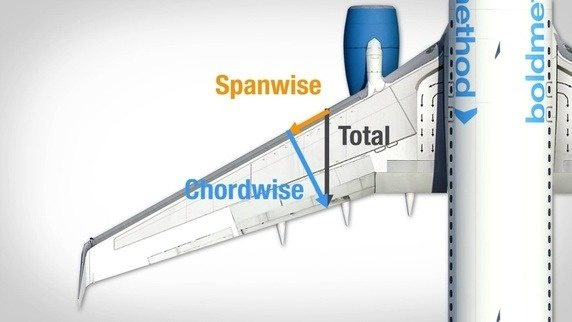
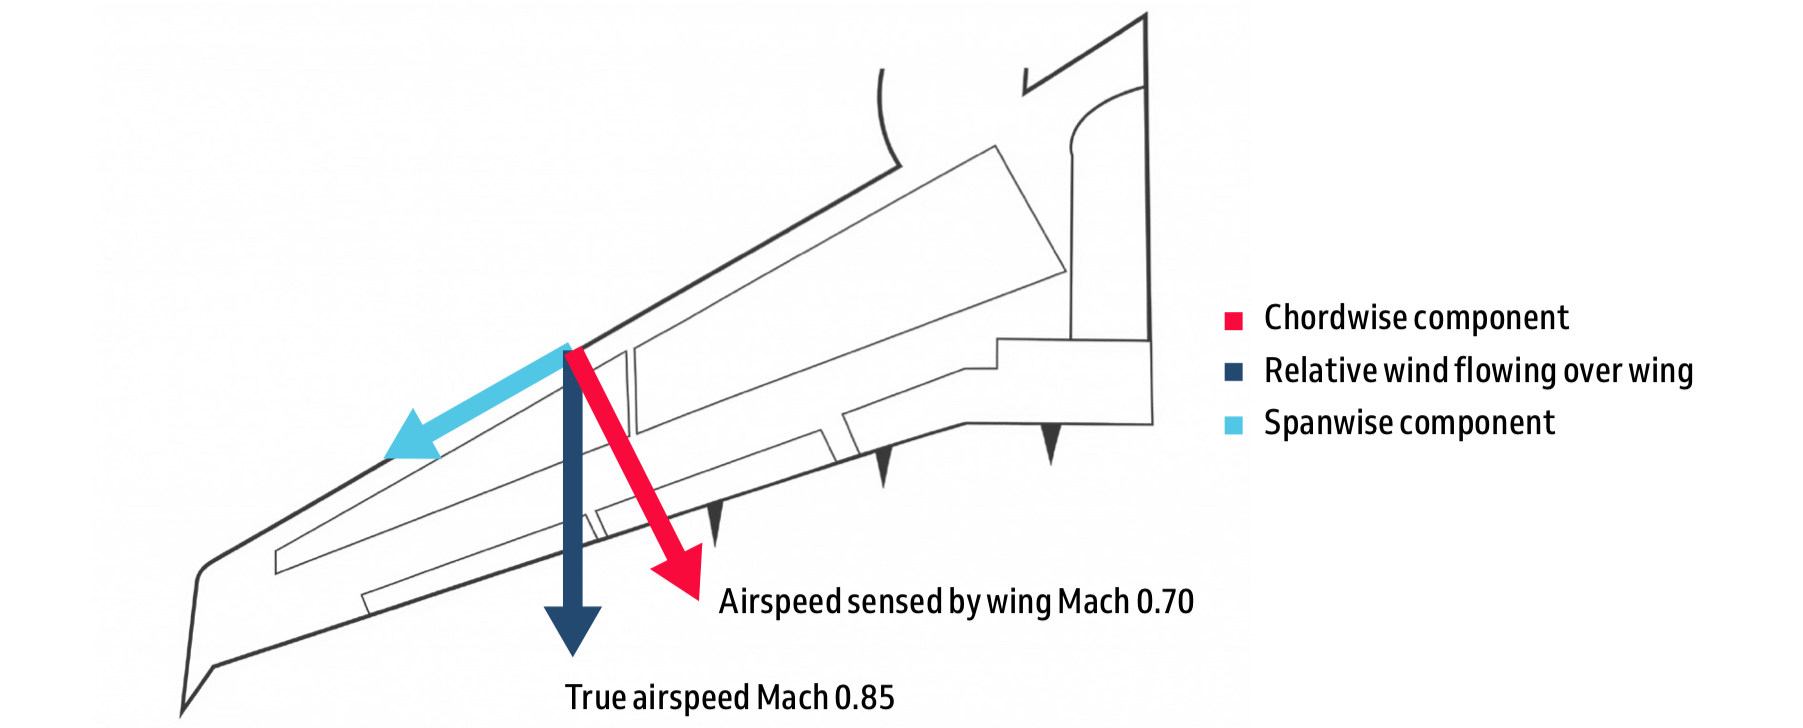
Swept-Wing
Effective velocity component;
Perpendicular to Leading edge (chordwise flow)
Less (<) True Airspeed (TAS).
Indicated Airspeed (IAS)
speed Observed on airspeed Indicator, Reference for ;
Aerodynamic Forces (Crew Usage)
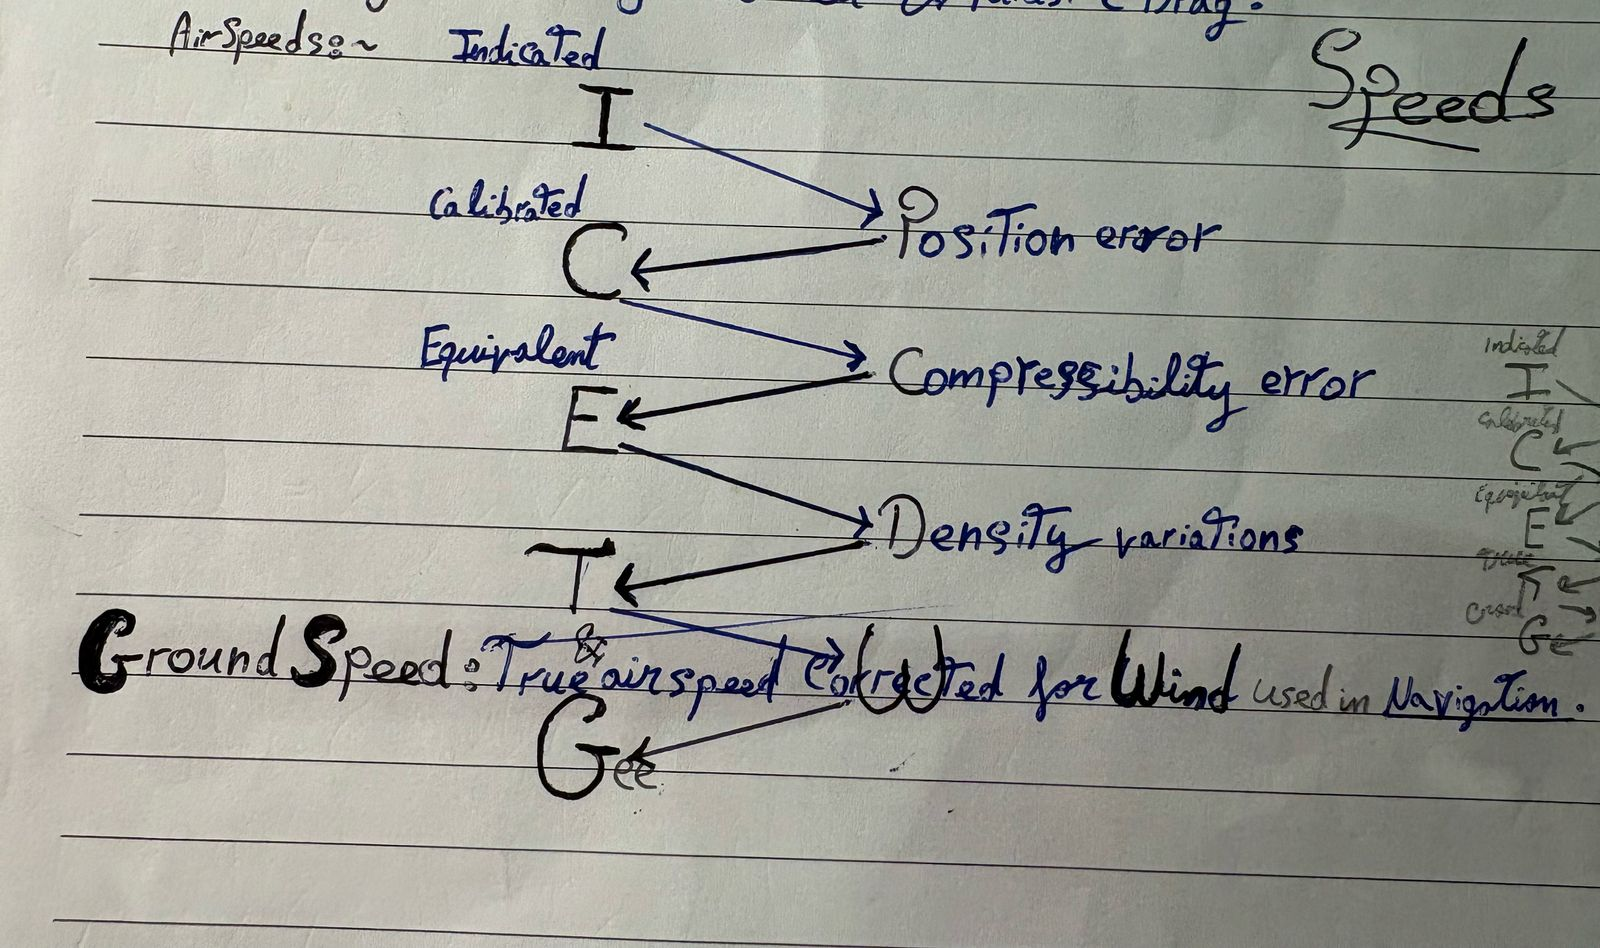
Calibrated Airspeed (CAS)
IAS corrected for Positioning errors→closer to true dynamic pressure.
Used for;
Performance Calc.
Determining regulatory speed limits (V-speeds)

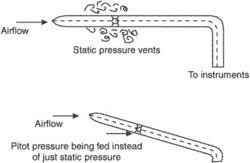
Position Error
Error in Airspeed/Mach indications caused by:
location of the pitot-static ports on the aircraft fuselage.
Causes:
Static ports measure pressure on the aircraft skin, not the true free-stream atmospheric pressure.
Airflow around the fuselage distorts pressure.
Therefore: Measured static pressure ≠ True ambient static pressure.
Main Factors Affecting It
Aircraft attitude (Angle of Attack)
Airflow direction
Aircraft speed
Effect on Indications:
Causes difference between Indicated & Actual values, especially:
Airspeed
Mach number
Mach Number Effects
Indicated Mach ≈ True Mach at normal speeds.
Near Maximum Demonstrated Mach (Mmo) → position error increases due to pressure changes around pitot/static ports.
Some modern jet Mach indicators intentionally over-read at high Mach to compensate.
Correction
Correction charts in Flight Manual if the error is significant.
Modern aircraft: Air Data Computer (ADC) automatically applies the correction.
Equivalent Airspeed (EAS)
CAS corrected for Compressibility error, represents
Actual Dynamic Pressure (1/2pXv²) for Structural Analysis.

True Airspeed (TAS)
EAS corrected for Density variation;
Actual speed relative to Undisturbed Air.

TAS Rule of Thumb
TAS ⇡ compared to IAS
as Altitude ⇡
Ground Speed (GS)
TAS corrected for Wind variation
Actual speed over Ground.
Used in: Navigation

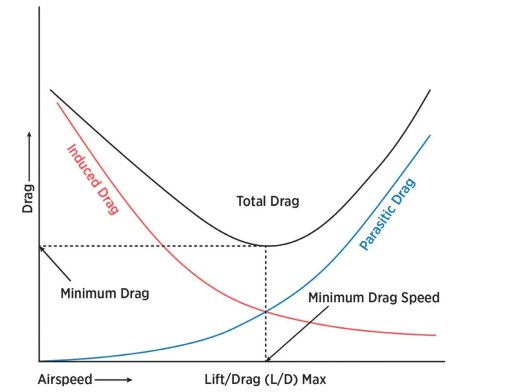
Drag
Any force Opposing airfoil in its Forward Motion.
acts Parallel to Relative Wind.
2 main types:
-Induced
-Parasite
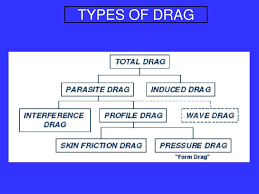
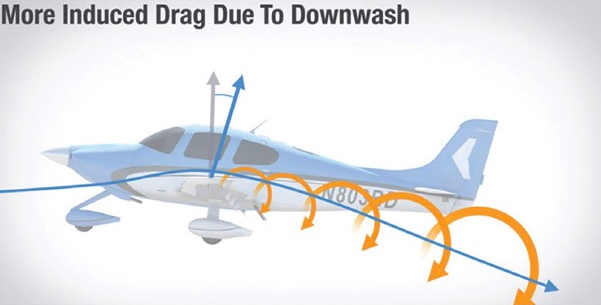
Induced Drag
By-product of Lift
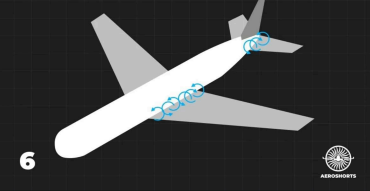
Due to (Downwash): Downward Deflection of air
Creating: Wing Tip Vortices (Wake Turbulence).
Highest @
Low ⇣Speeds
High ⇡AoA°
Parasite Drag
Drag Not Associated with Lift
(Present @ Zero Lift).
⬆with Square of Airspeed (V²),
Dominant @ High Speeds.
This includes
-Form Drag (shape),
-Skin Friction (surface roughness),
-Interference Drag (interaction between adjacent parts)

Form Drag
Parasite drag: Resulted from Turbulent wake,
Caused by Shape (form) of A/C.
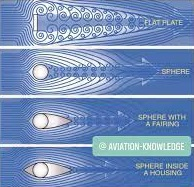
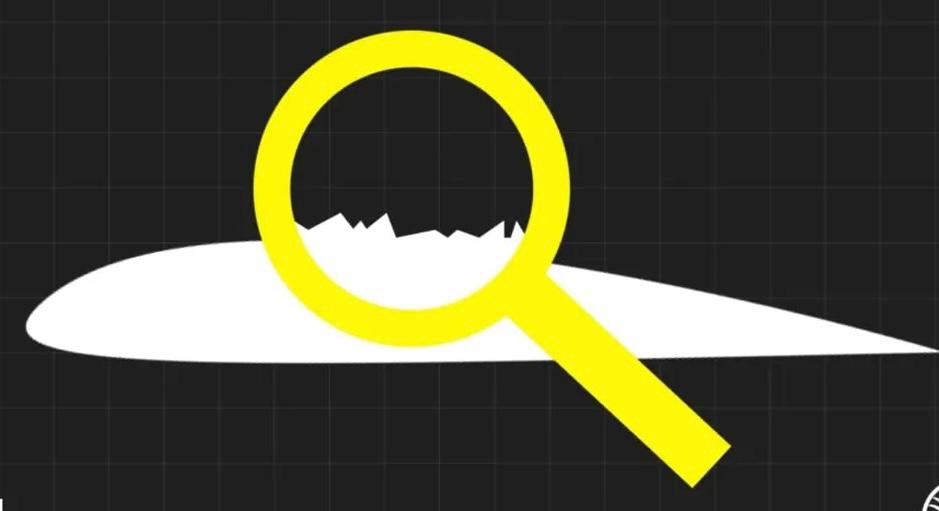
Skin Friction Drag
Parasite drag; due to A/C’s Surfaces Roughness (e.g., rivet heads, paint)
as Air Molecules Pass Over Surface.
Interference Drag
Parasite drag Generated by Interaction of airflow
between 2 Adjacent parts (e.g., wing & fuselage).
Total Drag
Total Drag = Induced Drag + Parasite Drag.
The Total Drag curve has a minimum point.
This minimum occurs at L/Dmax (Maximum Lift-to-Drag Ratio) speed.
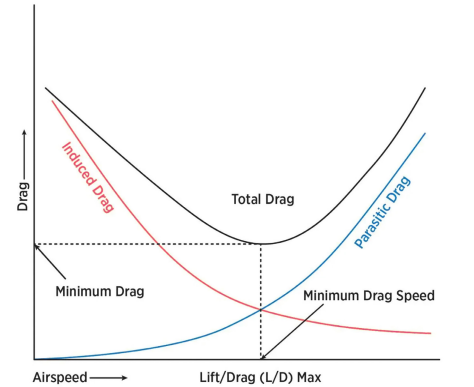
L/Dmax (best Lift to Drag ratio)
Total Drag Curve Minimum; Point where Total Drag is at its Minimum.
Providing Best:
-Glide Range
-Cruise Performance Efficiency.
Thrust
Force generated by engines that;
Opposes drag
acts Parallel to Thrust-Line
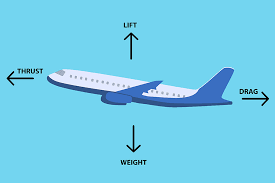
Steady Unaccelerated Flight
Condition where is an Equilibrium in
Lift, Weight, Thrust, Drag
High-Speed Wing Design
Minimize ⇣ Drag & Delay Compressibility, Require Wings to be;
Thin (little camber)
Swept-back
Low-Speed Wing Design
Generate Sufficient ⇡Lift @ low ⇣Speeds for T/O & landing, Requires:
Thicker wings (more camber)
high-lift Devices (flaps/slats)
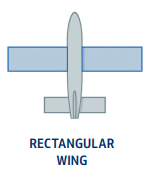
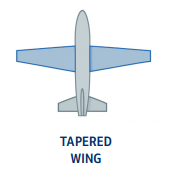
Wing Planform
Rectangular
Elliptical
Tapered
Delta
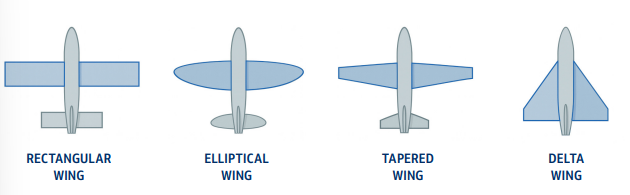
Rectangular Wing
Simple to Manufacture→Good Stall Characteristics (Root stall 1st),
but Aerodynamically Inefficient→High Induced ⇡ Drag
Common @ Light Low speed A/C
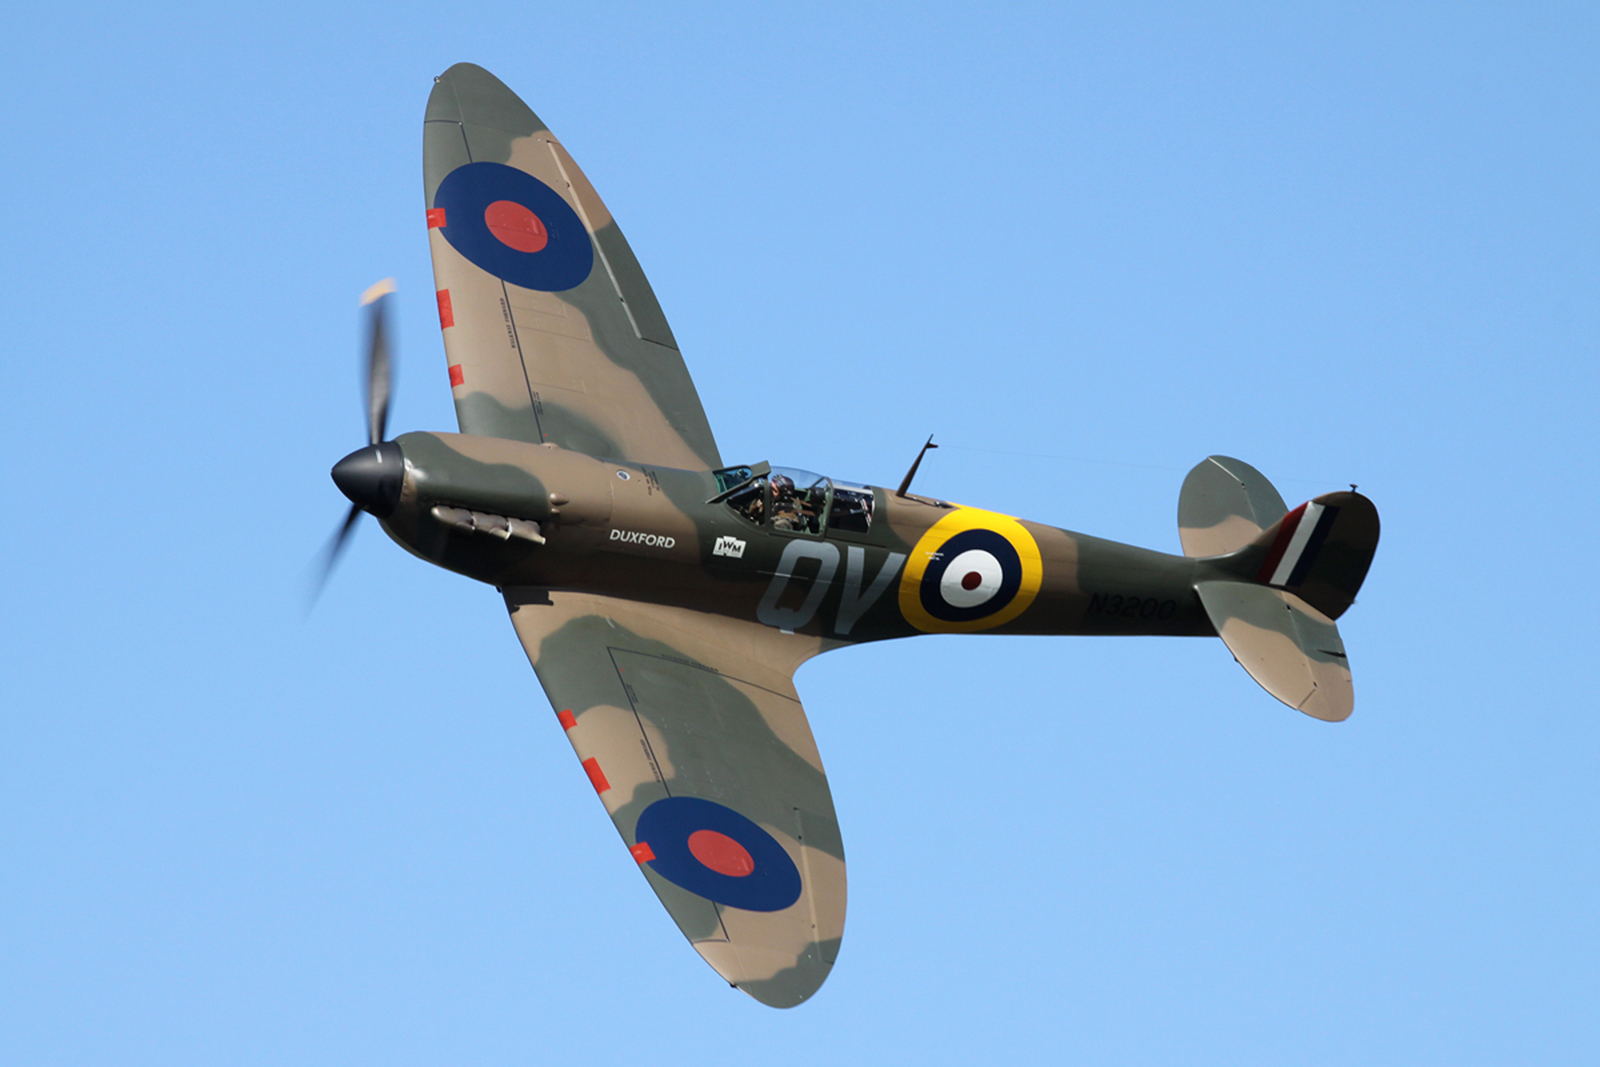
Elliptical Wing
Minimizes ⇣ Induced Drag,
but Complex & Expensive to Manufacture (e.g., Spitfire).
Tapered Wing
Practical Compromise Reducing ⇣ Weight & Drag;
Common for Jet transports.
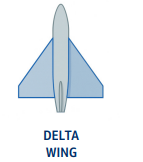
Delta Wing
Low ⇣Aspect Ratio;
Excellent for→High-speed/supersonic flight
but has Poor→Low-speed Performance.
Factors Affecting Aerodynamic Forces
of the Wing
(3eS,@,MAD)
Divided into 3 parts,
1st; Wing's
1. Surface Area (S)
2. Span
3. Sweep Back Angle
Then
1. Aspect ratio
2. Taper ratio
3. Thickness to chord ratio
Lastly,
1. Mean aerodynamic chord (MAC)
2. Angle of incidence
3. Diherdral angle
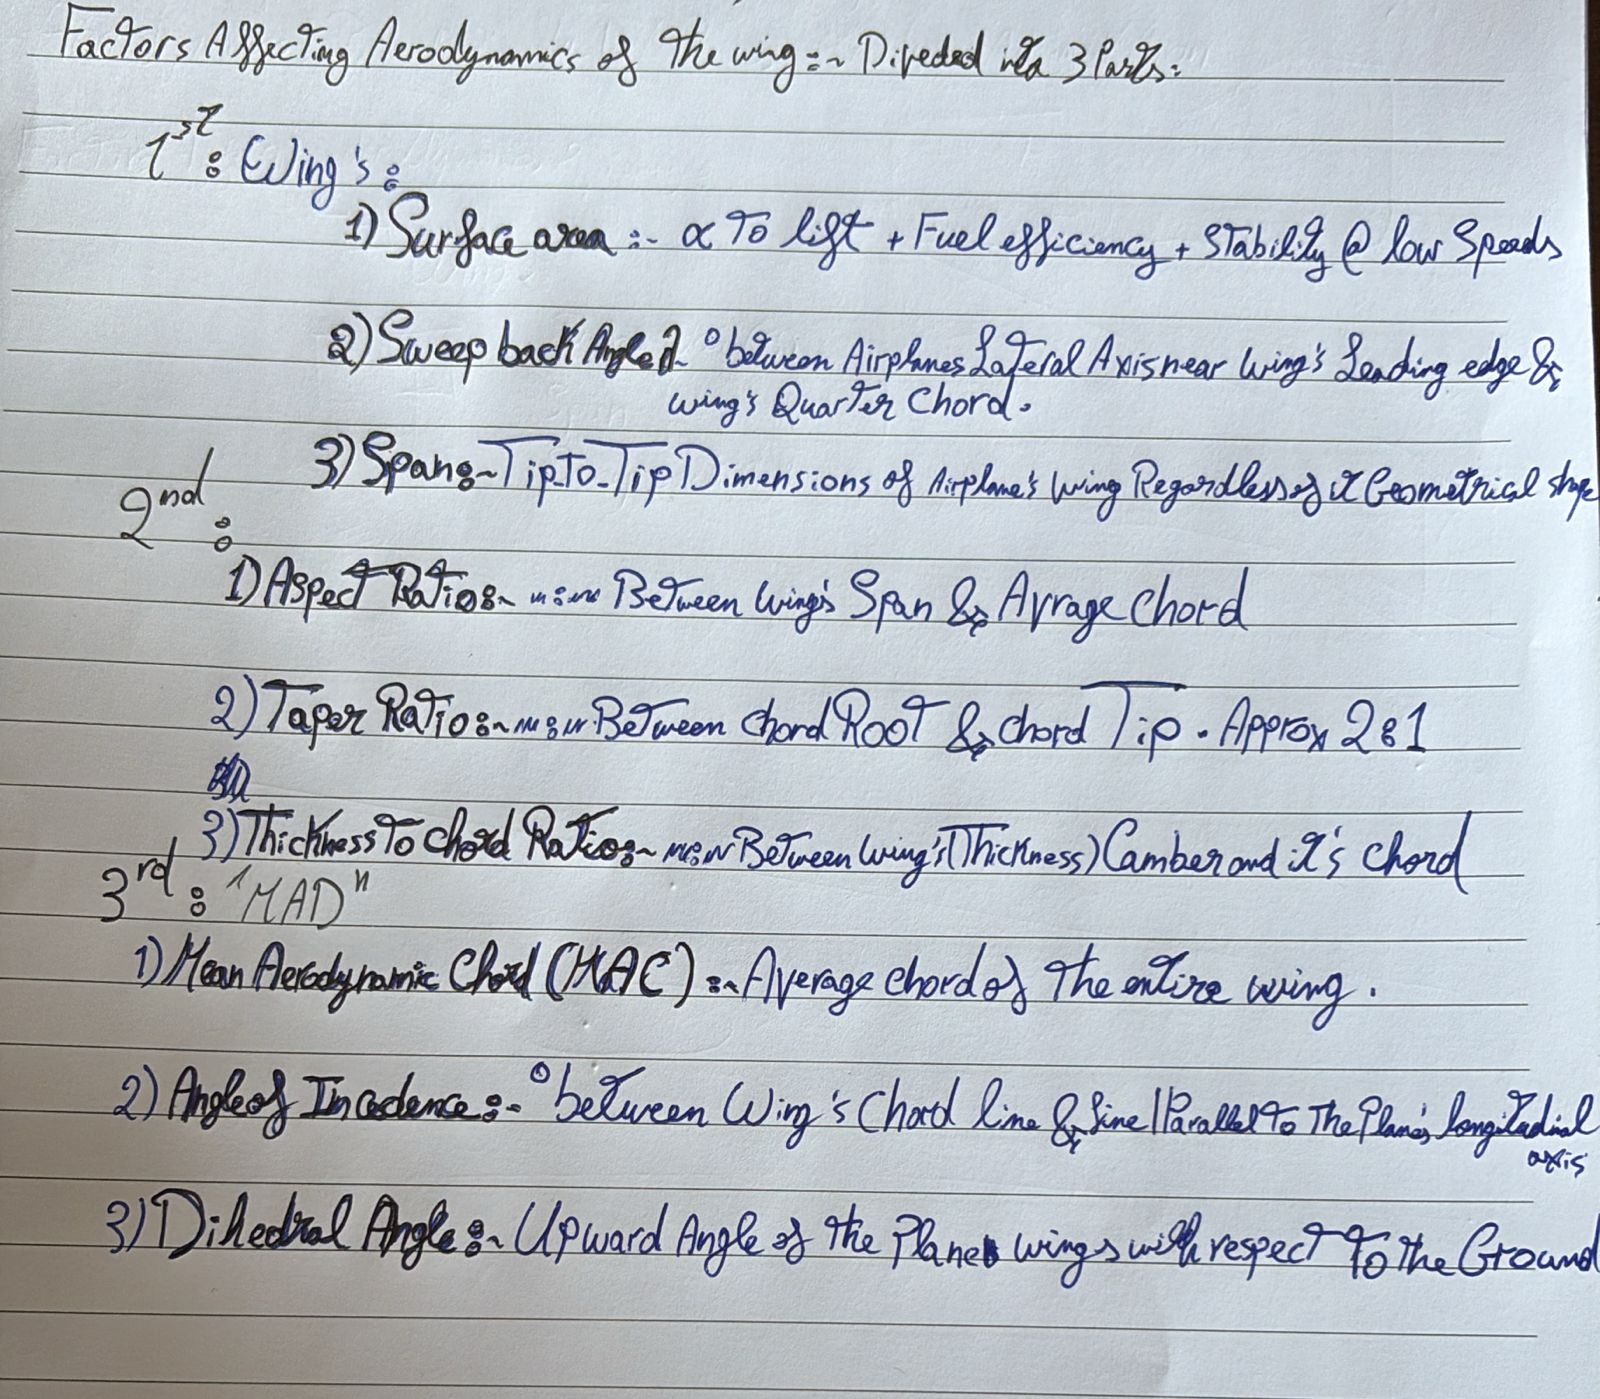
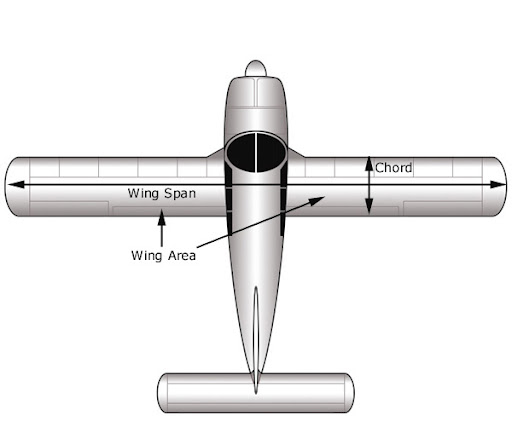
Wing Area (S)
∝ to Lift
if increased can
Better ⇡Stability @ Lower ⇣Speeds

Wingspan (b)
Tip-to-Tip Dimension of A/C wing,
⇡Wingspan= ⇣induced Drag (by weakening wingtip vortices)
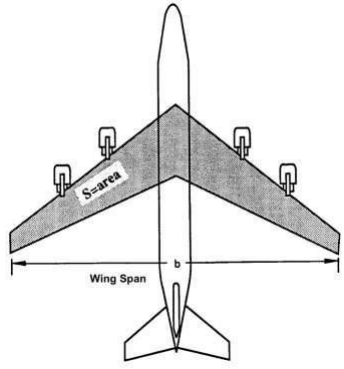
Wing Sweep (Λ - Lambda)
Angle° between a line Perpendicular to A/C’s Centerline
and Wing’s Quarter-chord;
Delays Compressibility Effects.
Allows Higher TAS before airflow over wing reaches Sonic-speeds
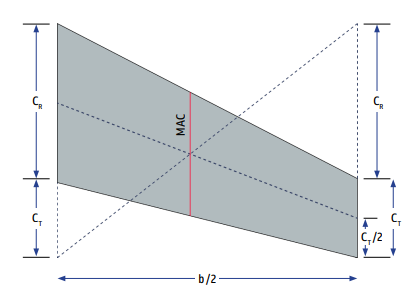
Mean Aerodynamic Chord (MAC)
imaginary rectangular wing Having actual Wing’s Same;
Aerodynamic Characteristics
Pitching Moment
CP moves along MAC
CG expressed as % of MAC length.
MAC is important for weight & balance Calculations and Longitudinal Stability. ✈
Aspect Ratio (AR)
Ratio Between Wing’s Span / Average Chord
AR = b² / S
High Aspect Ratio Characteristics
Long & Narrow; produces
Less induced Drag;
Efficient for Slow flight & Endurance.
Low Aspect Ratio Characteristics
Short and Stubby;
generates More induced drag.
Stronger & Suited for High speeds
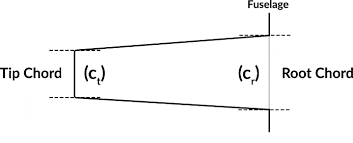
Taper Ratio
Ratio of Tip chord to Root chord;
helps Approximate Elliptical Lift-Distribution.
Reduce induced ⇣ Drag & Weight
Thickness-to-Chord Ratio
Ratio of maximum thickness to chord length;
Thin wings are essential for high-speed flight.
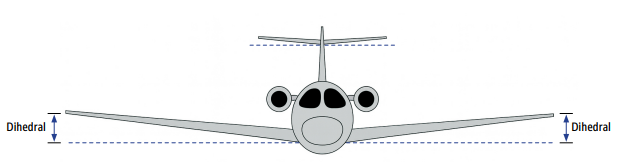
Dihedral (Γ - Gamma)
Upward° angle of wings from horizon;
Contributes to Lateral Stability.
If banked, Lower wing presents Higher AOA, generating more Lift to Restore Level Flight
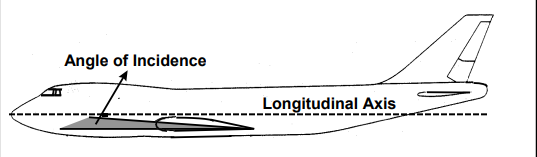
Angle of Incidence
Angle between Wing’s Chord Line &
a line Parallel to plane's Longitudinal axis.
Slightly ⬆Increasing AoA during Cruise
Compressibility
Change in the Volume of matter
when External Force is Applied
Speed of Sound
Distance traveled per Unit time as sound wave Propagates
Directly proportional ∝ to Temp.
Depends on Medium (Compressibility & Density)
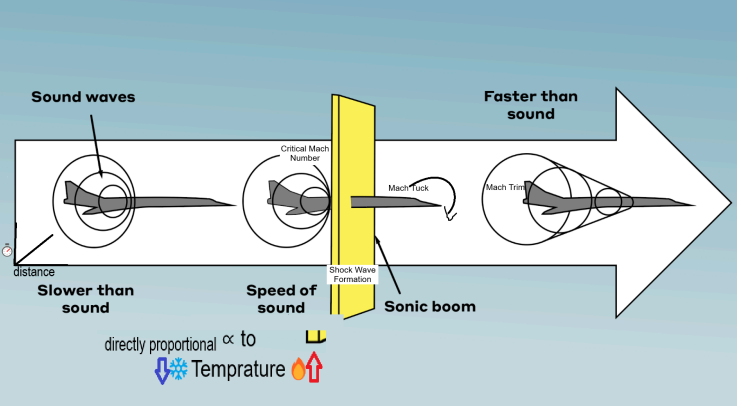
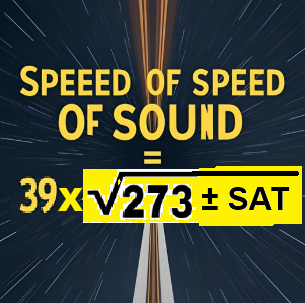
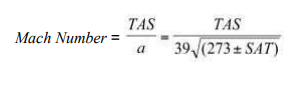
Speed of sound Equation
= 39 ×√273 +SAT °C
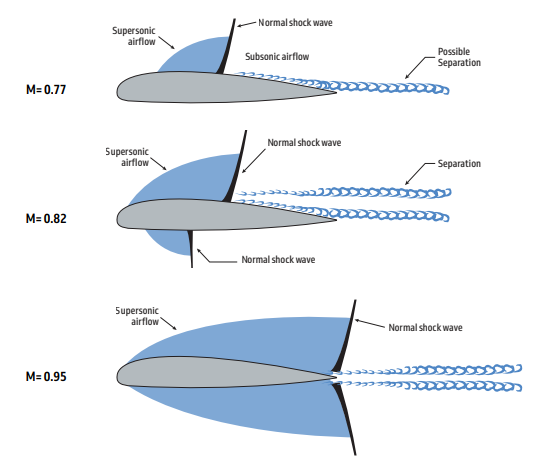
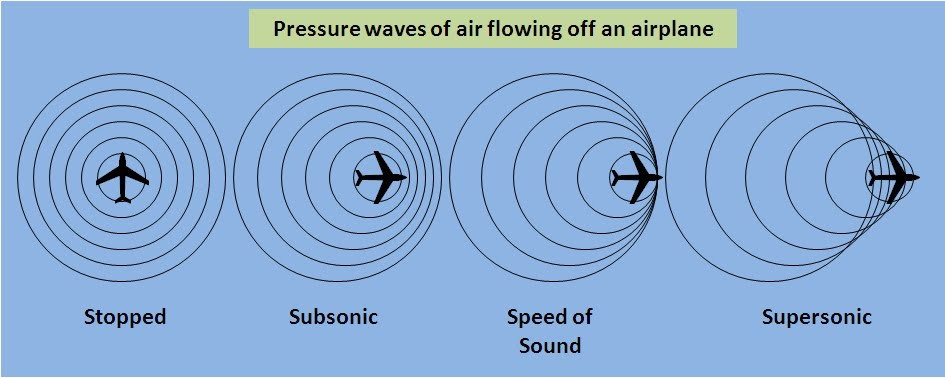
Shock Wave 🍩
Boundry Layer between
Compressed & Undisturbed air
Formed when air is compressed as object moves at or beyond SoS
Sudden changes in temp, pressure, and density occur.
1-⬆increase in TPD
"Temp., Press, Denisty"
1- Sudden ⬇decrease in ‘Velocity'
Wave Drag
Due to Shockwave Formation, Only in Transonic & Supersonic
Mach Number (M)
Ratio between True Air Speed (TAS) / Actual Speed of Sound.
Mach Indicator Error at High Speeds
Position error increases;
Fixed by; over-reading Mach indicators
aircraft speed Regimes
1. Subsonic:Below 0.75
2. Transonic: From 0.75 To 1.20
3. Supersonic: From 1.20 To 5.00
4. Hypersonic: Above 5.00
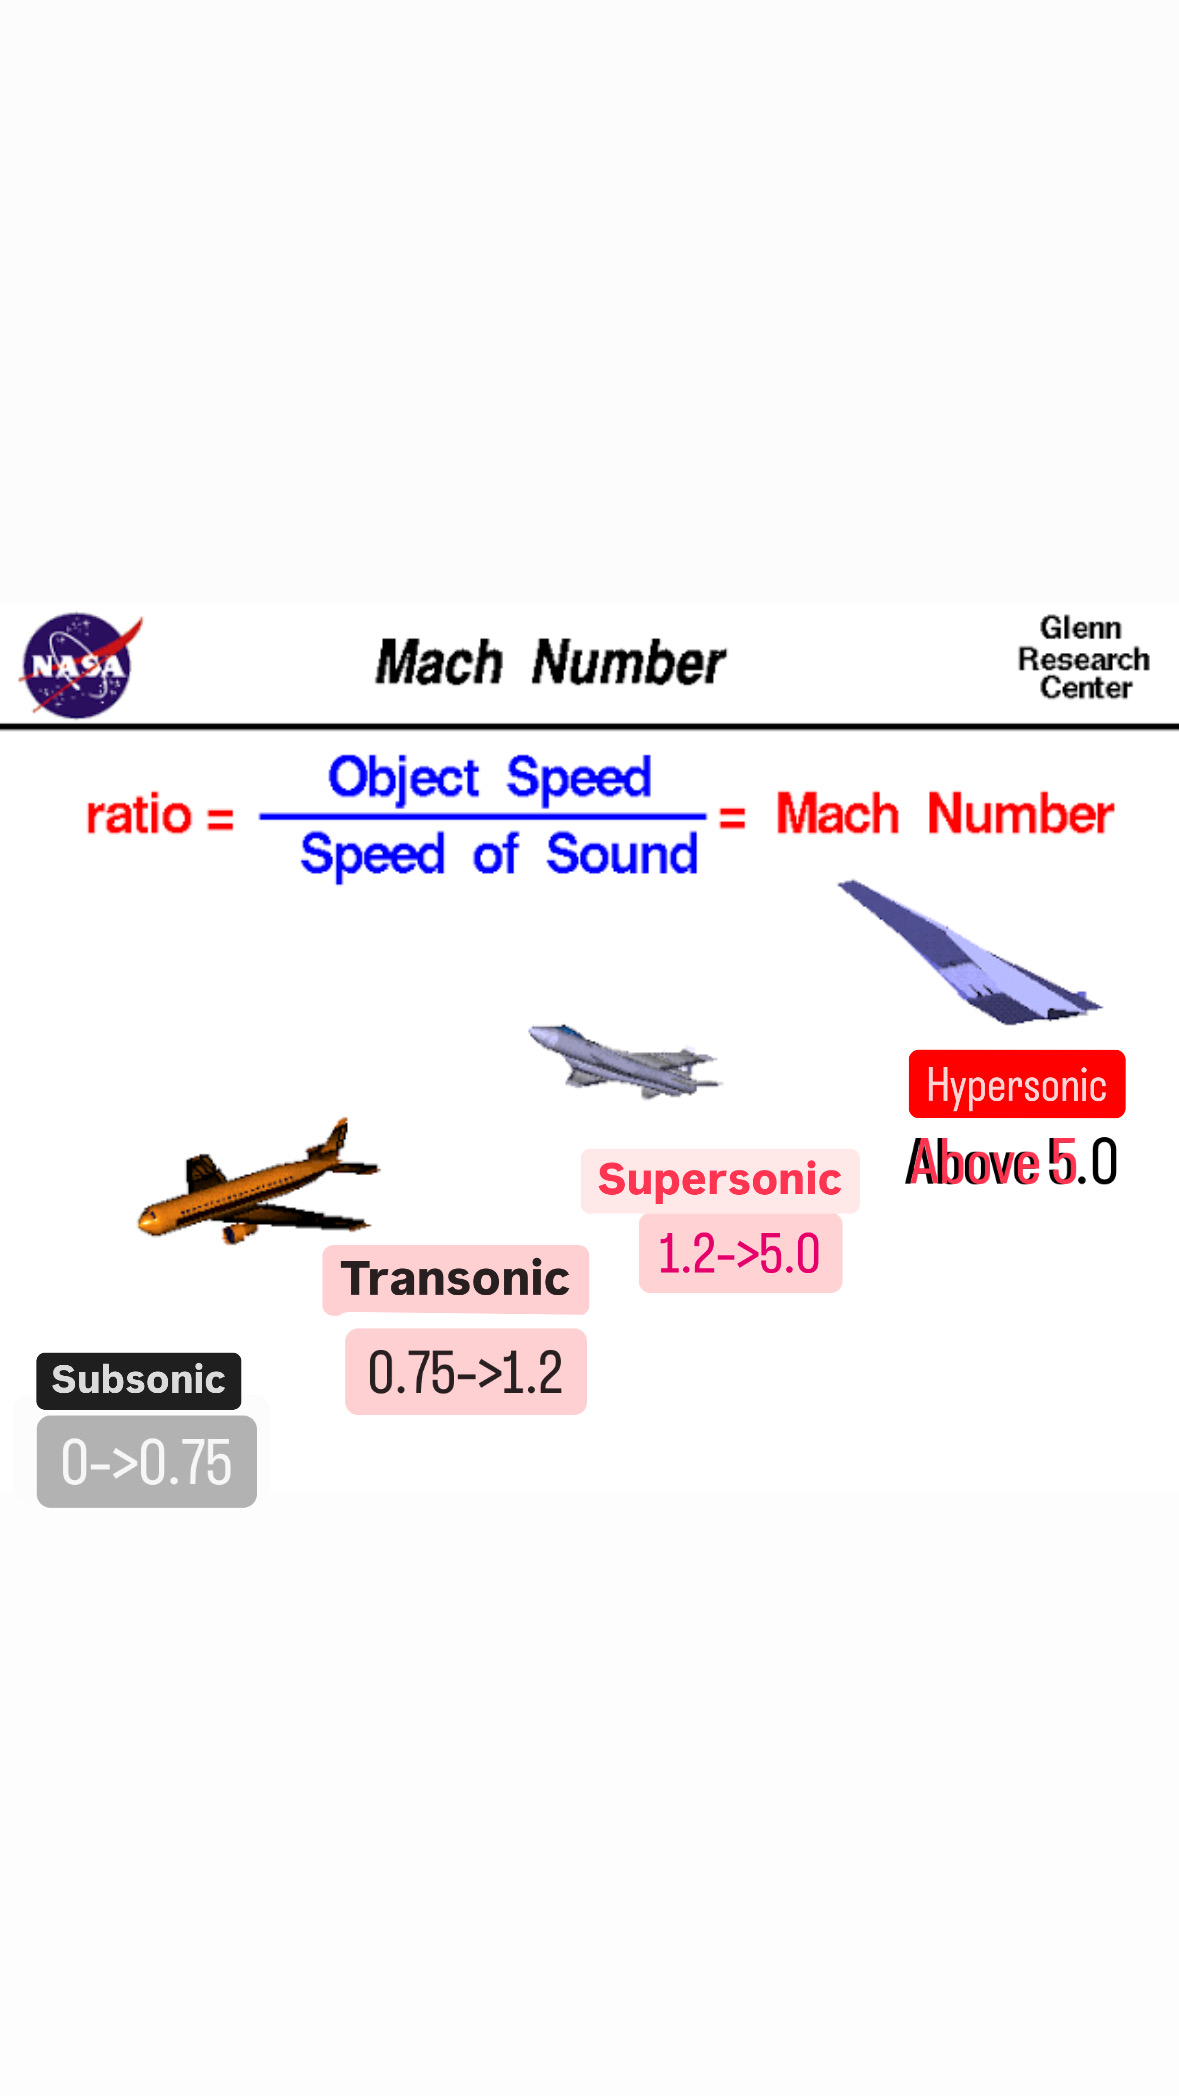
Subsonic Speed Range
Mach numbers below 0.75.
Transonic Speed Range
Mach numbers from 0.75 to 1.20;
greatest effects of compressibility occur here.
Supersonic Speed Range
Mach numbers from 1.20 to 5.00.
Beyond Mach 1.2, the decrease in drag rise enables the aircraft to fly normally
Hypersonic Speed Range
Mach numbers above 5.00.
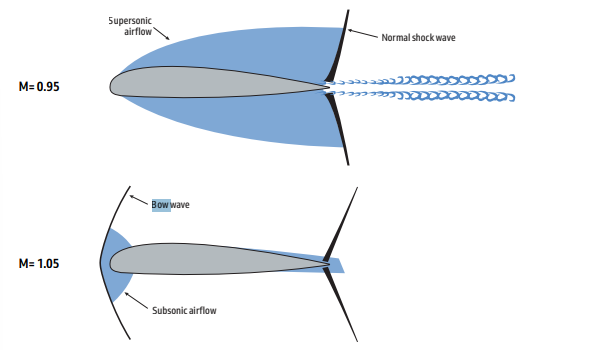
Shock Wave Formation Location
Form when speed is reduced from sonic to subsonic (airflow decelerating over less curved part of wing).
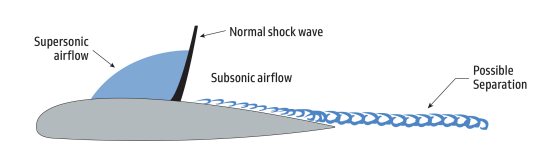
High-Speed Buffet
Caused by wake turbulence found after shock wave.
Shock Wave Development Flow
As speed increases, shock waves move aft toward the trailing edge.
Bow Wave
New shock-wave that forms in Front of Leading edge
as air piles up at supersonic speeds (>1 Mach)
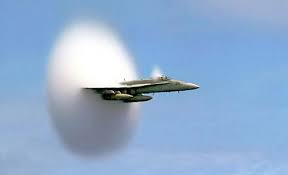
Sound Barrier
Sudden and massive ⇡⇡⇡Drag
during shock wave Formation
Requiring ⇡⇡⇡Thrust to Overcome
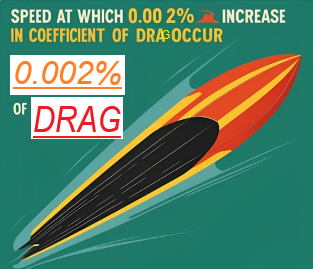
Critical Mach Number
Speed @ which Coefficient of DRAG
⬆\by 0.002%
when Airflow over Any Part of wing Reaches 1 MACH
Stalling Speed
a function of weight & CG, Occuring at fairly Constant EAS, which is;
Min. speed required to keep air attached to A/C’s wings
At very high altitudes, stalling speeds tend to slightly increase.
VMO / MMO
Indicated airspeed to be Intentionally flown,
in knots or in Mach number, Ensuring safe Operation of A/C
MMO is always below Critical Mach number
VDF / MDF
Highest airspeed
Planned to be Flown
in Knots and Mach number
used during Certification Testing
Handling qualities are reduced here.
Factors Increasing Critical Mach
1- Swept Back wing
2- Vortex Generator
3-Less thickness to chord ratio
Swept Wing Critical Mach Benefit
Chordwise airspeed is lower than TAS,
allowing higher speeds before sonic velocity is reached.
Thin Wing Critical Mach Benefit
Produces limited acceleration,
preventing airflow from reaching sonic speed at a given TAS.
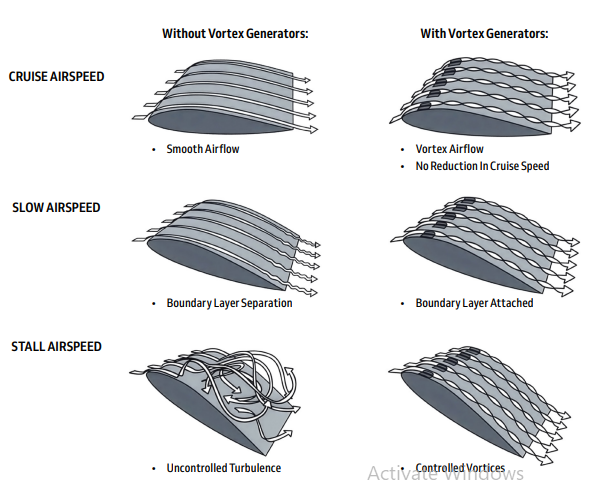
Vortex Generator
Small, low-aspect-ratio vertical airfoil that;
Injects energy into boundary-layer to Delay Separation.
Designed to Penetrate fully through boundary-layer.
⬆Critical Mach, but produce ⬆Drag, making overall Benefit Questionable.
Mach Tuck (Tuck Under)
Nose-down Pitching Moment Due to Shock wave Formation.
caused by AFT movement of CP
Dutch Roll
Coupled yaw-rolling Oscillation
caused by Strong rolling moment of swept wings by;
sudden Gust
Uncoordinated Rudder input,
due to Reduced Inherent Damping
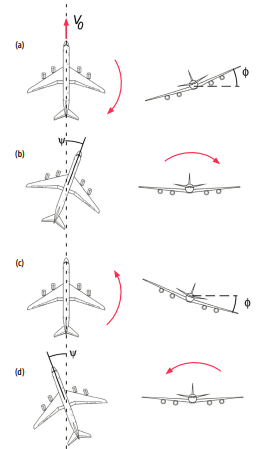
Dutch Roll Recovery
Vertical Fin & Rudder work
with Inertia to Restore Stability
through Damped Oscillations
“Yaw Damper”
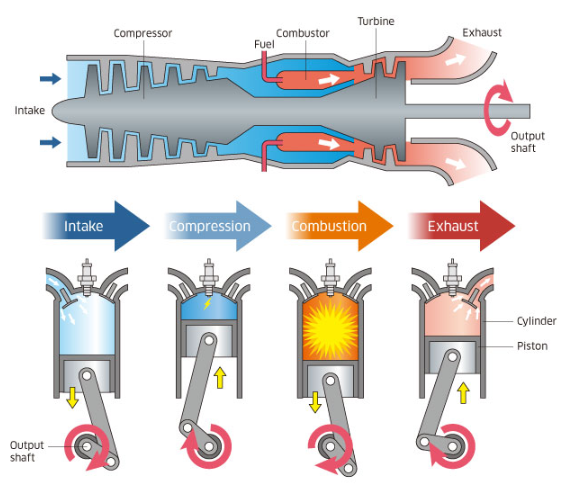
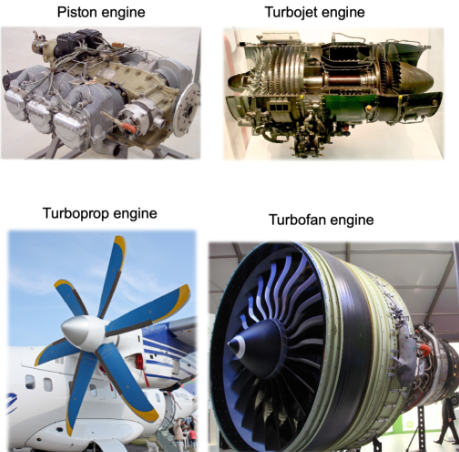
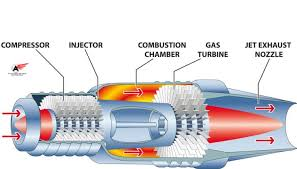
Jet Propulsion
Reactive force resulting from Acceleration of a Mass of air.
2 types;
• Reciprocating Engines (Piston)
• Jet Turbine Engines
Advanced Piston Engine Limit
Maximum of Approx.3,400hp thrust @ sea level.
20 engines needed to provide necessary thrust for a jumbo jet at its maximum T/O weight.
Jet Engine Advantages
• High Power Output per engine
• better Power-to-Weight Ratio (High power, Low weight)
• Small Frontal Area (⬇Drag)
• Low Fuel Consumption at high altitudes
• High overall Efficiency & Reliability
Reciprocating & Jet Similarities
produce power through Gaseous Expansion (burning fuel)
Utilize Ambient Oxygen to support Combustion
Generate thrust by applying Basic Laws of Motion
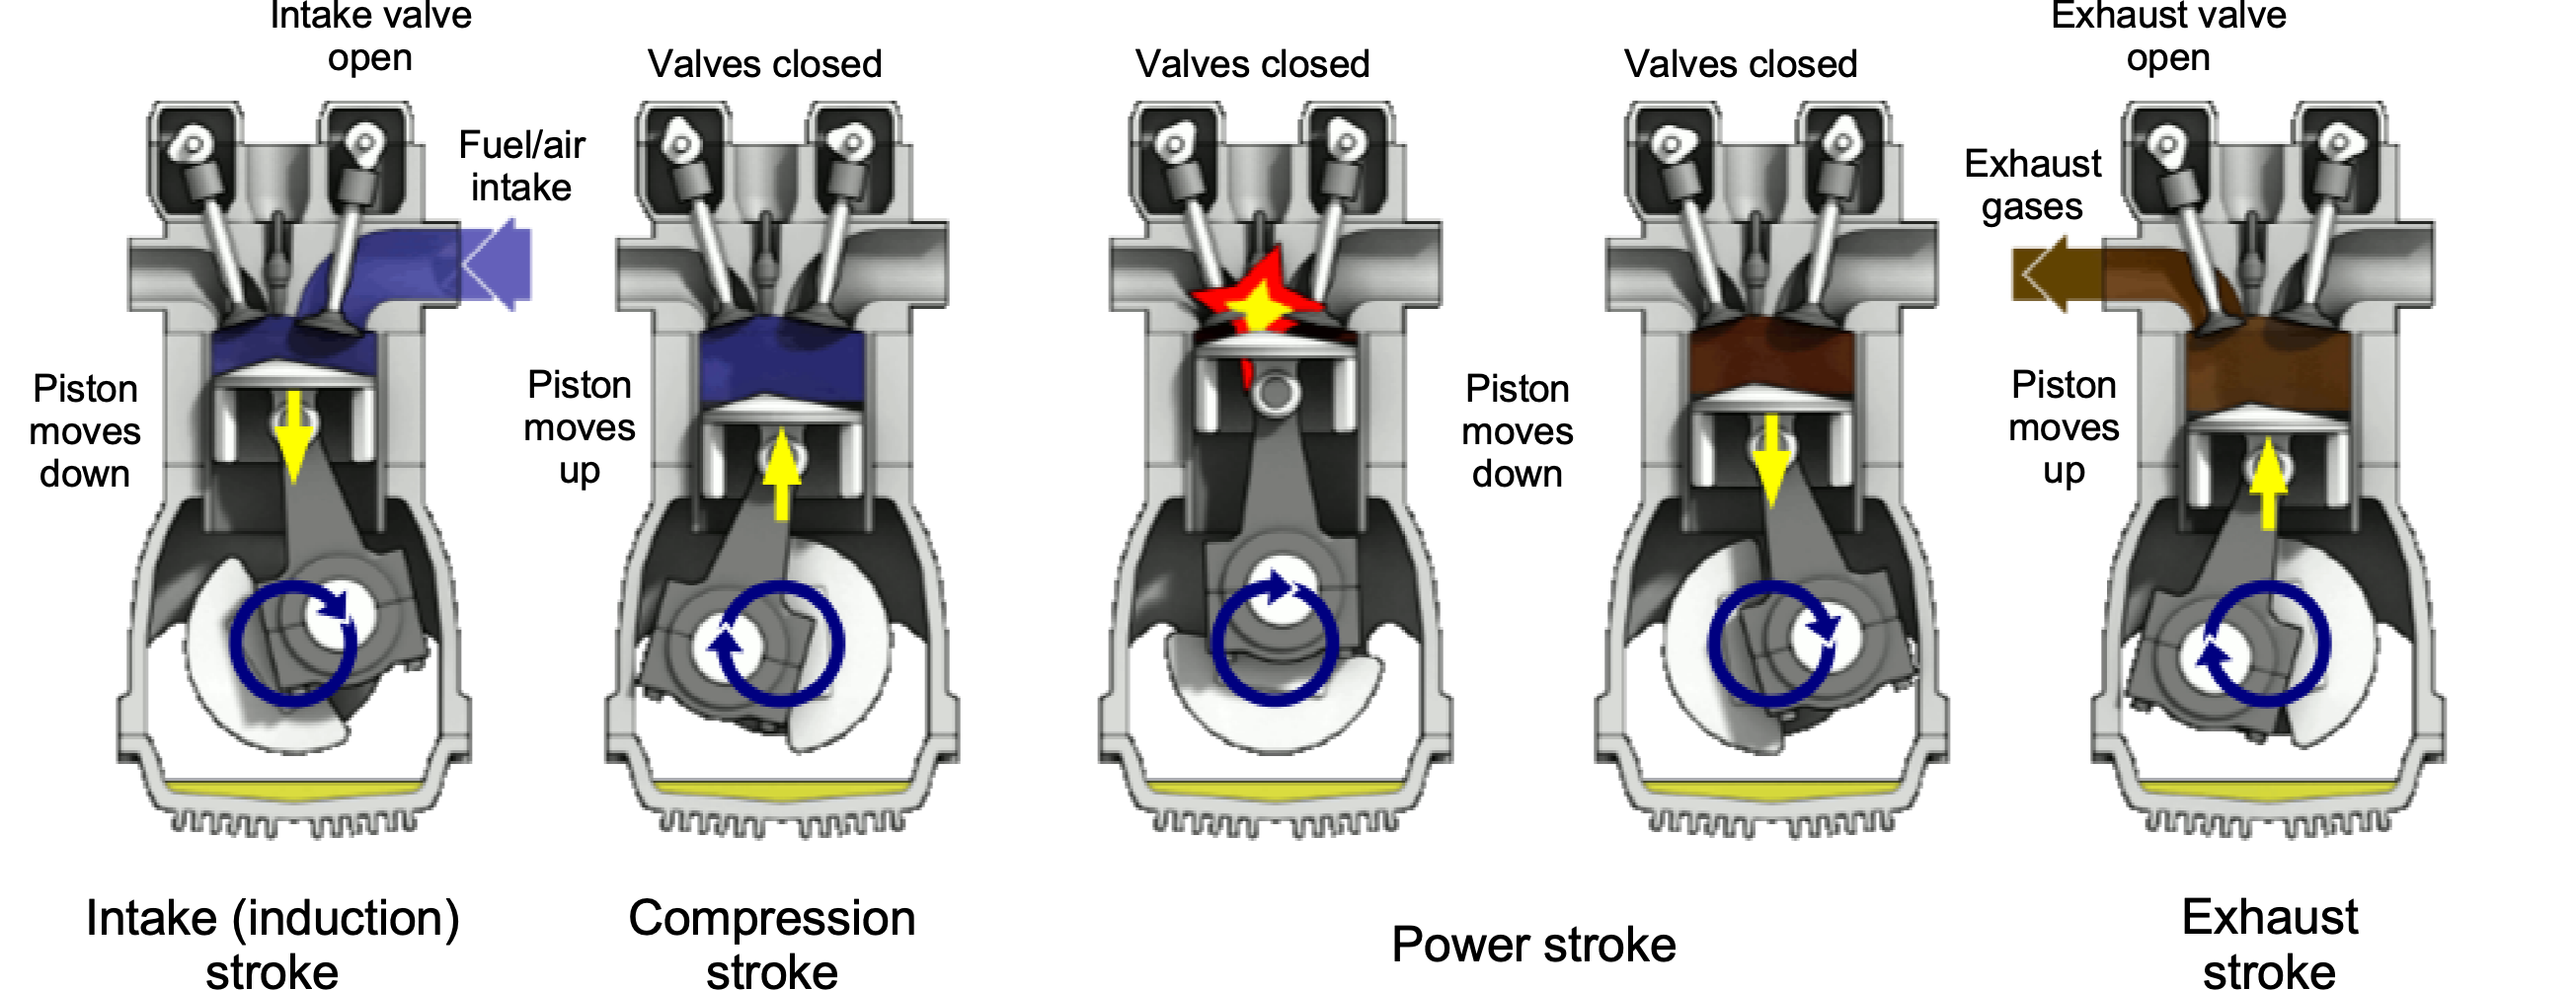
Operate on a 4-stage cycle:
1. Intake
2. Compression
3. Combustion
4. Exhaust