16. Intro to Statistical Inference (Part I)
1/22
There's no tags or description
Looks like no tags are added yet.
Name | Mastery | Learn | Test | Matching | Spaced | Call with Kai |
|---|
No analytics yet
Send a link to your students to track their progress
23 Terms
After selecting a sample, we know the responses for the individuals in the sample, but we usually take a sample to infer some __________ about the population.
conclusion
Since a different sample may lead to different conclusions, we can’t know with certainty that our conclusions are correct. So, we use ___________ _____________ to determine how trustworthy our conclusions are.
statistical inference
In this section, we’ll introduce the two most common types of inference, which are based on the sampling distribution of statistics:
(1)
(2)
confidence intervals
hypothesis tests or tests of significance
To understand the _____ _________ of inference, we will start with a setting that is too simple to be realistic.
basic reasoning
› It is assumed that:
We have an simple random sample from the population of interest.
At least one of the conditions of the Central limit theorem holds.
We don’t know the population mean 𝜇, but we do know the population _________ _________
standard deviation
Statistical Estimation Reasoning:
› To estimate the unknown population mean 𝜇, use the mean x̄ of the _______ _______.
› We know the sampling distribution of x̄.
In repeated samples, x̄ has a normal distribution with mean 𝜇 and standard deviation 𝜎/sqroot(n) .
random sample
If we repeatedly sample from a population with mean 𝜇:
› For __% of all samples, the maximum distance separating x̄ and 𝜇 is 1.96 ( 𝜎/sqroot(n))
95
For a given sample, if we estimate that 𝜇 lies somewhere in the interval x̄ ± 1.96 ( 𝜎/sqroot(n)), we’ll be right approximately __% of the time.
95
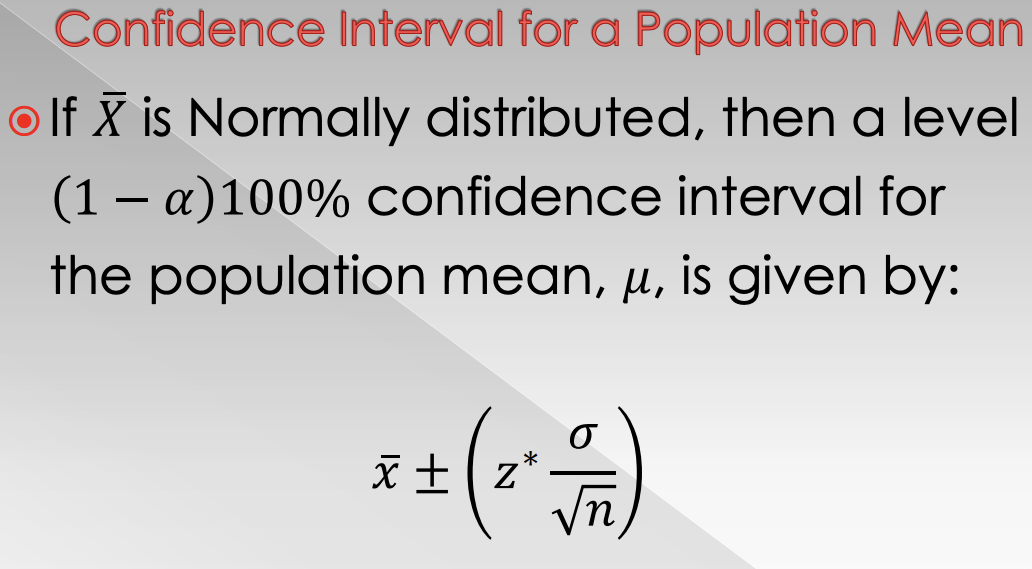
A __________ __________ provides a range of reasonable values that are intended to contain the parameter of interest and provides a measure of our confidence that the parameter of interest is contained in the interval.
confidence interval
A 95% confidence interval tells us that if we were to repeatedly make new estimates using exactly the same procedure (draw a new sample, calculate new estimates, and new confidence intervals), then __% of the confidence intervals would contain the population parameter.
95
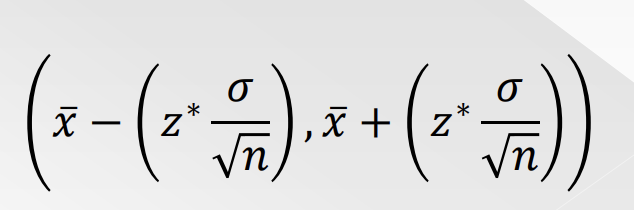
Most confidence intervals take the form:
estimate ± margin of error
› The (point) estimate is our best guess for the unknown parameter and is the center of the interval.
It makes sense to base your interval around you single ____ estimate from each sample.
best
› The margin of error shows how ________ we believe our guess is, based on the variability of the estimate (standard error).
accurate
The confidence level of a confidence interval refers to the _______ rate of the method in capturing the parameter of interest.
success
Notice: 𝜇 is fixed…either it falls in the confidence interval or it does not.
› Never talk about the probability that 𝜇 lies in the interval.
› Instead talk about your __________ that the interval covers the true mean.
confidence

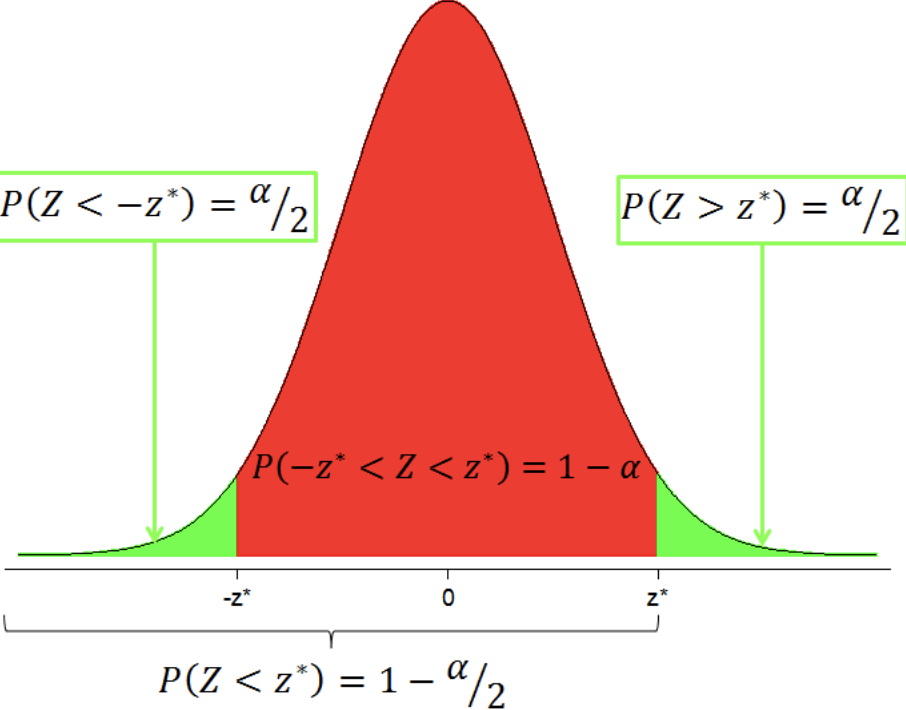
To find a level (1 − 𝛼) 100% confidence interval, we need to find the ________ ____ (1 − 𝛼) under the Normal sampling distribution.
central area


The central area _______ lies between two points 𝑧* and −𝑧* .
1 - 𝛼
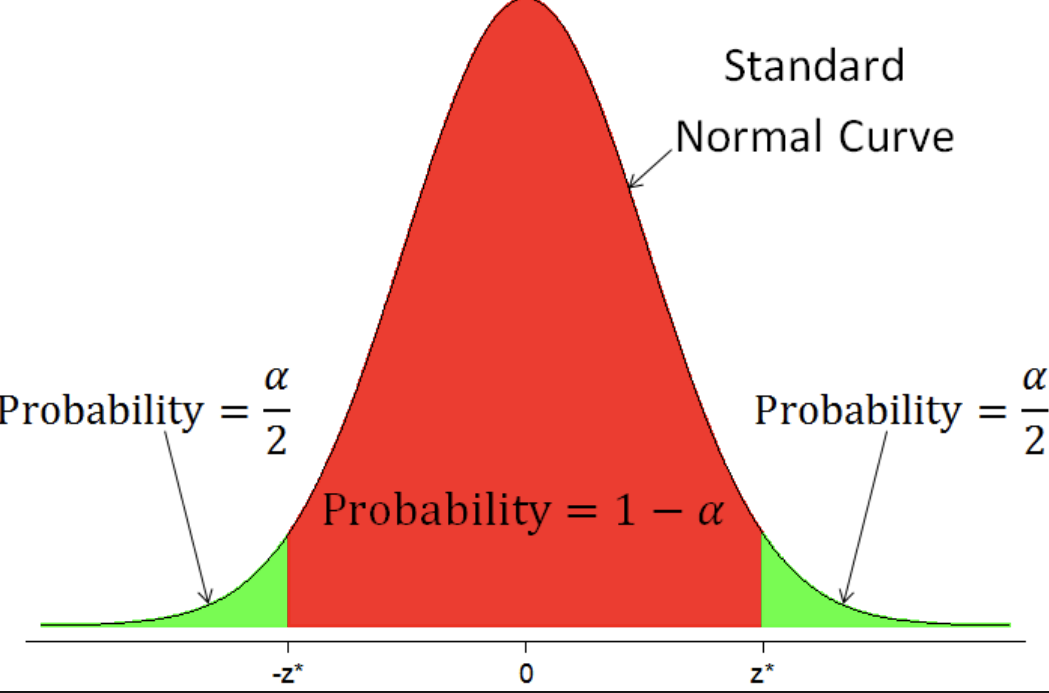
Values of distributions (like 𝑧* ) that mark off specified areas are called _______ ______ of the distribution
critical values
The _________ ______ tells you how many standard deviations above and below a sample mean you must go to make an interval that contains the population mean in a proportion 𝟏 − 𝜶 of all samples.
critical value


To determine the ______ ____, find the value of the known distribution of the test statistic such that the probability of making a Type I error — which is denoted α (greek letter "α") and is called the "significance level of the test" — is small (typically 0.01, 0.05, or 0.10).
critical value

Steps to make a 𝑍 interval:
1. Verify that the requirements are satisfied:
We have a simple random sample
The population standard deviation 𝜎 is known
The variable appears to be normally distributed in the population.
2. Refer to the standard normal table to find the critical value 𝑍1-a/2 that corresponds to the desired confidence level.
3. Evaluate the margin of error: z* 𝜎/sqroot(n)
4. Using the calculated margin of error and the value of the sample mean x̄, find the limits of the confidence interval: x̄ − margin of error and x̄ + margin of error.