AP Psychology Unit
1/84
There's no tags or description
Looks like no tags are added yet.
Name | Mastery | Learn | Test | Matching | Spaced | Call with Kai |
|---|
No analytics yet
Send a link to your students to track their progress
85 Terms
Hindsight bias
The feeling that you "knew it all along" after something happens. It’s when, looking back, you believe the outcome was predictable, even though you couldn’t have known beforehand.
For example, after a sports game, you might think, "I knew they were going to win," even if you weren’t sure before the game
Confirmation bias
When people focus on information that supports what they already believe and ignore information that contradicts it.
For example, if you believe a particular diet works, you’ll notice stories of people who succeeded on it but overlook cases where it didn’t work. This bias keeps people from seeing the full picture and can strengthen existing beliefs, even if they’re inaccurate.
Overconfidence
When someone has more confidence in their knowledge, abilities, or predictions than is justified.
For example, a student might believe they're certain to ace a test without studying, only to find they didn’t know the material as well as they thought. Overconfidence can lead to mistakes or overlooking important details.
Peer Reviewer
An expert who evaluates someone else's work for accuracy, quality, and relevance before it’s published, ensuring it meets high standards.
Theory
A well-developed idea or set of ideas that explain something, based on evidence and observations. It helps us understand and predict events or behaviors.
Example: You are who you surround yourself with
Hypothesis
A testable prediction about the relationship between variables.
For example, "Students who study for more than two hours will score higher on a test than those who study for less than two hours." It serves as a starting point for further investigation.
theory: increased study time leads to improved academic performance
Falsifiable
Means that a statement or theory can be proven wrong through testing or evidence. In science, a claim is considered useful if we can test it to see if it might be false. If we can’t prove it wrong, it’s not really helpful for scientific study.
Example:
_______ Claim: "All swans are white."
This is _____ because you can look for swans of other colors. If you find even one black swan, the statement is proven wrong.
Not ____ Claim: "Invisible fairies exist in my garden."
This is not ____ because there’s no way to test or find evidence to prove this claim false.
Operational definition
A clear, specific way to measure or define something in an experiment or study. It turns a concept into something that can be observed or measured, making it easier for others to understand and replicate.
Example: If you're studying happiness, an operational definition might be “the number of times a person smiles in an hour" or "a score on a happiness survey."
replication
the process of repeating a study or experiment to see if the same results can be achieved. It is important in scientific research because it helps confirm the reliability and validity of findings.
For example, if a study claims that a new drug is effective in reducing symptoms of a disease, other researchers would replicate the study to check if they get the same positive results. Successful replication strengthens the credibility of the original finding.
case study
an in-depth analysis of a specific individual, group, event, or situation over a period of time. It is used in various fields, including psychology, medicine, and social sciences, to explore complex issues in real-life contexts.
ex: Investigating a specific classroom's teaching methods and their effects on student learning.
Meta Analysis
a method that combines results from multiple studies on the same topic to find overall trends. It helps researchers see the bigger picture and get a clearer understanding of an effect or relationship.
For example, if several studies test a new drug, a meta-analysis can show whether the drug is effective by looking at all the data together.
Naturalistic Observations
a research method where scientists observe subjects in their natural environment without interfering or manipulating the situation. This approach allows researchers to see how people or animals behave in real-life settings.
For example, a psychologist might observe how children interact on a playground to understand their social behavior. Naturalistic observation helps gather data on behaviors as they occur naturally, providing insights that controlled experiments might miss.
Survey
A research method used to collect data from a group of people, typically by asking them questions. _____ can be conducted through questionnaires, interviews, or online forms.
For example, a researcher might use a ____ to ask students about their study habits to understand trends in education.
Social desirability bias
A tendency for people to respond to questions in a way that they think will be viewed favorably by others.
For example, if a survey asks about alcohol consumption, respondents might say they drink less than they actually do because they believe that drinking less is more socially acceptable.
This can distort research findings and make it difficult to obtain accurate data.
Self Report Bias
occurs when individuals provide inaccurate or misleading information about themselves, often due to their own perceptions or motivations. This bias can happen because people may overestimate or underestimate their behaviors, attitudes, or experiences.
For example, someone might claim to exercise more frequently than they actually do because they want to present themselves in a positive light.
Experimenter Bias
a type of bias that occurs when a researcher's expectations or beliefs about the outcome of an experiment influence the results.
For example, if a researcher expects a particular treatment to work, they might unintentionally give more encouragement to participants in that group, affecting their performance.
Population
refers to the entire group of individuals or instances that a study aims to understand or make conclusions about
For example, if a researcher wants to study the eating habits of teenagers in a city, the _____ would be all teenagers in that city.
sampling bias
occurs when the sample is not representative of the population.
Example: Surveying only honor students about study habits.
random sample
ensures every member of the population has an equal chance of being selected.
Example: Using a random number generator to select participants from a list or drawing names from a hat.
Convenience sampling
involves selecting participants who are readily available.
Example: Surveying classmates because they are easy to reach.
representative sample
accurately reflects the demographics and characteristics of the population.
Example: Ensuring the sample includes a mix of genders, ages, and socioeconomic statuses.
Experimental methodology
a structured approach used in experiments to test how one variable affects another.
Non experimental methodology
refers to research methods that don’t involve changing or controlling variables. Instead, these methods observe and analyze things as they happen naturally.
Correlation
a statistical measure that describes the relationship between two variables. It shows how one variable changes in relation to another
Positive Correlation
When two variables change in the same direction (Increase or decrease together)
For example, as study time goes up, test scores tend to go up.
Negative Correlation
Two variables change in the opposite directions (One increases and the other decreases)
Example: As the number of hours of sleep increases, feelings of tiredness generally decrease
No Correlation
Two variables that don’t relate at all
Example: A person’s shoe size and their intelligence likely have no correlation.
Correlation coefficient
a numerical value that measures the strength and direction of the relationship between two variables. It ranges from -1 to +1:
The closer to -1.00 or +1.00, the stronger the relationship.
Scatterplot
A type of graph that displays individual data points for two variables, helping to visualize the relationship between them
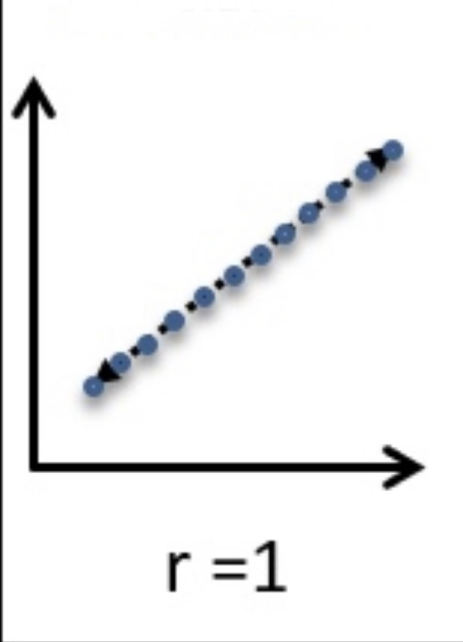
What kind of correlation is this?
Perfect Positive Correlation
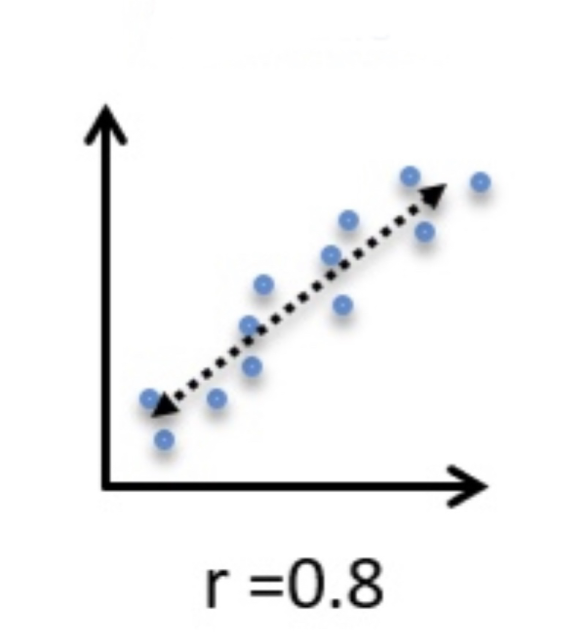
What kind of correlation is this?
Highly Positive Correlation
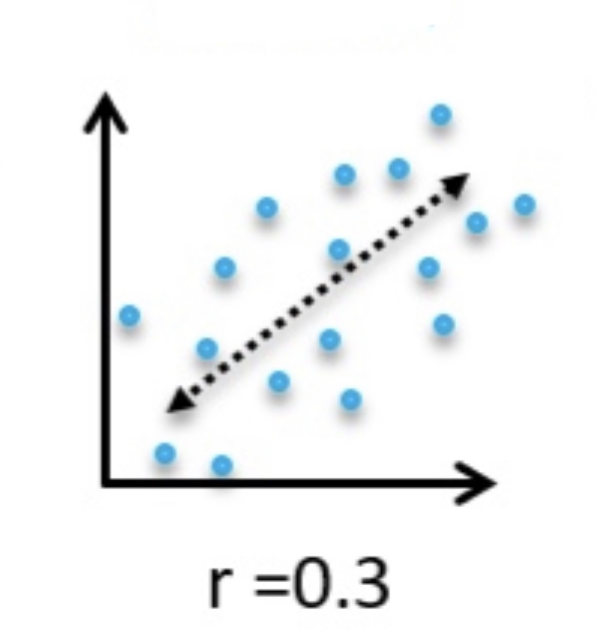
What kind of correlation is this?
Low Positive Correlation
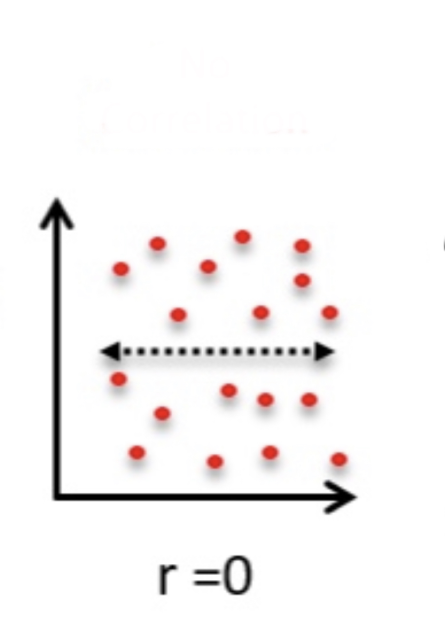
What kind of correlation is this?
No Correlation
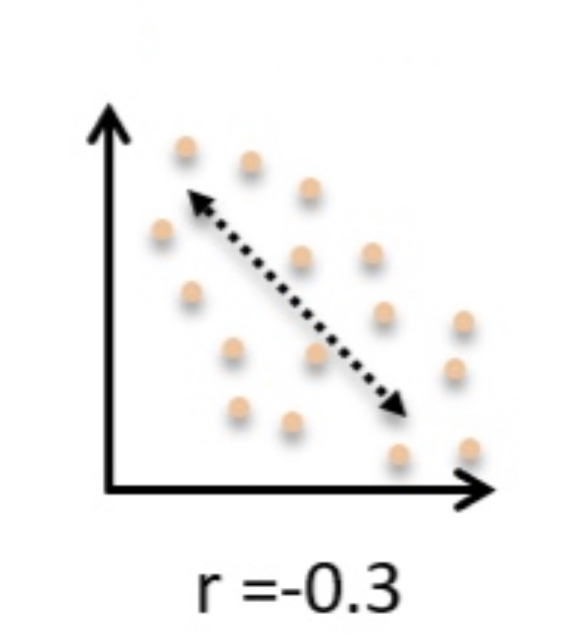
What kind of correlation is this?
Low Negative Correlation
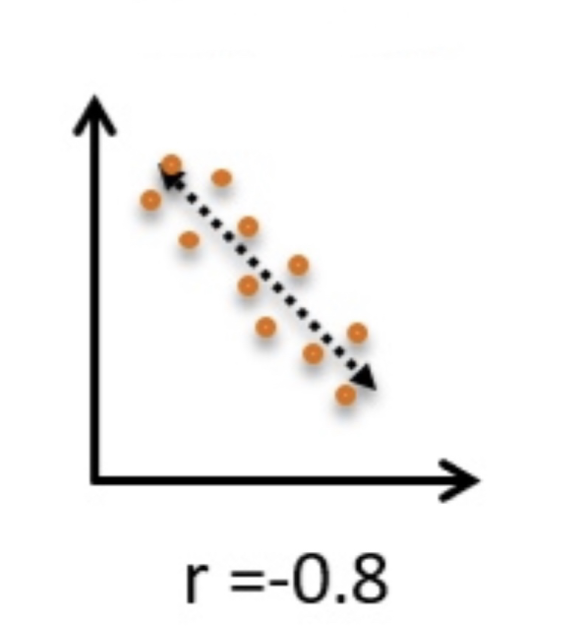
What kind of correlation is this?
Highly Negative Correlation
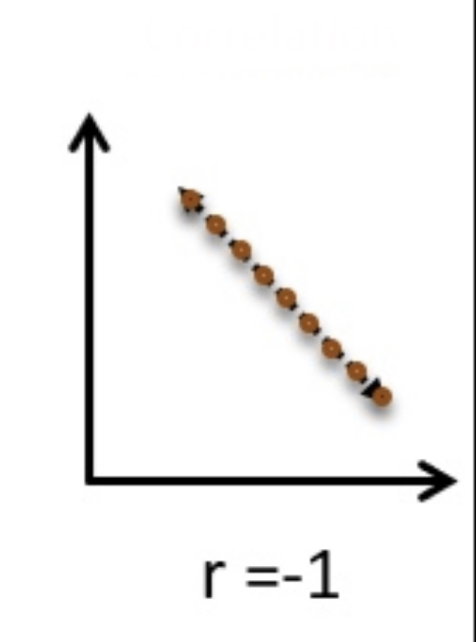
What kind of correlation is this?
Perfect Negative Correlation
Which relationship is stronger?
(-1.00 or +1.00, the stronger the relationship)
0.05 or 0.25
0.05 or 0.25
-0.5 or 0.25
-.05 or 1.25
0.25
0.5
-0.5
-0.5
Directionality Problem
happens when two things are related, but it's hard to tell which one causes the other. This is common in studies that only look at correlations. (unsure of what causes what)
For example:
If students who study more tend to get better grades, we can't tell if studying more causes better grades or if getting better grades makes students want to study more.
There might also be a third factor affecting both, like stress, which could lead to lower grades and less studying.
Third Variable Problem
occurs when a correlation between two variables is actually influenced by a third variable that affects both. This can make it seem like there’s a direct relationship between the first two variables when, in reality, the ______ is responsible for the correlation.
example: Students who get more sleep often have better grades. However, a third variable like overall health or stress levels might influence both sleep quality and academic performance.
Illusory Correlation
The perception of a relationship between two events where none exists. It often occurs when people remember or notice instances that confirm their beliefs while ignoring instances that do not.
Example: Eating the same meal before every game because it’s what you ate when you played your best
Regression towards the mean
The tendency for extreme scores (outliers) to move closer to the mean (average) over time.
Ex: A student who typically averages 82% on exams, may get a 50%, but over time they will have higher scores that bring them closer to their average.
Regression towards the mean example:
A basketball player scores way more points than normal in a game, hitting every shot. In the next game…
What will happen next?
they’re likely to score closer to their usual performance because the first game was unusually good. This doesn't mean they’re playing worse, just that the amazing performance was unlikely to repeat.
Experiment
a way to test an idea or hypothesis by changing one thing (the variable) to see how it affects another thing
Experimental Group
a group of participants in an experiment that receives the treatment or intervention being tested
ex:
Hypothesis: the new teaching method will improve students test scores
Experimental Group:
Students in this group will be taught using the new teaching method, which may include interactive lessons, group work, and technology integration.
Control Group
a group of participants in an experiment that does not receive the treatment or intervention being tested. typically to show the compare the effects of both groups.
ex:
Hypothesis: the new teaching method will improve students test scores
Control: Students in this group will continue with the traditional teaching method, which relies on lectures and textbooks.
Independent Variable
the factor that you change or control in an experiment to see how it affects something else. It is what you think will cause an effect
ex: Studying the impact of caffeine consumption on anxiety
Dependent Variable
the factor in an experiment that is measured or observed to see how it is affected by changes in the independent variable. It represents the outcome or effect that results from manipulating the independent variable
ex: Studying the impact of caffeine consumption on anxiety (levels)
Random Assignment
a method used in experiments to place participants into different groups in a way that each person has an equal chance of being assigned to any group. This helps ensure that the groups are similar and that the results of the experiment are valid.
Study Example: Testing a New Exercise Program
Participants: 100 individuals interested in fitness.
Groups: One group will follow the new exercise program (experimental group), and the other group will not (control group).
Random Assignment: Participants are randomly assigned to either the experimental group or the control group.
Single Blind Procedure
where the participants do not know whether they are receiving the treatment or placebo
ex: participants don’t know what kind of pill they’re taking, but researcher does
Double Blind Procedure
where both participants and researchers don’t know who is receiving treatment or placebo
Placebo
a fake treatment or pill that has no active ingredients. It is often used in experiments to compare with real treatments
Example: A sugar pill given to some patients instead of actual medicine.
Placebo Effect
when people feel better after taking a placebo because they believe it will work.
Example: Someone takes a sugar pill for a headache and feels less pain just because they think it will help, even though the pill does nothing.
Confounding Variables
outside factors that can affect the results of an experiment, making it hard to determine if the changes in the dependent variable are truly due to the independent variable. They can lead to inaccurate conclusions.
Experiment: You want to see if drinking caffeine improves test scores. Group A drinks coffee before the test, and Group B does not.
______ : The amount of sleep the students got the night before. If students in Group A slept more than those in Group B, it could explain better test scores, not the caffeine.
Quantitative Data
Definition: A research approach that involves collecting and analyzing numerical data to find patterns, make predictions, or establish relationships between variables.
Examples: Surveys, experiments, statistical analysis.
Qualitative Data
Definition: A research approach focused on understanding people's experiences, emotions, and perspectives through non-numerical data.
Examples: Interviews, focus groups, observations.
Likert Scales
Definition: A commonly used scale in surveys that measures respondents' attitudes or opinions by having them rate their agreement on a scale (e.g., 1-5 or 1-7).
Example: "On a scale of 1 (strongly disagree) to 5 (strongly agree), rate how much you agree with the statement."
Institutional Review (Board / IRB)
Definition: The process by which research proposals are evaluated by an Institutional Review Board (IRB) to ensure ethical standards and participant safety.
Goal: To protect the rights and welfare of participants by assessing potential risks and benefits.
Informed Consent
Definition: The process of informing research participants about the purpose, procedures, risks, and benefits of a study, allowing them to decide whether to participate.
Importance: Ensures that participation is voluntary and that participants understand their rights
Informed Assent
Definition: Similar to informed consent but specifically for minors or those unable to legally consent; it includes their understanding and agreement to participate, along with permission from a guardian.
Importance: Provides ethical protection for vulnerable participants like children.
Protect from Harm
Definition: A key ethical principle requiring researchers to minimize any physical, psychological, or emotional risks to participants.
Application: Researchers must ensure that participants are safe and that any discomfort is justified and minimized.
Confidentiality
Definition: The practice of keeping participants’ personal information private and not disclosing identifiable data without permission.
Importance: Protects participants’ privacy and encourages honest responses
Research Confederates
Definition: Individuals who work with researchers to secretly participate in the study to influence the behavior of actual participants.
Usage: Common in social psychology to simulate certain social conditions without participants knowing the full context.
Debriefing
Definition: A process that occurs after a study, where participants are informed about the study’s purpose, procedures, and any deception used.
Importance: Helps to clarify any misunderstandings and ensure that participants leave without distress or confusion.
Measures of Central Tendency
Definition: A statistical measure that identifies a single value as representative of an entire distribution of data.
Types: Mode, mean, and median.
Mode
Definition: The most frequently occurring value in a dataset.
Example: In the data set {2, 3, 3, 5}, the mode is 3.
Mean
Definition: The average value, calculated by adding all numbers and dividing by the count of values.
Example: For {2, 3, 4}, the mean is (2 + 3 + 4) / 3 = 3.
Median
Definition: The middle value of an ordered dataset, dividing it into two equal halves.
Example: In {1, 3, 5}, the median is 3.
(if there’s two of them due to it being odd — then add and divide by 2)
Percentile Rank
Definition: The percentage of scores in a dataset that are equal to or below a given score.
Example: A score in the 90th percentile rank is higher than 90% of the other scores.
Skewed Distribution
Definition: A distribution where scores are not symmetrically distributed, leading to a “tail” on one side.
Types: Positively skewed (tail on right) and negatively skewed (tail on left).
Bimodal Distribution
Definition: A distribution with two distinct peaks or modes.
Example: A dataset with scores clustering around two different values, like test scores from two groups.
Measures of Variation
Definition: Statistics that describe the spread or dispersion within a dataset.
Types: Include range, variance, and standard deviation.
Range
Definition: The difference between the highest and lowest values in a dataset.
Example: In {2, 5, 10}, the range is 10 - 2 = 8.
Standard Deviation
Definition: A measure of how much individual scores vary from the mean of the dataset.
Importance: Higher standard deviation indicates more spread out data.
Normal Curve (Normal Distribution)
Definition: A bell-shaped curve representing a symmetrical distribution where most scores cluster around the mean.
Characteristics: Mean, median, and mode are all the same; roughly 68% of data lies within one standard deviation of the mean.
Meta Analysis
Definition: A statistical technique that combines the results of multiple studies on a similar topic to identify overall trends.
Goal: To draw stronger conclusions by pooling data from various sources.
Statistical Significance
Definition: Indicates that an observed result is unlikely to have occurred by chance alone.
Importance: Helps to confirm the reliability of research findings.
Effect Size
Definition: A measure of the strength or magnitude of a relationship or difference in a study, indicating practical significance.
Usage: Larger effect sizes suggest a stronger impact of an independent variable on a dependent variable.
Case Study (Research Method)
An in depth investigation of a single person or group
ex) Studying the behavior of a person with a rare disorder
Experimental (research method)
Where one variable will be changed to see if it changes another variable
ex) Testing to see if a new pill reduces cramps compared to no treatment
Correlation (Research method)
examining the relationship between two variables to see if they’re related
ex) studying the relationship time spent on social media and feelings of loneliness
Survey
Asking people questions through questionnaires or interviews
ex) Surveying students about their study habits
Naturalistic Observations
Observing people in their natural environment without interfering
ex) Watching how children interact on a playground with one another
Longitudinal (research method)
Following the same group over a long period of time, observing the changes over time
Cross Sectional (Research method)
Comparing different groups of people at a single point in time