APES Unit 3
1/31
There's no tags or description
Looks like no tags are added yet.
Name | Mastery | Learn | Test | Matching | Spaced |
|---|
No study sessions yet.
32 Terms
Generalists
Thrive in diverse environments with broad ecological tolerance. Resilient to environmental changes.
Examples: gray kangaroos and stickleback fish.
Specialists
Require specific habitats and diets. Thrive in stable conditions but are vulnerable to changes.
Examples: koalas or leaf beetles
K-selected
Slow growth, large size, delayed reproduction, few offspring, high parental care. Populations are stable but vulnerable to extinction.
Examples: elephants and humans.
r-selected
Rapid growth, small size, early reproduction, many offspring, little/no parental care. Populations fluctuate and adapt quickly.
Examples: mice and cockroaches
Type I
A Type
High survival early/midlife, decline with age
Example: K-selected species like humans and elephants.
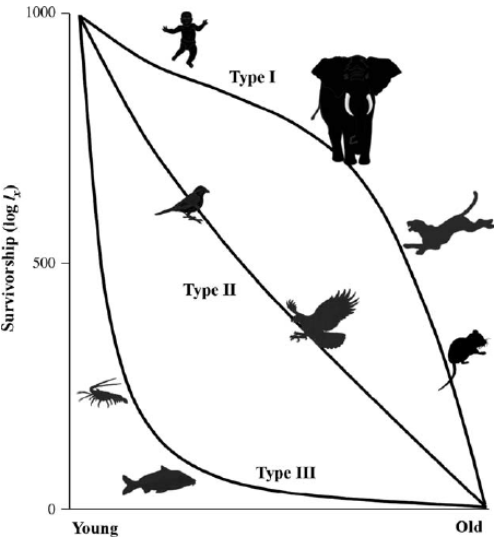
Type II
Constant mortality rate
Example: Chipmunks, birds
Type III
High mortality early, survivors live longer
Example: r-selected like Frogs, birds, and spiders.
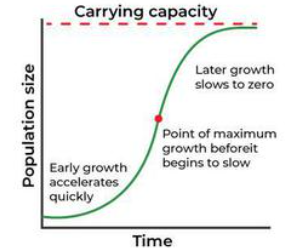
Carrying Capacity
Maximum population size an environment can sustain with available resources.
- Population Impact: Exceeding capacity leads to “dieback” and eventual stabilization around the limit.
- Examples: Reindeer on St. Paul Island grew rapidly, crashed due to resource exhaustion, and stabilized under management.
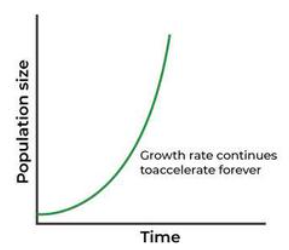
Exponential Growth Model
“J-shaped” curve of rapid growth under ideal conditions, rarely sustained.Characterized by unlimited resources and no environmental resistance.
Logistic Growth Model
“S-shaped” curve; growth slows as resources limit population near carrying capacity.It describes how populations grow more slowly as they approach the environment's carrying capacity, reflecting the influence of resource availability and competition.
Density-Dependent Factors
Size- dependant factors that impact population growth
Examples: Competition, predation, and disease
Density-Independent Factors
Affect all equally
Examples: Natural disasters and climate.
Limiting Resources
Essential resources cap population size; depletion reduces carrying capacity. Examples: food, water, shelter, and space.
Impact: Overpopulation, depletes resources, altering ecosystems temporarily (e.g., regrowth) or permanently (e.g., soil erosion).
Examples: Overgrazing in China degraded land; sub-Saharan Africa faces resource scarcity due to population growth
Reindeer case study
Rapid growth and crash due to resource exhaustion.
Lynx & Hares
Predator-prey cycles regulate populations.
Moose and Wolves
Wolf reintroduction stabilized both populations.
Goldeneye Ducks
Habitat loss limits growth despite food availability.
Age Structures
Pyramid (rapid growth, e.g., Nigeria), Column (stable, e.g., U.S.), Inverted Pyramid (decline, e.g., Italy).
Population Momentum
Young populations sustain growth despite policy changes.
Total Fertility Rate
Influenced by education and income (e.g., Ethiopia: 1.5 with education vs. 5.8 without).
Family Planning
Campaigns (e.g., Kenya) lower TFR via contraceptive use (drugs to prevent pregnancy)
Aggregate Demand
Total demand influenced by consumer confidence, interest rates, and exchange rates
Aggregate Supply
Represents the total quantity of goods and services that producers in an economy are willing and able to supply at various price levels
Fiscal and Monetary Policies
Governments influence economies through spending/taxes (fiscal) and money supply/interest rates (monetary)
Fiscal → Government
Monetary → Central banks, etc
CBR, CDR, IMR, TFR
influence growth, decline, and distribution
Demographic Transition Model
outlines population changes during economic development
Causes for Growth
High CBR/TFR, low IMR, early marriage, limited family planning (e.g., developing nations).
Causes for Decline
Low CBR/TFR, delayed marriage, access to family planning (e.g., developed nations) all are…
Case Study: China
TFR dropped from 6.3 (1970) to 1.5 due to One Child policy.
Stages of Demographic Transition
Pre-Industrial: High birth/death rates, stable population (e.g., pre-Industrial Revolution).
Industrializing: Death rates fall; rapid growth due to cultural lag (e.g., early 20th-century U.S.).
Industrialized: Birth rates decline, growth slows (e.g., Uruguay).
Post-Industrial: Birth rates drop below death rates; aging population (e.g., Japan).
The IPAT Equation
Impact = Population × Affluence × Technology
Population: More people = greater strain.
Affluence: Wealth drives consumption.
Technology: Can harm (pollution) or aid (efficiency).