biom301 mod 3 - describing & presenting bivariate data
1/17
There's no tags or description
Looks like no tags are added yet.
Name | Mastery | Learn | Test | Matching | Spaced |
|---|
No study sessions yet.
18 Terms
bivariate data
2 variables measured on same EU independently and without bias
2 qualitative
contingency table
side by side bar graphs
side by side circle graphs
2 quantitative
scatter plots
1 qualitative & 1 quantitative
side by side box & whisker plot
side by side stem & leaf
side by side frequency histograms
linear correlation
a linear relationship between 2 quantitative variables
only use correlation if LINEAR
correlation coefficient
( r ) - shows strength of relationship (positive/negative)
“r” measures direction & strength of linear relationship between 2 variables
insignificant if close to zero
miss real relationships if it’s not linear
ALWAYS shown by scatter plot
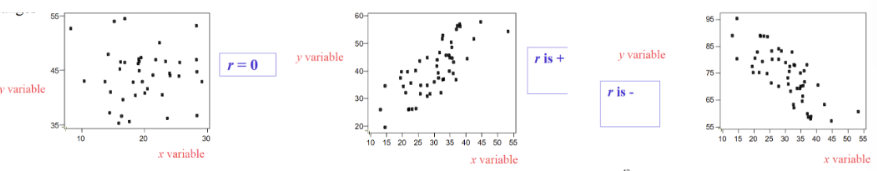
Correlation or not?
no correlation if “y” does NOT change when “x” changes (r = 0)
or when “y” changes but “x” doesn’t
positive correlation if “y” increases when “x” increases (r = +)
r = +1 → perfect positive correlation
negative correlation if “y” decreases when “x” increases (r = - )
r = -1 → perfect negative correlation
-1 < r > +1 → intermediate relationship
correlation concerns
check for nonlinear relationships
transform data to fit linear model by using a nonconstant
check for outliers
less ‘tight’ r value (bigger)
need justification to remove valid data from dataset
correlation is NOT causation
most correlations are done on survey data
surveys CANNOT determine cause & effect
third-variable problem
2 variables could have strong correlation, but b/c of a 3rd “lurking” variable
never predict/extrapolate beyond your data set
terms to describe association
associated
tends to
linked → trends
connected
tied to
regression
asks if changes in 1 variable cause or predicts changes in another variable
can be a curve (not restricted to linear relationships)
linear regression
predict a value for y (output/dependent variable) given a value of “x” (input/independent variable)
determines line of best fit
for any value of “x”, you can predict a value of “y” given regression equation
line of best fit
the linear trend that best fits/describes the data set
minimize deviations between line & actual data points vertically
b/c trying to predict “y” value
2 components for best fit line equation
estimate of linear slope ( b1 )
estimate of intercept ( b0 )
regression coefficient
( R2 ) - the amount of variability in the dependent variable (y) explained by the variability in the independent variable (x)
R2 = 0 → no relationships between x & y
R2 = 1 → perfect relationship/straight line
R2 vs r
r → correlation, tightness, direction
–1 < 0 > +1
Can statistically test for relationship between x & y
Looks for trends in 2 quant variables, linear relationship, usually survey data
R2 → regression, tightness ONLY
0 < R2 > 1
Not tested statistically
Asking if y variables is a function of the x variable
Can deal w/ 2+ variables, curvilinear data, both survey & experiment
Causation requires controlled experiment
Tells how much of the variability in y is explained by the x variable
regression test
test for significant slope
if slope of line ( b1 ) is statistically significant different from zero
if intercept ( b0 ) is significantly different from zero
slope question
Slope is NOT significant diff from zero → y does not change as a function of x
Slope IS significant diff from zero → y decreases as a function of x
components of regression graphs
title
labeled axes
line ONLY in the range of data
equation of line
R2 value
regression concerns
Outliers can have big impact
Never extrapolate beyond range of data
Relationship may be nonlinear (graph first to be sure)
Lurking variables if survey data
Interpretation