STATS CH1 Data collection
1/53
There's no tags or description
Looks like no tags are added yet.
Name | Mastery | Learn | Test | Matching | Spaced | Call with Kai |
|---|
No analytics yet
Send a link to your students to track their progress
54 Terms
Statistics
the science of collecting/organizing/summarizing/analyzing information to draw conclusions/answer questions
Data
a fact used to draw a conclusion/make a decision; words that describe the “stuff”
A statistic
numerical summary based on a sample
A parameter
numerical summary of a population
Descriptive statistics
consist of organizing/summarizing data; describe data through numerical summaries, tables, and graphs.
Inferential statistics
uses methods that take results from a sample, extends them to the population, and measures the reliability of the result
Variable
are the characteristics of the individuals within the population
Qualitative variable
allow for classification of individuals based on some attribute or characteristic.
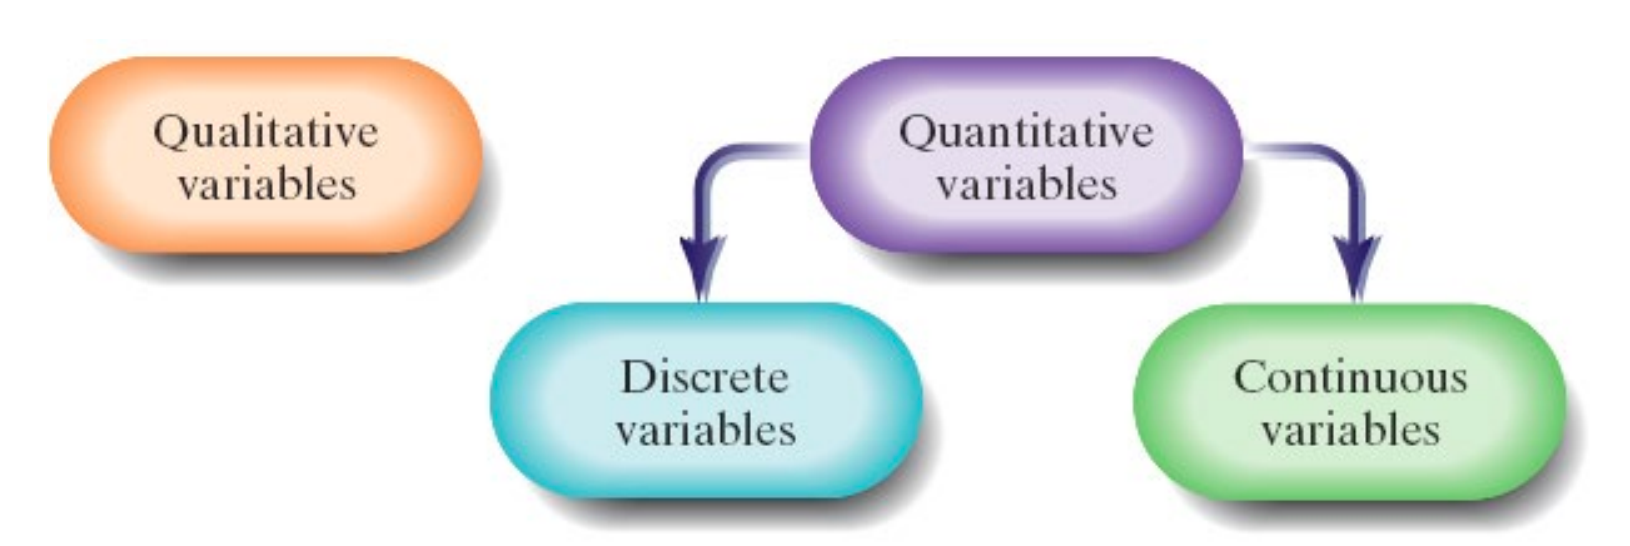
Quantitative variable
provide numerical measures of individuals; the values of a quantitative variable can be added or subtracted and provide meaningful results.
Two types: discrete & continuous
Discrete variable
is a quantitative variable that has either a finite number of possible values or a countable number of possible values
Continuous variable
is a quantitative variable that has an infinite number of possible values that are not countable; may take on every possible value between 2 values.
Qualitative data
are observations corresponding to a qualitative variable
Quantitative data
are observations corresponding to a quantitative variable
Discrete data
are observations corresponding to a discrete variable
Continuous data
are observations corresponding to a continuous variable
4 levels of measurement for variables
norminal lvl of measurement
ordinal lvl of measurement
interval lvl of measurement
ratio lvl of measurement
Nominal level of measurement
when the values of the variable name/label/categorize; does not allow the values to be ranked in a specific order
Ordinal level of measurement
values are nominal & can be ranked in a specific order
Interval level of measurement
values are ordinal, value of zero does not mean complete absence, & arithmetic operations (±) can be applied with meaning
Ratio level of measurement
values are interval, zero means complete absence, & arithmetic operations (x/÷) can be performed with meaning
Observational study
measures response variable without influencing the variables; observe the behavior of an individual without influencing the outcome of the study
Three kind of observational study: cross-sectional, case-control, & cohort
Cross-sectional study
observational studies that collect info about individuals at a specific point in time/very short period.
Case-control study
retrospective (looking back in time); requires individuals to look at existing records; individuals with one characteristic are matched together (case) & compared to a control
ex - trying to find if smoking leads to lung cancer; looking back into their past smoking habits to see if they contributed to the development of lung cancer
Ppl who have lung cancer (case) & ppl who don’t (control)
Cohort study
prospective (over a long time) identifies a group of individuals to participate (cohort) & they are observed over a long period of time.
Experiment
researcher assigns the individuals to groups & intentionally manipulates the independent variable, then records the dependent variable.
Explanatory variable
independent variable
Response variable
dependent variable
Confounding
this occurs when the effects of 2 variables are not separated; the relation between the independent & dependent could be caused by something else.
Confounding variable
explanatory variable that was considered in the study, but its effects can not be separated from a different variable.
Lurking variable
explanatory variable that is not considered in the study but could effect the response variable.
Types of random sampling
simple random sampling
systematic sampling
stratified sampling
cluster sampling
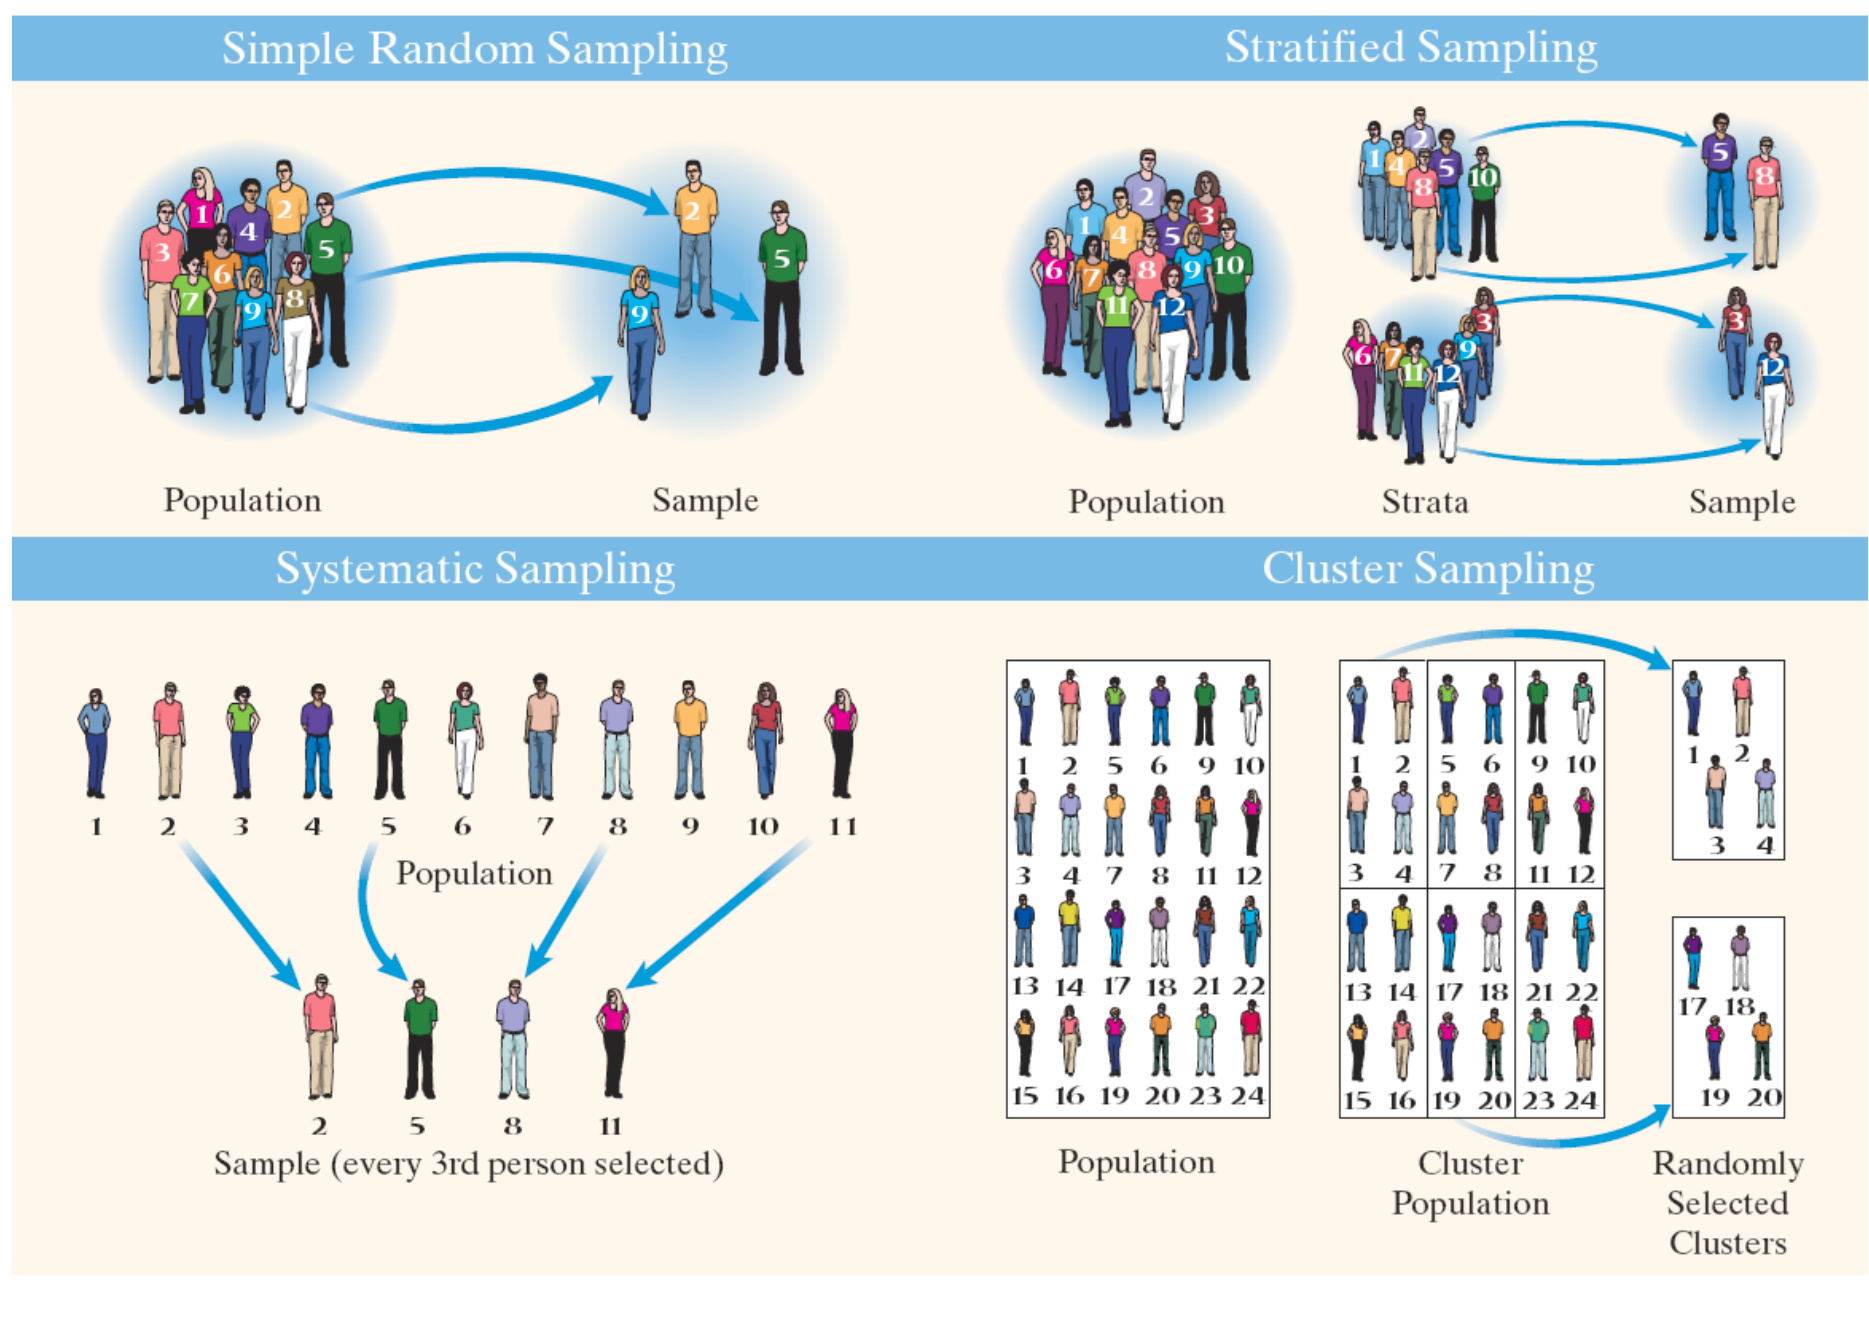
Simple random sampling
every possible sample of size n has an equal chance of occurring; requires a frame
Frame
a list of all the individuals within the population
Sample without replacement
an individual who is selected is removed from the population & CANNOT be chosen again
Sample with replacement
selected individual is placed back into the population & could be chosen again
Systematic sample
obtained by selecting every kth individual from the population
Stratified sample
obtained by separating the population into nonoverlapping groups (strata) & obtaining a simple random sample of each
Cluster sample
obtained by selecting all individuals within a randomly selected collection/group of individuals
Convenience/voluntary response samples
sample where the individuals in the sample are easily obtained (usually self-selected)
Multistage sampling
obtaining samples using multiple sampling techniques
Three sources of bias
Sampling bias
Nonresponse bias
Response bias
Sampling bias
the technique used to obtain individuals in the sample favors one part of the population over another; caused by undercoverage
Nonresponse bias
exists when individuals selected to be in the sample who do not respond to the survey have different opinions from those who do
Response bias
exists when the answers on a survey do not reflect the true feelings of the respondent
6 types of response bias:
Interviewer error
Misrepresented answers
Wording of questions
Ordering of questions or words
Type of question: open or closed question
Data-entry error
Sampling error
nonsampling error
result of undercoverage, nonresponse bias, response bias, or data-entry error (occur during the recording process and could lead to results that may not be representative of the population)