Lecture 19: factorial designs
1/43
There's no tags or description
Looks like no tags are added yet.
Name | Mastery | Learn | Test | Matching | Spaced | Call with Kai |
|---|
No analytics yet
Send a link to your students to track their progress
44 Terms
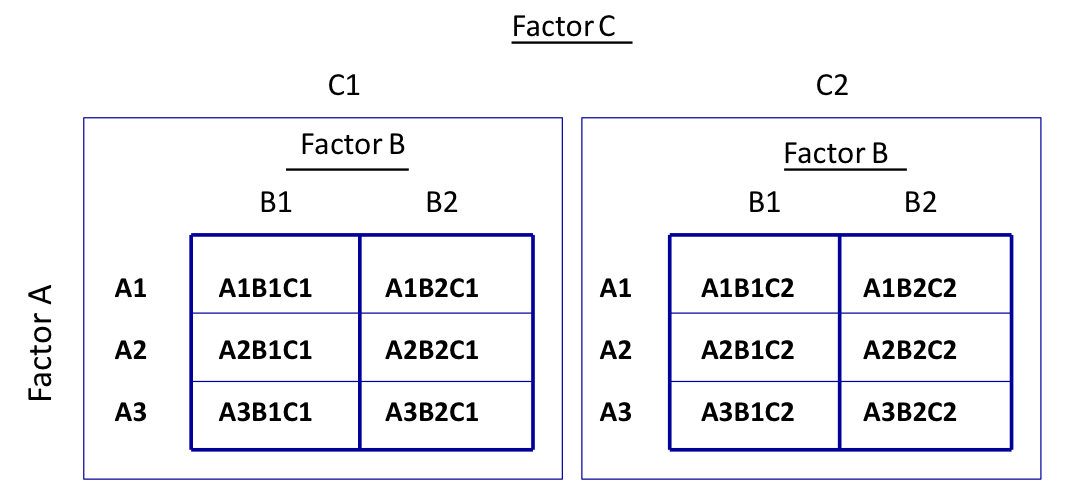
a 2 × 3 × 2 design is a […]-factor design with a total of […] conditions (if all factors are crossed)
three-factor design
12 conditions (see image)
A, B, C; 2 × 3 × 2 = 12 (you multiply)
A = 2 conditions
B = 3 conditions
C = 2 conditions
define “factor”
an independent variable in an experiment (true for within-subjects and between-subjects)
what does a factorial design examine? (2)
effects of more than one IV on a DV (main effects)
interactions between the IVs (combined effects)
why are factorial designs popular in psychology?
because human behaviour and experience can be determined by multiple factors (not one IV only)
define “factorial design”
research design that includes two or more factors
ex: two-factor design = 2 IVs, three-factor design = 3 IVs
true or false: in a factorial design, all factors need to be manipulated
false: not always
what’s the difference between an experimental factorial design and a quasi-experimental factorial design?
experimental: all factors are manipulated (this flashcards set)
quasi: one factor isn’t being manipulated (another set)
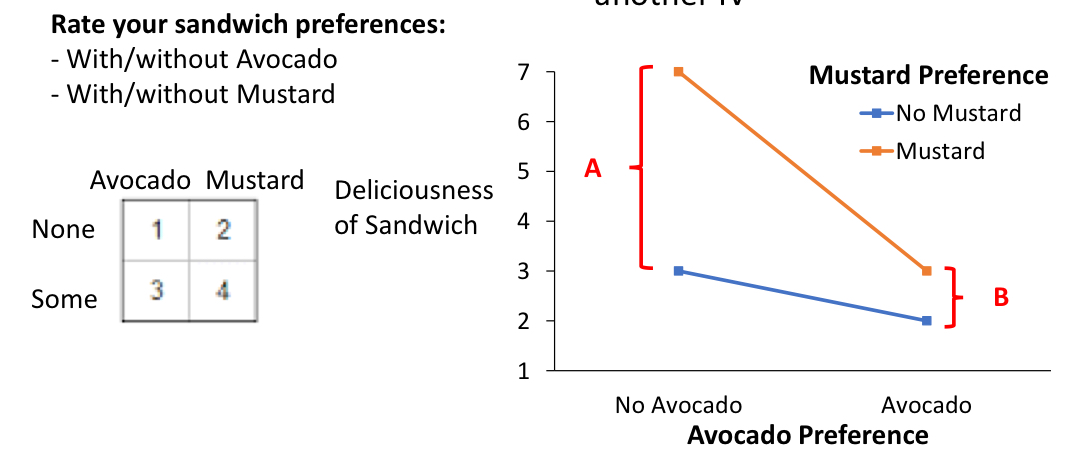
how is the interaction computed?
difference A - difference B: difference for mustard preferences without avocado - difference for mustard preferences with avocado
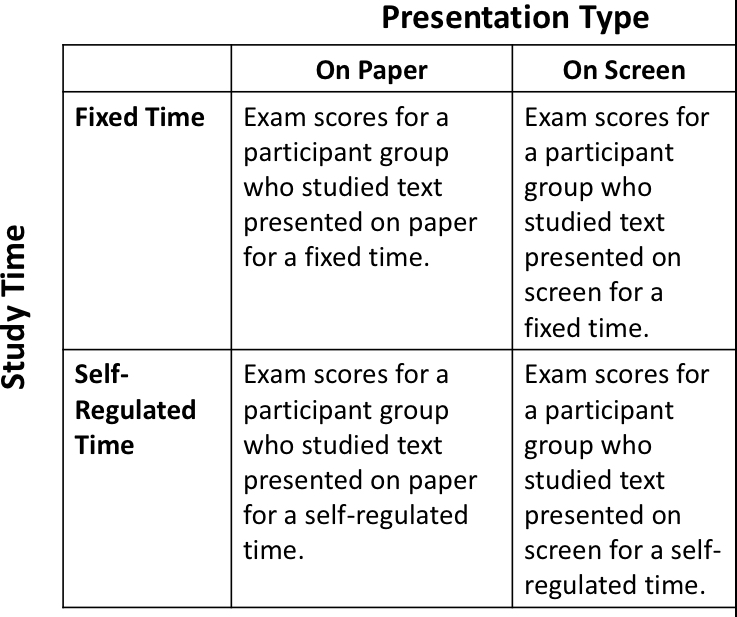
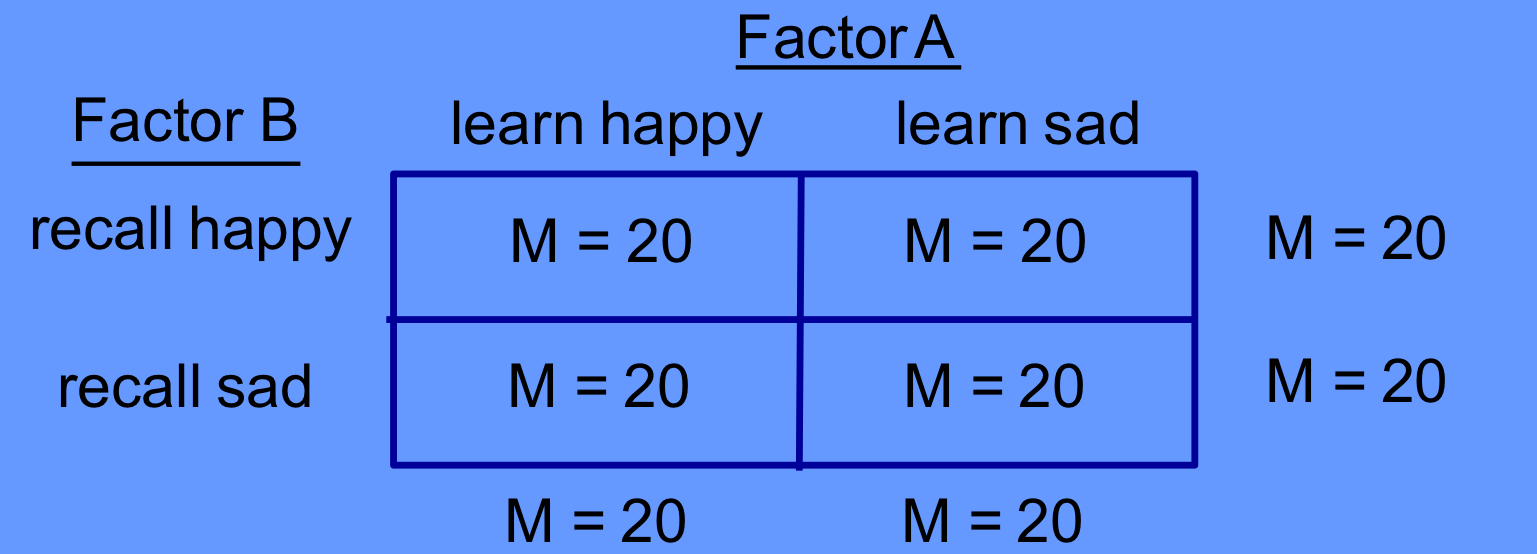
explain how a factor design can be represented by matrix
we have cells and each cell corresponds to a separate treatment condition (a combination of factors)
in a two-factor design, what information does the data provide? (3)
main effect A
main effect B
interaction A x B
what’s the difference between a main effect and an interaction?
main effect: mean differences among the levels of a factor/IV
influence of the factor/IV on the DV
interaction: factors, acting together, produce mean differences that are not explained by the main effects
effects of one factor depend on the level of another factor
combined effect of two or more independent variables
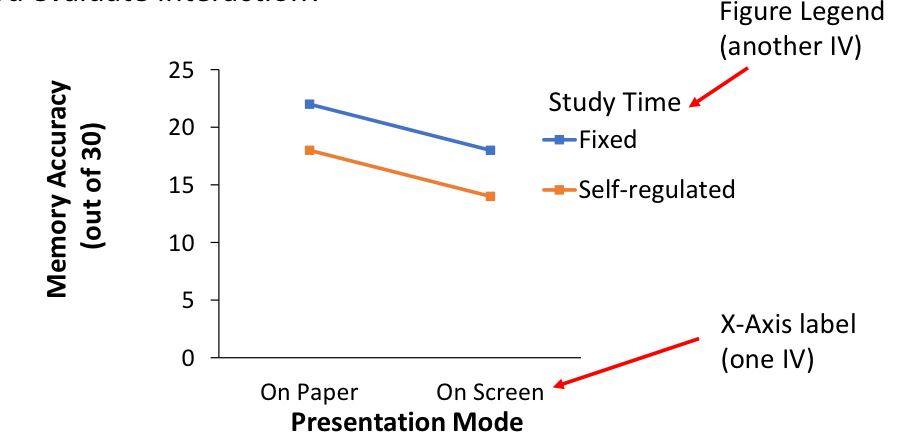
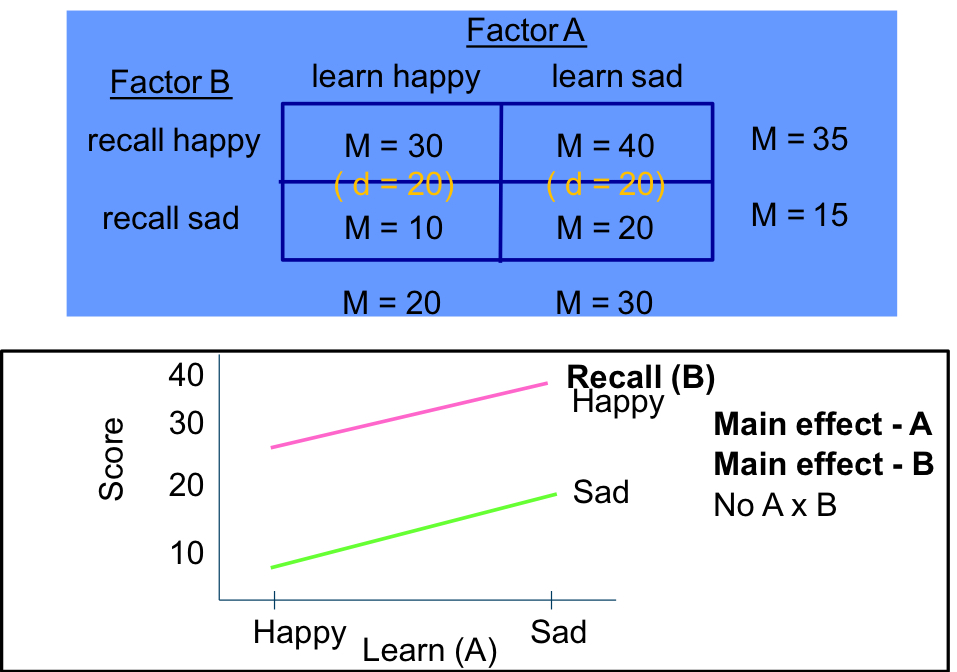
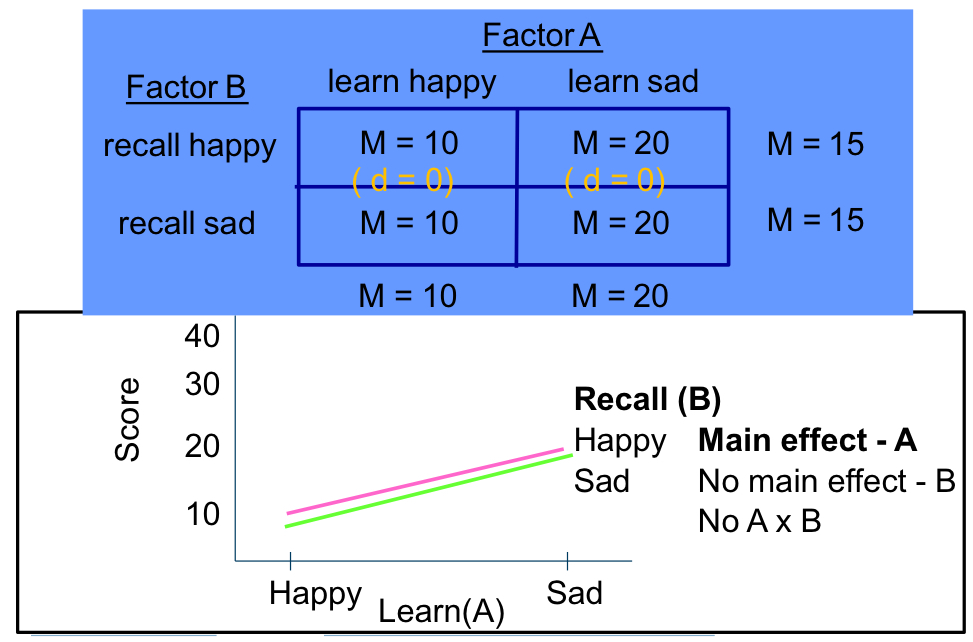
on a line graph, where are the main effects indicated?
on the x-axis and in the legend
*when you interpret a two factor interaction in a three factor design, the two factor interaction is taking the average across the third unmentioned factor
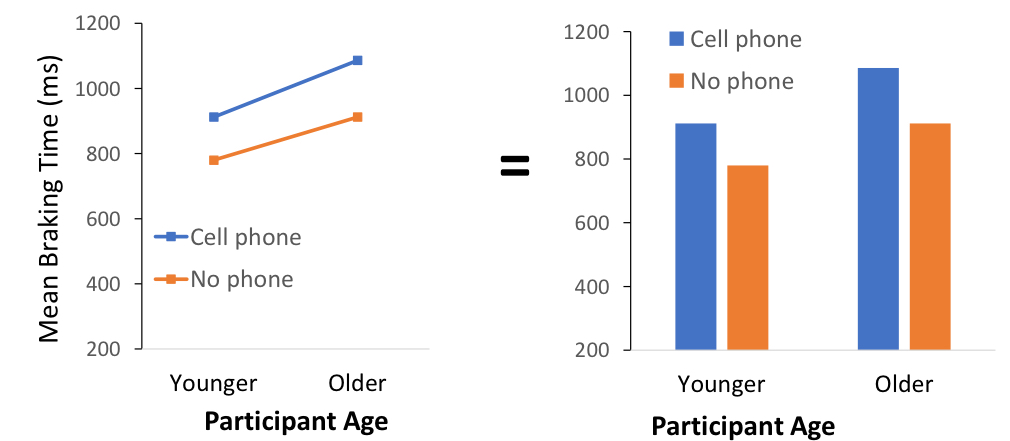
true or false: you should use a bar chart to look at interactions
true (but prof wants use to learn how to read the slopes)
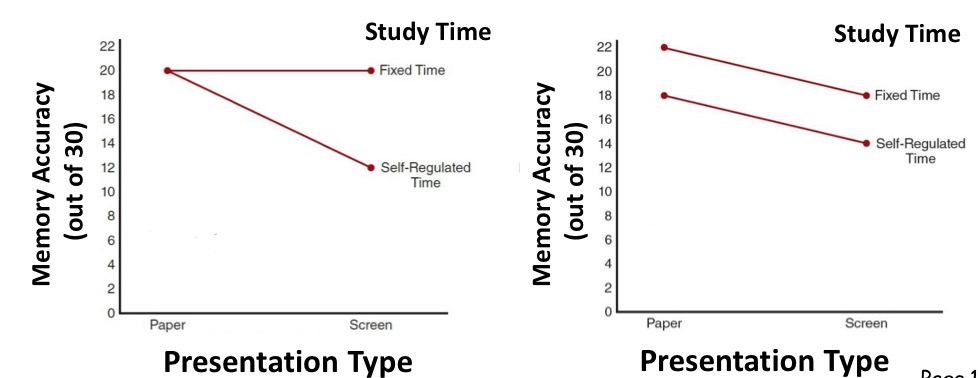
in a 2×2 design, how would you know if there is an interaction when looking at line graphs?
if the lines are parallel, then there is no interaction
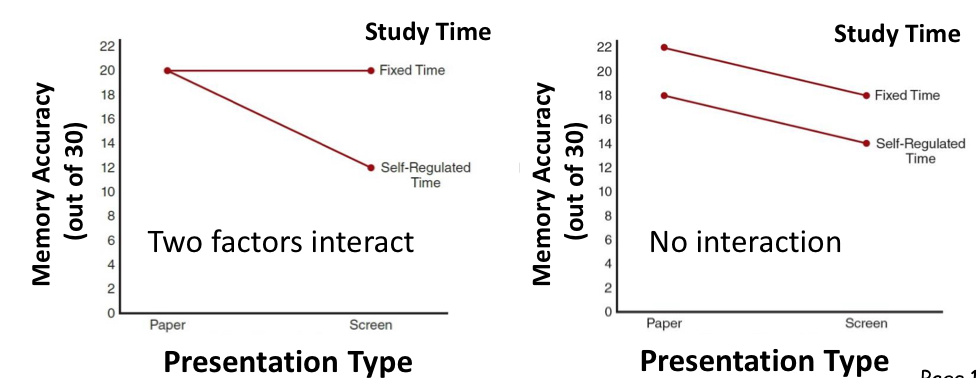
true or false: in a graph, interactions can be shown differently
true
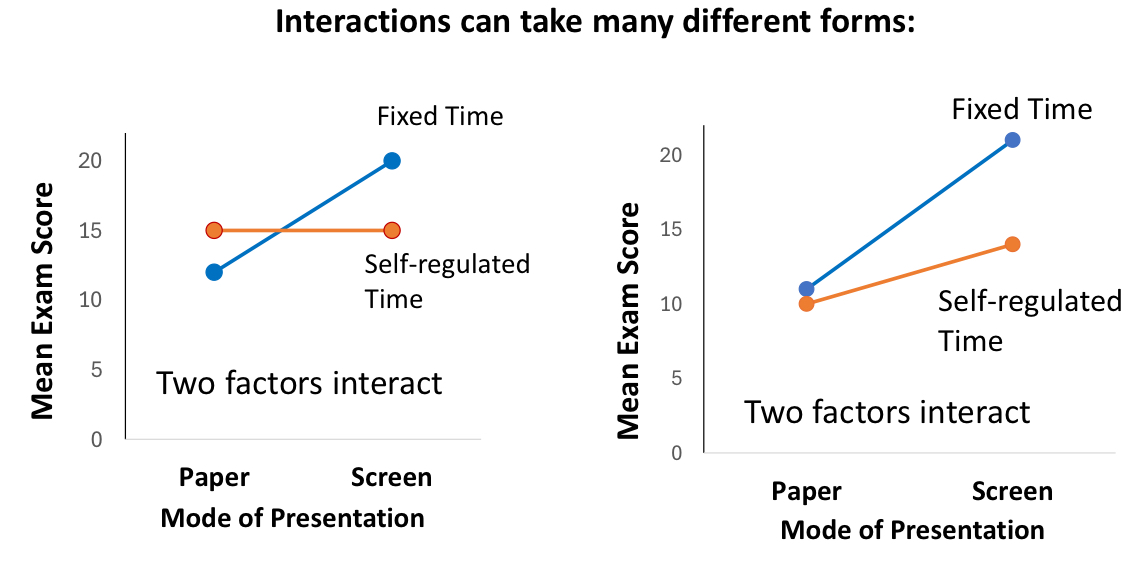
define “interaction”
the effects of one factor depend on the levels of a second factor
true or false: a factorial design is a mixed design (has both between-subjects factor and within-subjects factor)
false: you can have
all between-subjects factors
all within-subjects factors
mixed design: a mix of within-subjects and between-subjects
would this be an interaction or not? why?
no: the lines are close to parallel
what are the set of differences a two-factor study allows us to evaluate? (3)
mean differences from main effect of factor A
mean differences from main effect of factor B
mean differences from interaction of factors A and B
why do we use factorial designs instead of one-way designs?
because they have more ecological validity
how can you know the total number of conditions?
by multiplying the number of IVs and the number of each levels for each IV
ex: 2 × 3 = 6 conditions; 2 × 3 × 2 = 12 conditions
*conditions are the amount of cells in a table
true or false: the tests of main effects and interactions are dependant
false: they are independent, which allows you to use multiple strategies (answer questions that couldn’t be answered with one strategy)
true or false: the order of the factors matter (2 × 3 × 4 ≠ 4 × 2 × 3)
false: as long as the factors are labeled, the order doesn’t matter
true or false: the number of main effects is the same as the number of factors
true: 3 main effects = A, B, C
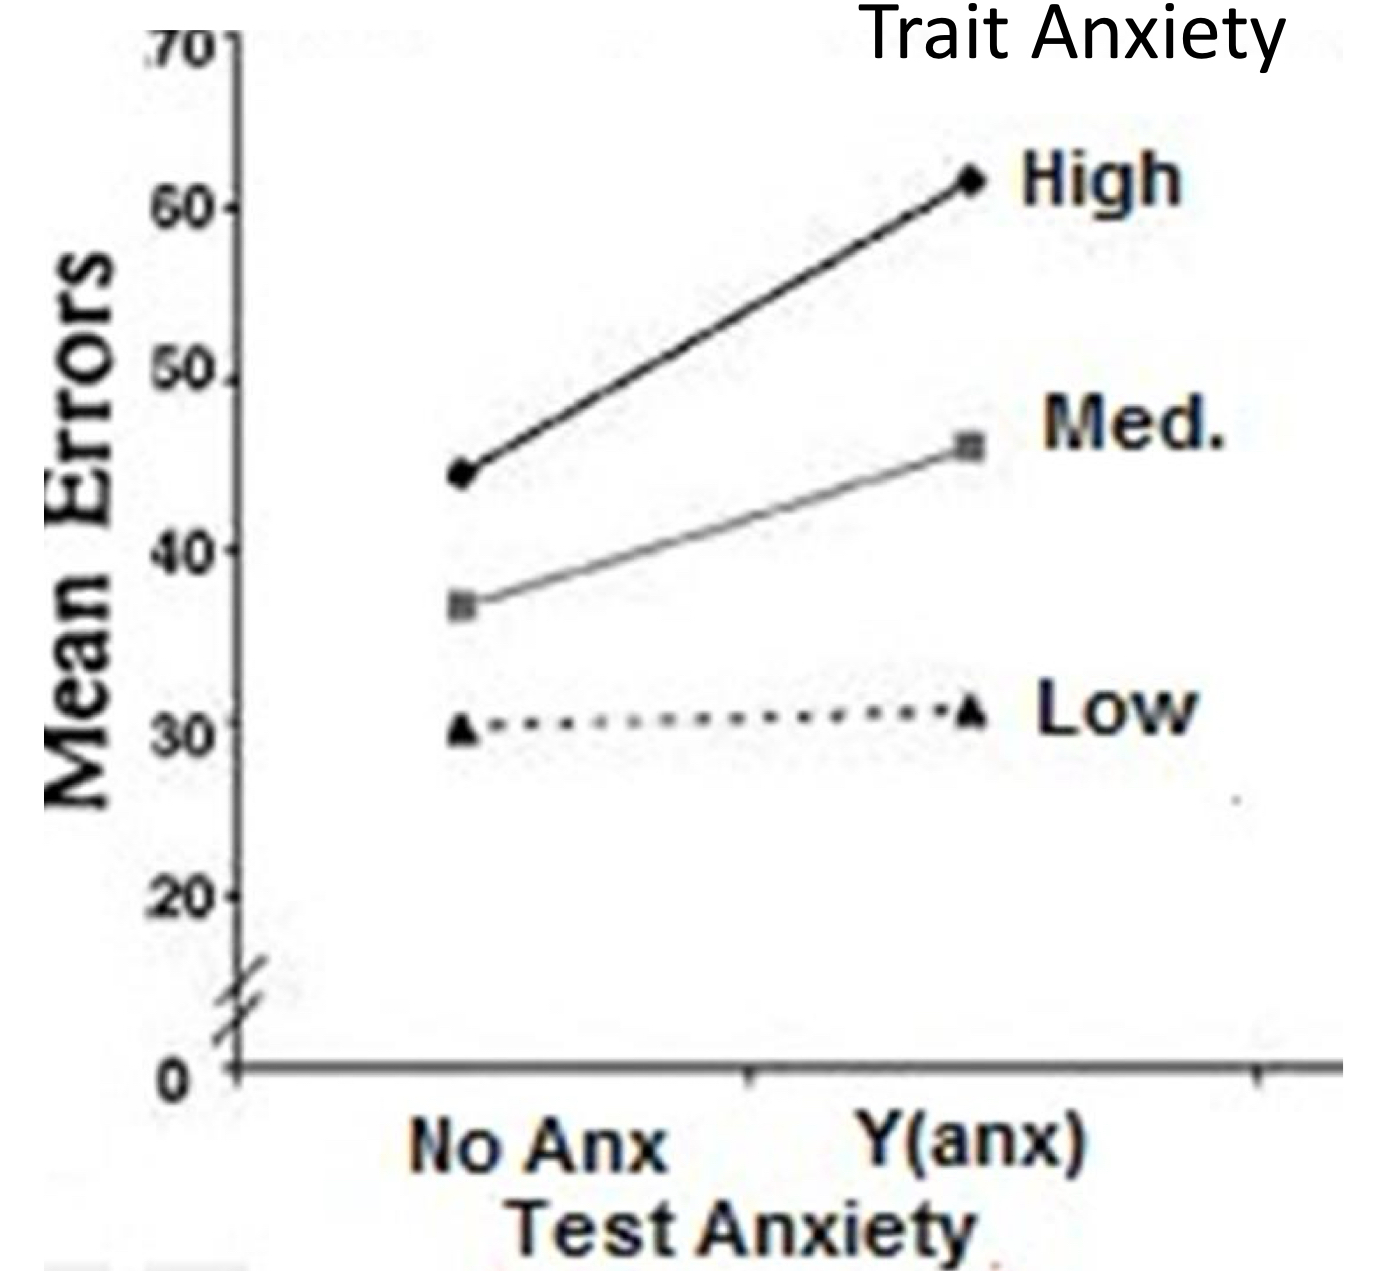
this graph represents a three-way design (test anxiety, trait anxiety and gender), but we are looking at a two-way interaction (test anxiety x trait anxiety). how do we interpret the interaction?
this graph shows a mean across gender
the graph shows an A x B interaction that’s averaged across the levels of C (gender)
there is an interaction: the slopes aren’t parallel
how many hypotheses does a factorial design test?
at least 3: for a 2×2, you have, as null hypotheses:
there is no significant difference between the levels of Factor A (main effect of A)
there is no significant difference between the levels of Factor B (main effect of B)
there is no significant interaction of Factors A & B (interaction of A and B)
what’s an alternative hypothesis?
a prediction of the directionality if your H0 is rejected
ex: level A1 > A2
*it is possible to not know about the directionality, but it’s better to have an idea based on previous experiments
you have a 2 × 2 × 3 factorial designs. how many tests and how many conditions there will be?
tests: 7 (3 main effects + 4 interactions)
A x B, A x C, B x A, A x B x C
this is the number of hypotheses you’ll have
conditions: 12 = 2×2×3
this is the number of boxes you’ll have in a table
true or false: in factorial designs, variance matters
true: you would need to do an ANOVA to determine if the difference in means exceeds the variance
when testing a main effect, what do you want to know?
if the factor differs across levels
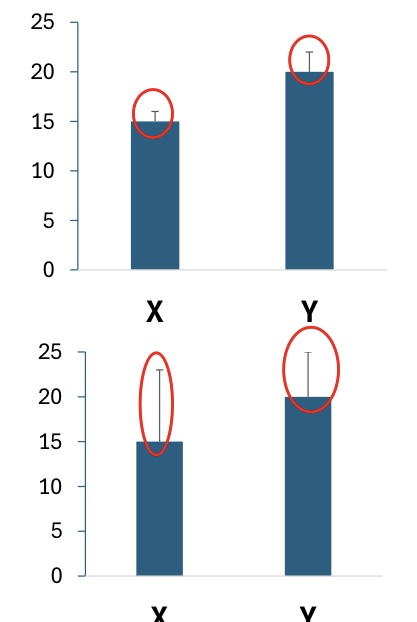
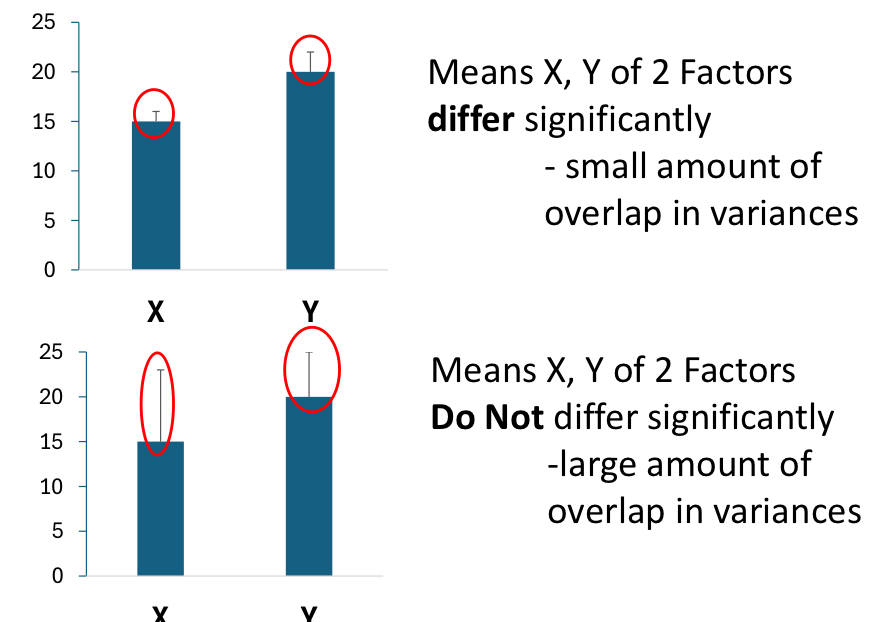
what do the circled bars represent?
the overlapping variance: the bigger the bar, the more overlapping variance
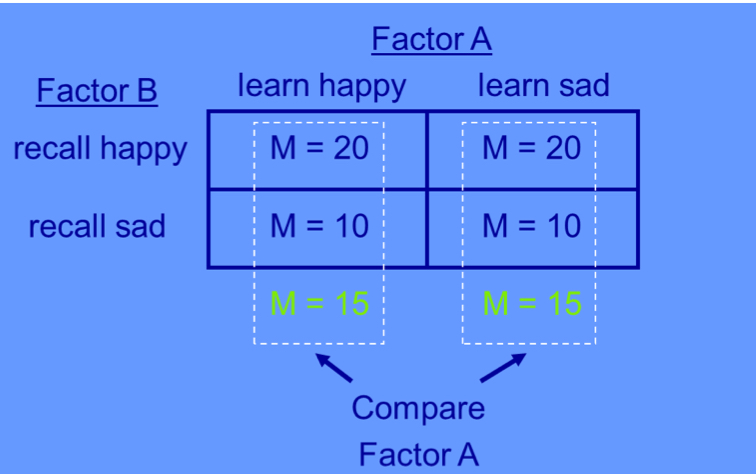
how can you determine if there is a main effect for factor A?
you compare the column means
if they are equal, there is no main effect
if there is a difference, there is a main effect

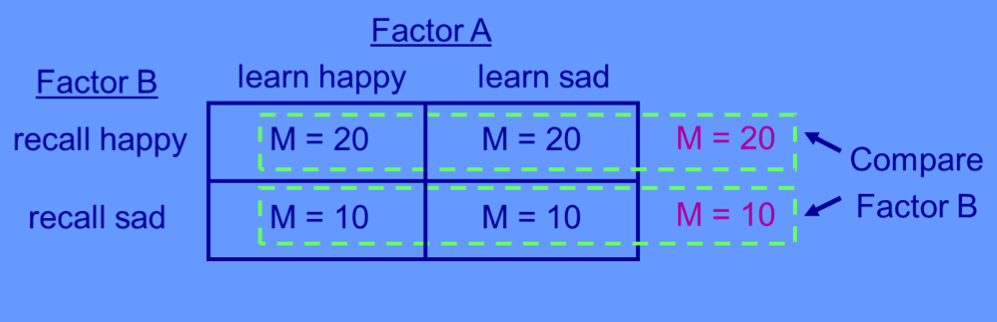
how can you determine if there is a main effect for factor B?
you compare the row means
if they are equal, there is no main effect
if there is a difference, there is a main effect

how can you determine if there is an interaction?
you compare the column means differences
if they are equal, there is no interaction
if there is a difference, there is an interaction
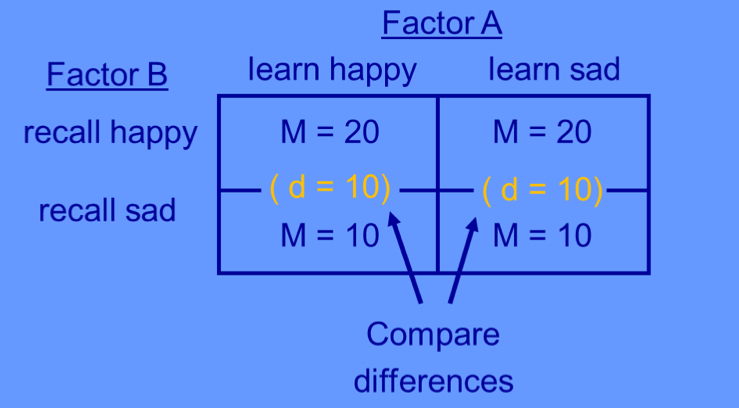
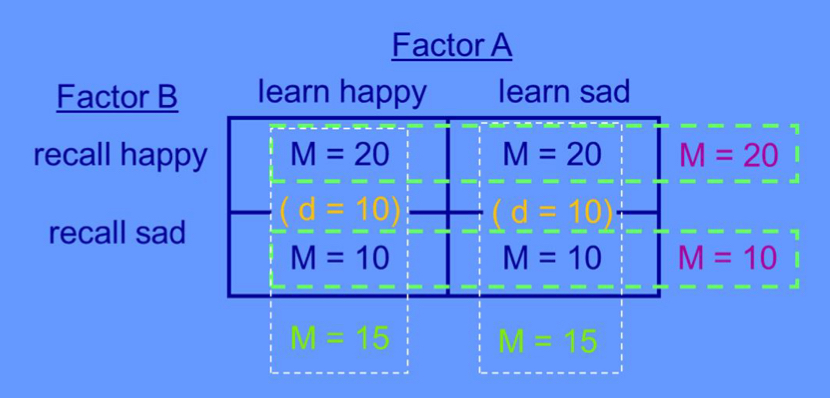
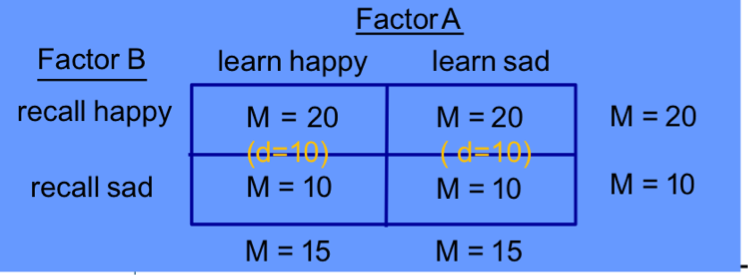
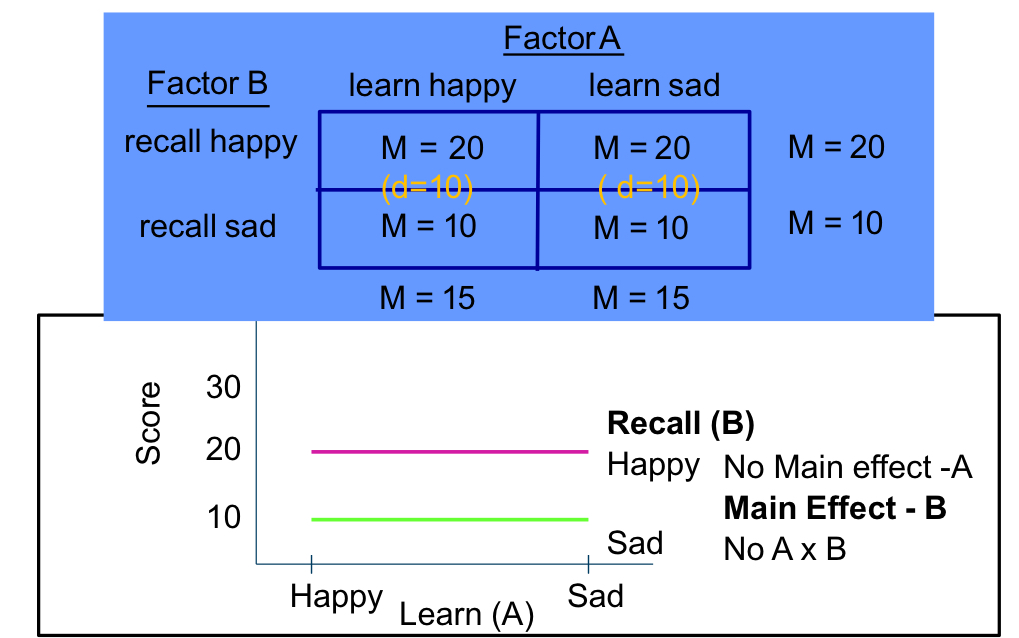
interpret the results of this table: is there a main effect of A, B, an interaction?
Main effect of A: No (15 = 15)
Main effect of B: Yes (20 ≠ 10)
Interaction A x B: No (10 = 10)
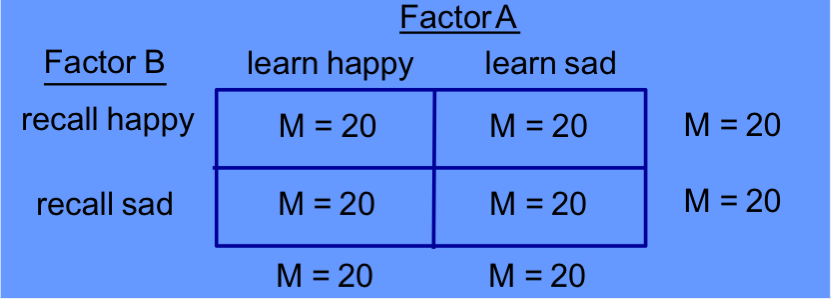
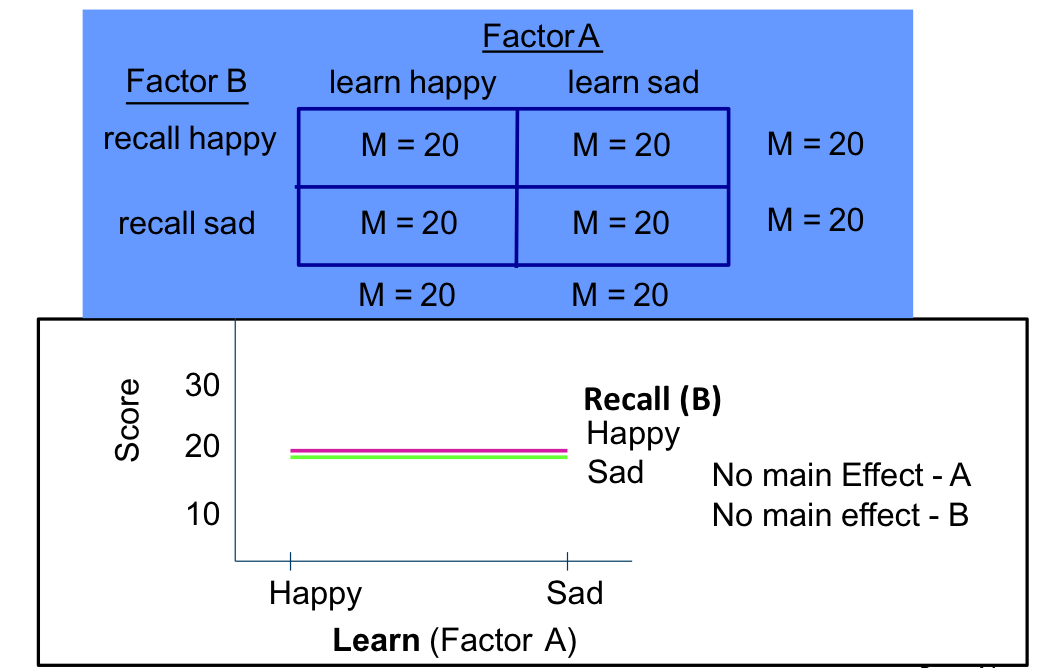
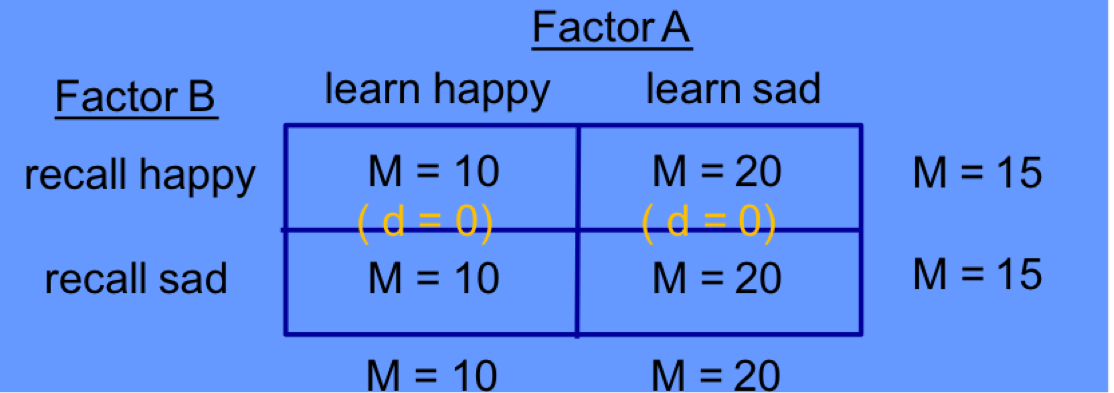
interpret the results of this table: is there a main effect of A, B, an interaction?
Main effect of A: no (20 = 20)
Main effect of B: no (20 = 20)
Interaction: no (0 = 0
interpret the results of this table: is there a main effect of A, B, an interaction?
Main effect of A: No (15 = 15)
Main effect of B: Yes (20 ≠ 10)
Interaction A x B: No (10 = 10)
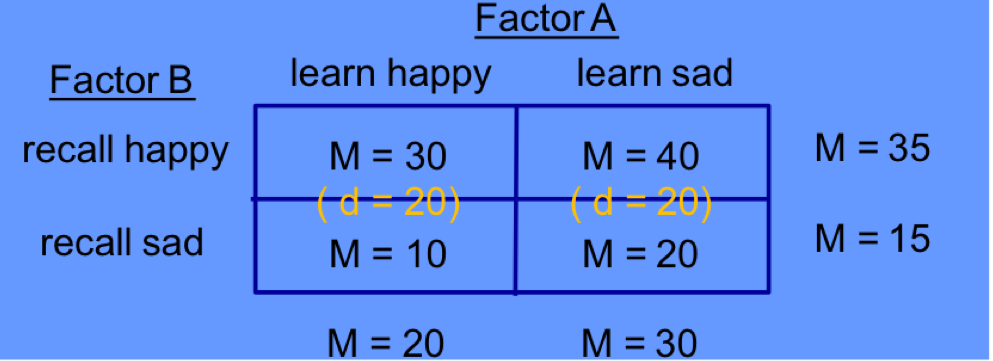
interpret the results of this table: is there a main effect of A, B, an interaction?
Main effect of A: yes (20 ≠ 30)
Main effect of B: Yes (35 ≠ 15)
Interaction A x B: No (20 = 20)
interpret the results of this table: is there a main effect of A, B, an interaction?
Main effect of A: yes (10 ≠ 20)
Main effect of B: no (15 = 15)
Interaction A x B: no (0 = 0)
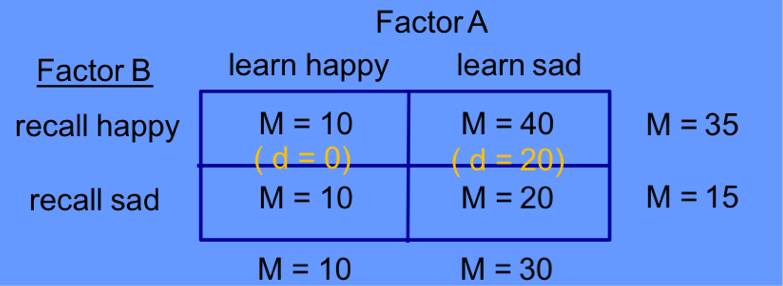
interpret the results of this table: is there a main effect of A, B, an interaction?
Main effect A: yes (10 ≠ 30)
Main effect B: yes (35 ≠ 15)
Interaction A x B: yes (10 ≠ 30)
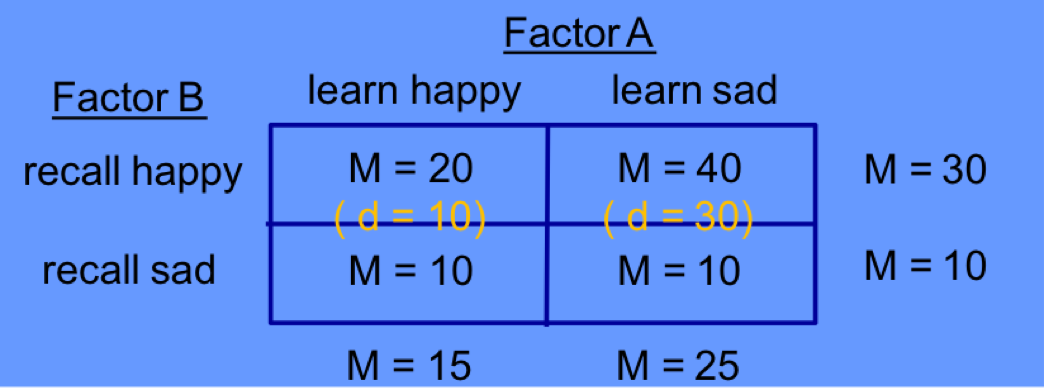
interpret the results of this table: is there a main effect of A, B, an interaction?
Main effect A: yes (15 ≠ 25)
Main effect B: yes (30 ≠ 10)
Interaction A x B: yes (10 ≠ 30)
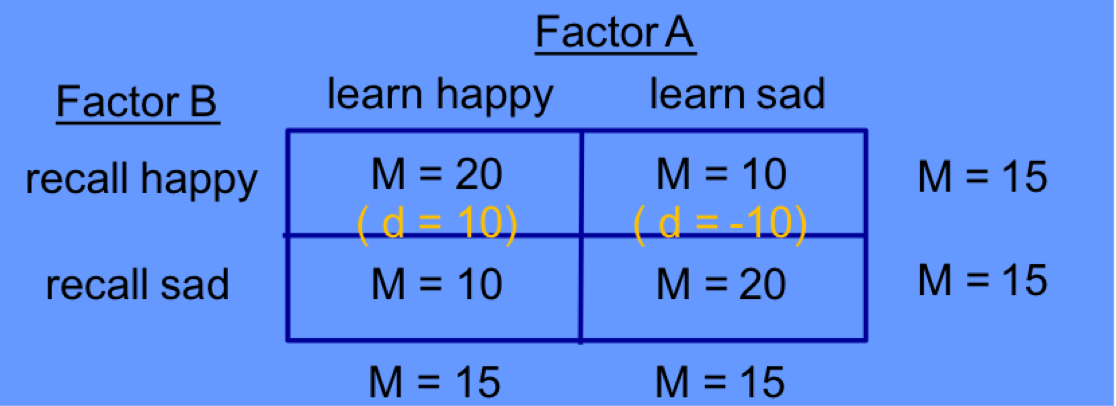
interpret the results of this table: is there a main effect of A, B, an interaction?
Main effect A: no (15 = 15)
Main effect B: no (15 = 15)
Interaction A x B: yes (10 ≠ -10)
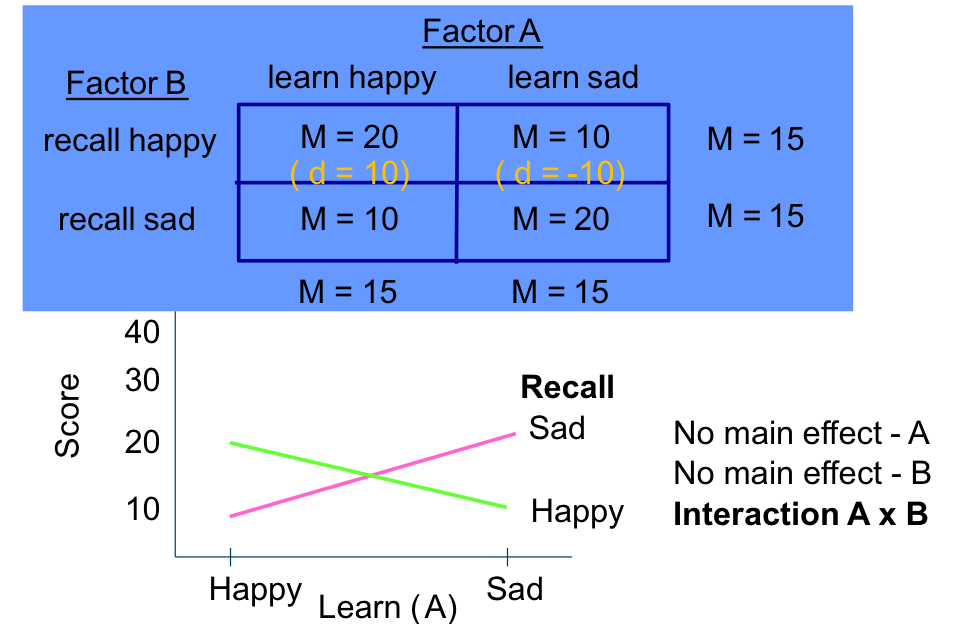
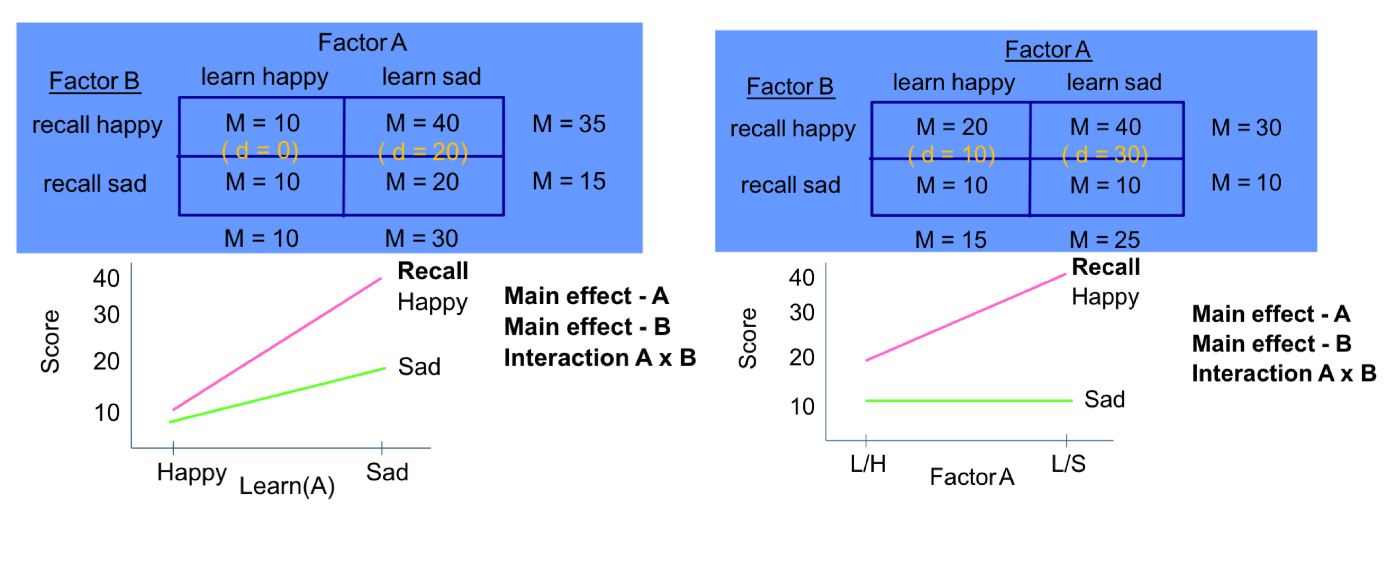
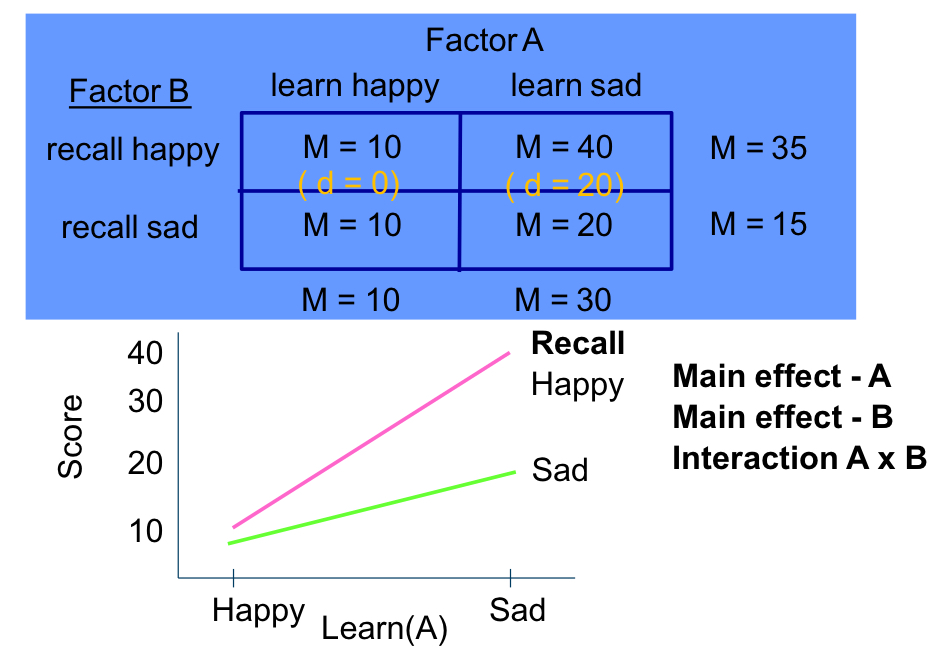
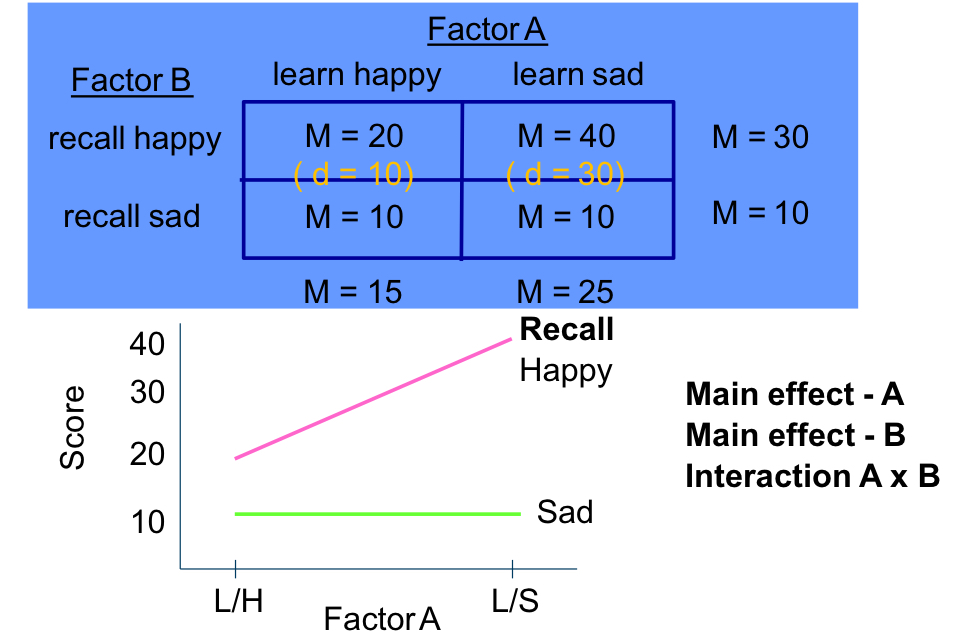
these results both show the same thing: main effect A, main effect B and interaction. however, their graph is different. why?
we have a mean difference in the “learn happy x recall happy”, and “learn sad x recall sad” conditions
when you discuss the results, why do you need to consider the interaction and the main effects at the same time?
because the presence of an interaction can distort the main effects