Genetic information, variation and relationships between organisms
1/30
Earn XP
Description and Tags
Name | Mastery | Learn | Test | Matching | Spaced | Call with Kai | Chat |
|---|
No analytics yet
Send a link to your students to track their progress
31 Terms
Give two structural differences between a molecule of messenger RNA (mRNA) and a molecule of transfer RNA (tRNA)
mRNA is linear whereas tRNA is clover-leaf shaped
mRNA has codons whereas tRNA has anticodons
mRNA does not have a amino acid bonding site, tRNA does
Describe how mRNA is produced in a plant cell. (5 marks)
The DNA strands separate by breaking the hydrogen bonds
One of the strands is used as a template to make mRNA
Complementary base pairing so A → U, T → A , C → G, G → C
RNA nucleotides joined by RNA polymerase
Introns removed to form mRNA
Compare and contrast the DNA in eukaryotic cells with the DNA in prokaryotic cells. (5 marks)
Similarities:
Nucleotide structure is identical
Nucleotides joined by phosphodiester bonds
Differences:
Eukaryotic DNA is longer
Eukaryotic DNA contain introns, prokaryotic DNA does not
Eukaryotic DNA is linear, prokaryotic DNA is circular
Eukaryotic DNA is associated with histones, prokaryotic DNA is not
Not all mutations in the nucleotide sequence of a gene cause a change in the structure of a polypeptide. Give two reasons why. (2 marks)
Triplets code for same amino acid
Occurs in introns / non coding sequence
Explain how copying bases more than once may give rise to a difference in the protein. (2 marks)
It changes the base sequence of later triplets
Outline the similarities in, and the differences in between the structures of DNA and RNA. (6 marks)
Similarities:
Polymers of nucleotides
Joined by phosphodiester bonds
Contain a pentose sugar, base and a phosphate
Differences:
Deoxyribose v ribose
Thymine v uracil
Long v short
Suggest and explain one reason why bacteria might not be able to produce every human protein. (1 mark)
Cannot splice (pre-mRNA), so cannot remove introns
OR Do not have Golgi (apparatus), so cannot process/modify (proteins)
OR Do not have transcriptional factors (required), so cannot carry out transcription/produce mRNA
Haemoglobins are chemically similar structures found in many different species.
Differences in the primary structure of haemoglobin molecules can provide evidence of phylogenetic (evolutionary) relationships between species.
Explain how. (5 marks)
Mutations change nucleotide sequence
Causing change in amino acid sequence
Mutations build up over time
More mutations between distantly related species
Distantly related species have an earlier common ancestor
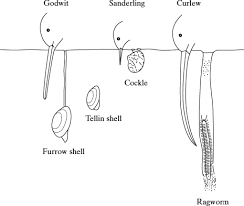
Some birds feed on animals found in mud in estuaries. The drawing shows the heads of three species of these birds and their prey.
Use the information in the drawing to explain how interspecific competition between the birds is reduced. (2 marks)
There is less competition between birds with beaks of different lengths
Birds have different size beaks to reach the different types of prey they feed upon
What is meant by the term genetic diversity? (1 mark)
Number of different alleles of a gene
Crossing over greatly increases genetic diversity in this species of moss. Describe the process of crossing over and explain how it increases genetic diversity. (4 marks)
Homologous pairs of chromosomes associate
Chiasma form
Lengths of alleles are exchanged
Producing new combinations of alleles
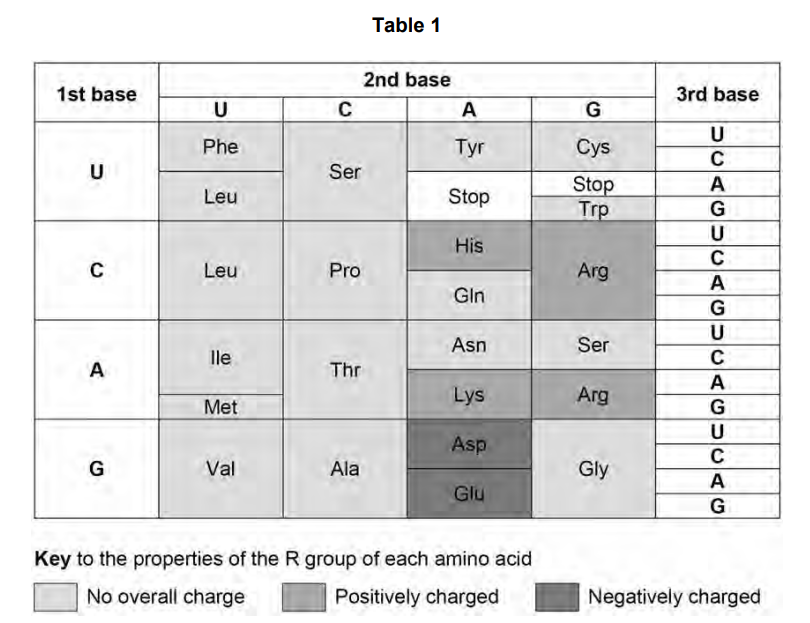
Use information from Table 1 to tick one box that shows a base substitution mutation in DNA that would result in a change from Val to Ala at amino acid number 203. (1 mark)
CAA → CGA
GUU → GCA
GUU → GUC
CAC → CGG
CAA → CGA
Define the term exon (1 mark)
DNA bases that code for a specific polypeptide
Describe how a gene is a code for the production of a polypeptide. Do not include information about transcription or translation in your answer. (3 marks)
Because the base/nucleotide sequence
is in triplets
Determines the order of amino acid sequence in polypeptide
Scientists investigated the genetic diversity between several species of sweet potato. They studied non-coding multiple repeats of base sequences.
Define 'non-coding base sequences' and describe where the non-coding multiple repeats are positioned in the genome. (2 marks)
Non-coding base sequences are DNA that do not code for proteins
They are positioned between genes
What is a codon? (2 marks)
Three bases on mRNA
That code for an amino acid
In Figure 2 the chromosomes are arranged in homologous pairs. What is a homologous pair of chromosomes? (1 mark)
Two chromosomes that carry the same genes
Define ‘gene mutation’ and explain how a gene mutation can have:
no effect on an individual
a positive effect on an individual
(4 marks)
(Definition of gene mutation)
Change in the base/nucleotide (sequence of chromosomes/DNA)
Results in the formation of new allele
(Has no effect because)
Genetic code is degenerate (so amino acid sequence may not change) OR Mutation is in an intron (so amino acid sequence may not change)
Does change amino acid but no effect on tertiary structure
New allele is recessive so does not influence phenotype
(Has positive effect because)
Results in change in polypeptide that positively changes the properties (of the protein) OR Results in change in polypeptide that positively changes a named protein
May result in increased reproductive success OR May result in increased survival (chances)
Give two ways in which the arrangement of prokaryotic DNA is different from the arrangement of the human DNA. (2 marks)
Circular (as opposed to linear)
Not associated with proteins/histones
Only one molecule/piece of DNA OR present as plasmids
Describe how a polypeptide is formed by translation of mRNA. (6 marks)
mRNA attaches to ribosomes
tRNA anticodons bind to complementary mRNA codons
tRNA brings a specific amino acid
Amino acids join by peptide bonds
Amino acids join together with the use of ATP
tRNA released after amino acid joined to polypeptide
The ribosome moves along the mRNA to form the polypeptide
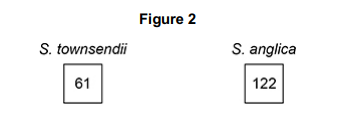
Name the type of mutation that changed the number of chromosomes in S. townsendii to produce S. anglica. Explain your answer. (3 marks)
Non disjunction
In meiosis
Chromosomes not separated
Genetic variation within a species is increased during meiosis by crossing over and the independent segregation of homologous chromosomes. Apart from mutation, explain one other way genetic variation within a species is increased. (2 marks)
Random fusion of gametes
Produces new allele combinations
The offspring produced from farmed trout are sterile. Suggest and explain why. (2 marks)
The offspring produced from farmed trout have extra copies of chromosomes
Their homologous chromosomes do not pair
Scientists set up three fish tanks, each containing a separate population. Each year the scientists removed all the fish from each tank and determined the mean mass of the fish removed. They then put back 10% of each population in the following way.
Tank A – put back only the largest fish.
Tank B – put back fish at random.
Tank C – put back only the smallest fish.
During each year the fish were left to grow and reproduce.
What type of selection were the scientists modelling in this investigation by putting back only the largest or only the smallest fish in Tank A and Tank C? Give a reason why (2 marks)
Directional
One extreme selected
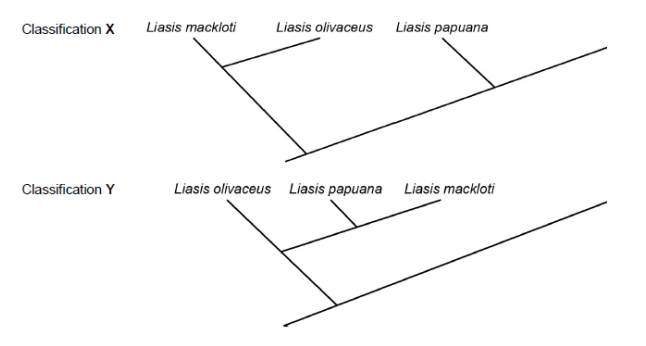
The diagram shows two different ways of classifying the same three species of snake.
Classification X is based on the frequency of observable characteristics
Classification Y is based on other comparisons of genetic characteristics. All three species of snake belong to the Python family.
State three comparisons of genetic diversity that the scientists used in order to generate Classification Y. (3 marks)
The base sequence of DNA
The base sequence of mRNA
The amino acid sequence of proteins
Some populations of animals that have never been hunted show very low levels of genetic diversity. Other than hunting, suggest two reasons why populations might show very low levels of genetic diversity.
Population might have been very small
Population might have started with small number of individuals
Inbreeding
Explain why it is more useful to calculate an index of diversity than to record species richness. (2 marks)
Measures abundance of each species
May be many of some species
Bees are flying insects that feed on nectar made in flowers. There are many different species of bee. Scientists investigated how biodiversity of bees varied in three different habitats during a year. They collected bees from eight sites of each habitat four times per year for three years.
Suggest and explain three ways in which the scientists could have improved the method used for data collection in this investigation. (3 marks)
Collect at more times of the year so more points on graph/better line (of best fit) on graph
Counted number of individuals in each species so that they could calculate index of diversity
Collected from more sites/more years to increase accuracy of data
Describe how you would investigate the effect of an invasion by a non-native species of plant (a biotic environmental factor) over many years on the abundance of a native species of plant in a community. (4 marks)
Set up grid system with coordinates
Place large number of quadrats at coordinates selected at random
Count number of / estimate percentage cover of native plant in quadrats
Repeat at same time each year (for many years)
The index of diversity of the insects was higher in the hedge than in the barley field. Suggest why. (3 marks)
More plant species
More food sources / variety of food
More habitats / niches
What is meant by ‘species richness’? (1 mark)
A measure of the number of different species in a community