08 - Nature's Network: Multispecies Interactions & Food Webs
1/75
There's no tags or description
Looks like no tags are added yet.
Name | Mastery | Learn | Test | Matching | Spaced | Call with Kai |
|---|
No analytics yet
Send a link to your students to track their progress
76 Terms
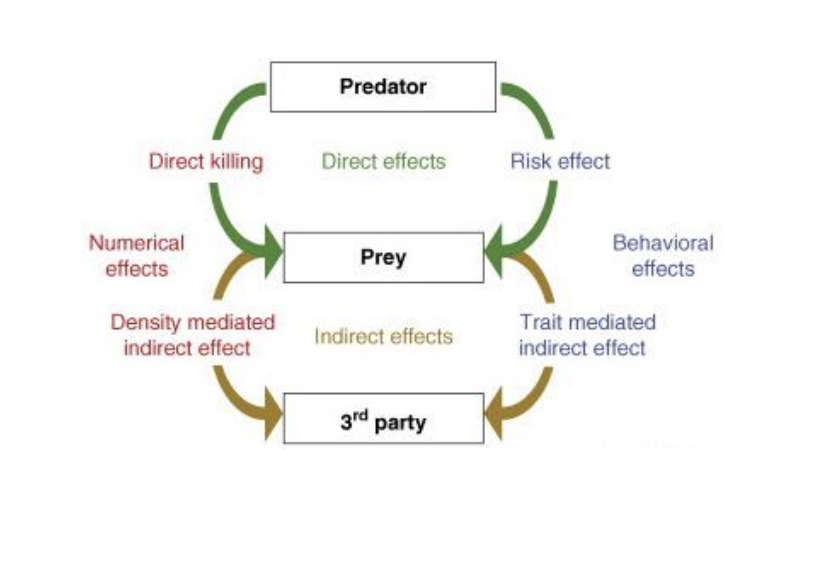
Indirect Effects
The effects of linked interactions among more than two species are called an indirect effect.
• Fish
• Tadpole
• shrimp
Food Chains
Food chains provide a simple conceptual model for energy flows in a community. They depict trophic interactions and simplify community dynamics by sorting species into clearly defined trophic levels.5
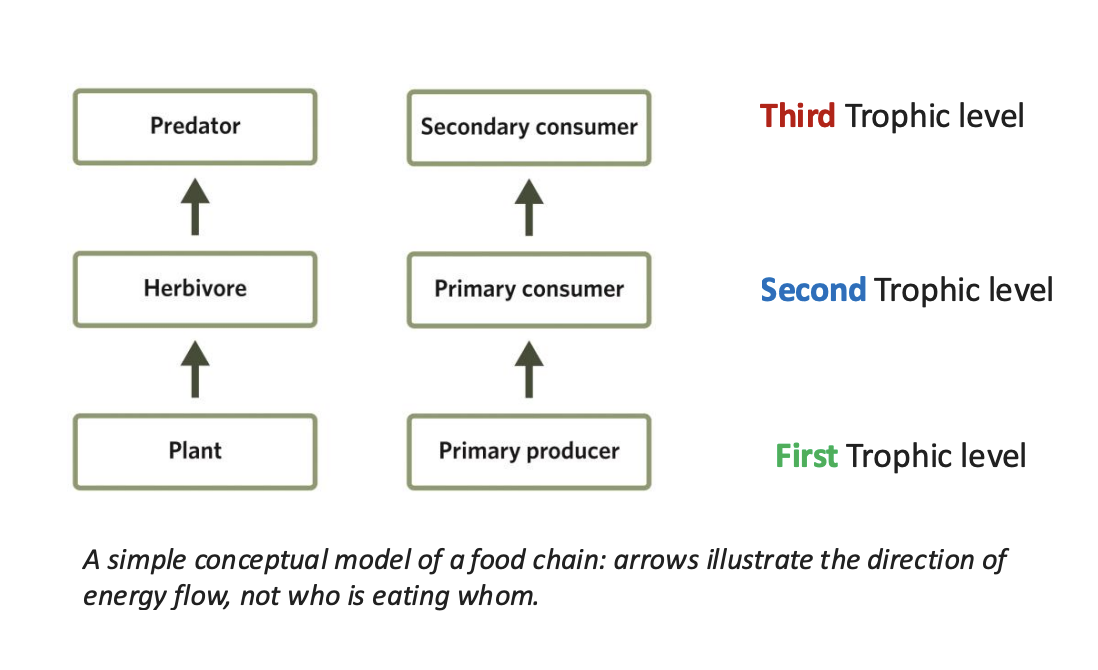
Four trophic-level food chains
Numerical ranks indicate the trophic level, with arrows pointing in the direction of energy flow. Each trophic level also has an alternative nomenclature that indicates the level or type of organism.
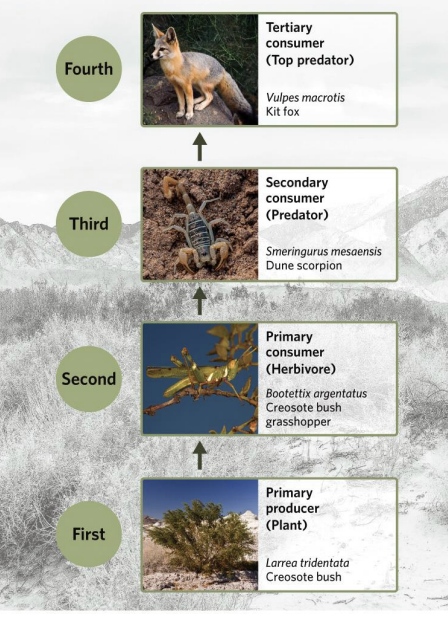
are more trophic levels possible after four
More trophic levels are possible when there is higher energy availability and efficient energy transfer, conditions often found in aquatic ecosystems.
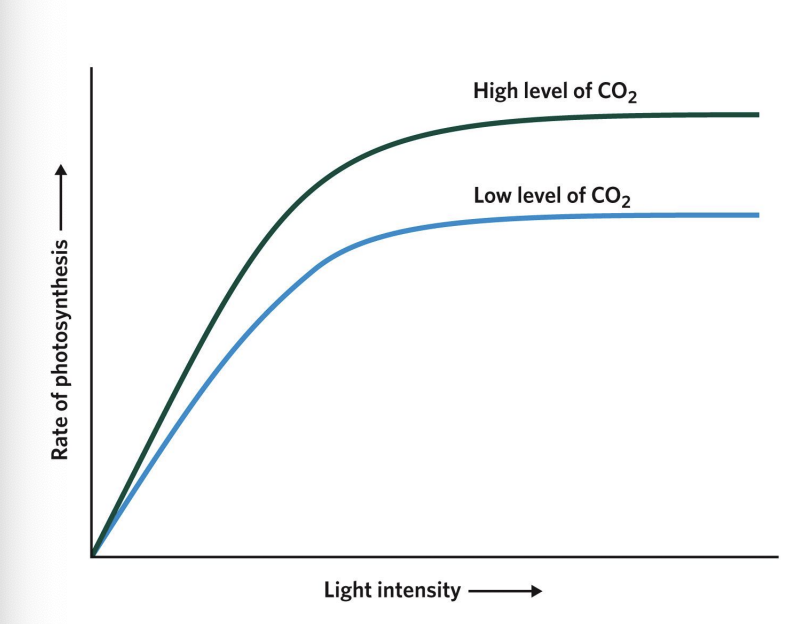
does photosynthesis = unlimmited energy
Photosynthesis does not afford plants access to unlimited energy.
➢ At low light levels, light intensity itself limits photosynthesis and, therefore, energy acquisition.
➢ At high-intensity light levels, plants lose water through open stomata, but closing the stomata limits access to CO2 .
➢ Eventually, all plants hit a plateau in photosynthetic rate and energy acquisition.
Only ____% of the total solar energy reaching Earth is converted into biomass by photosynthesis
~1–2
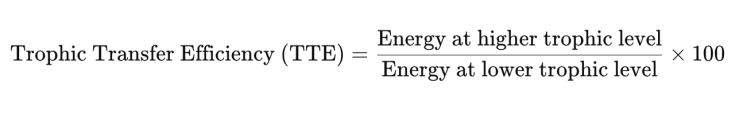
Trophic energy transfer efficiency refers to the
percentage of energy passed from one trophic level to the next in a food chain or food web.
Trophic Transfer Efficiency equation
Trophic level energy conversion in the context of the historical Lake Tahoe food chain
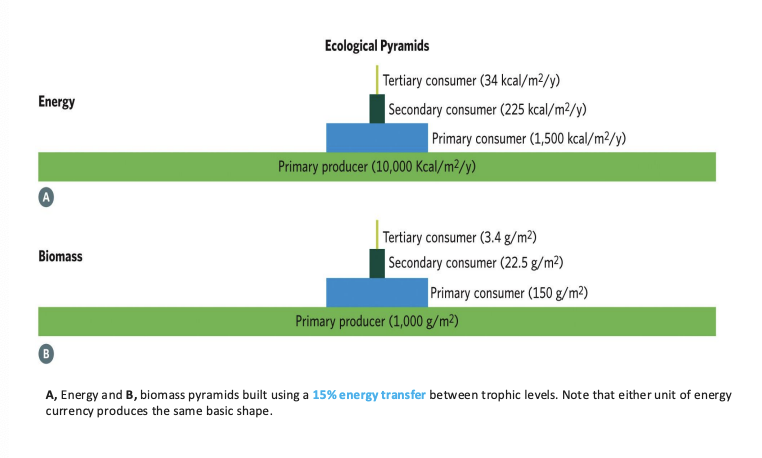
a human Washoe tribe member as a top predator. Each higher trophic level receives only 15% of the energy from the level below it.
Therefore, 1,000 calories of algae are needed at the bottom of the food chain to produce 0.5 calories of human body tissue at the top

Limits on trophic energy transfer efficiency lead to trophic pyramids that can equivalently be expressed as
the amount of energy or the amount of biomass contained within each trophic level.
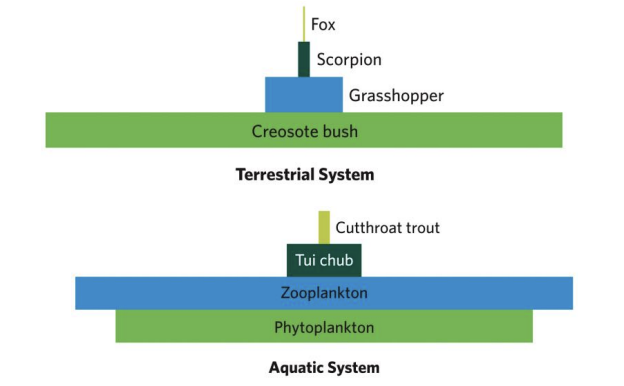
Terrestrial vs Aquatic Trophic Pyramids
Aquatic trophic pyramids, for example, often display a lower biomass of phytoplankton (primary producers) than zooplankton (primary consumers) at any given point in time.
However, phytoplankton have such short lifespans and fast reproduction rates that their biomass still adds up to well more than the biomass of primary consumers when viewed over the entirety of the primary consumer’s generation time.
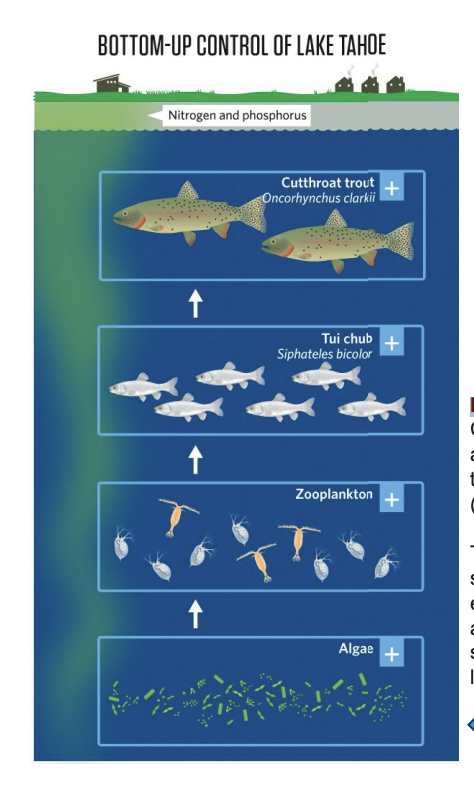
Bottom-Up Control:
Control of the energy flow in a food web by organisms at the basic trophic level (autotrophs).\
The abundance of autotroph s limits the amount of energy that is available to, and thus, the abundance of, species at higher trophic levels.
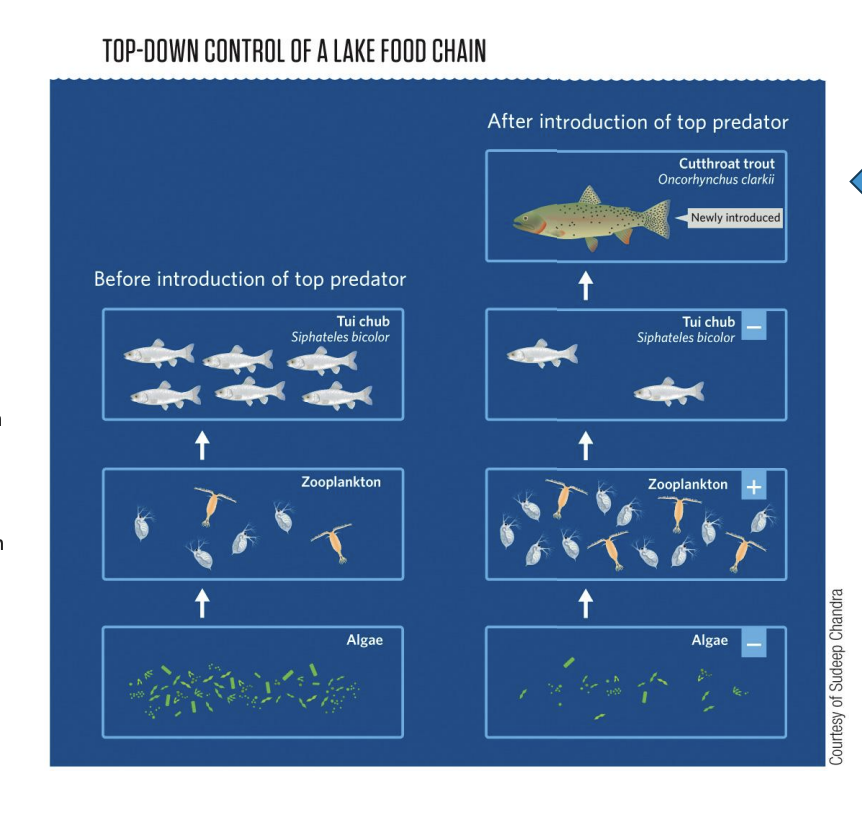
Top-Down Control
Control of the energy flow in a food web by organisms at the upper trophic levels. By eating organisms at the lower trophic levels, the species at the upper trophic levels control the biomass and abundance of the lower levels.
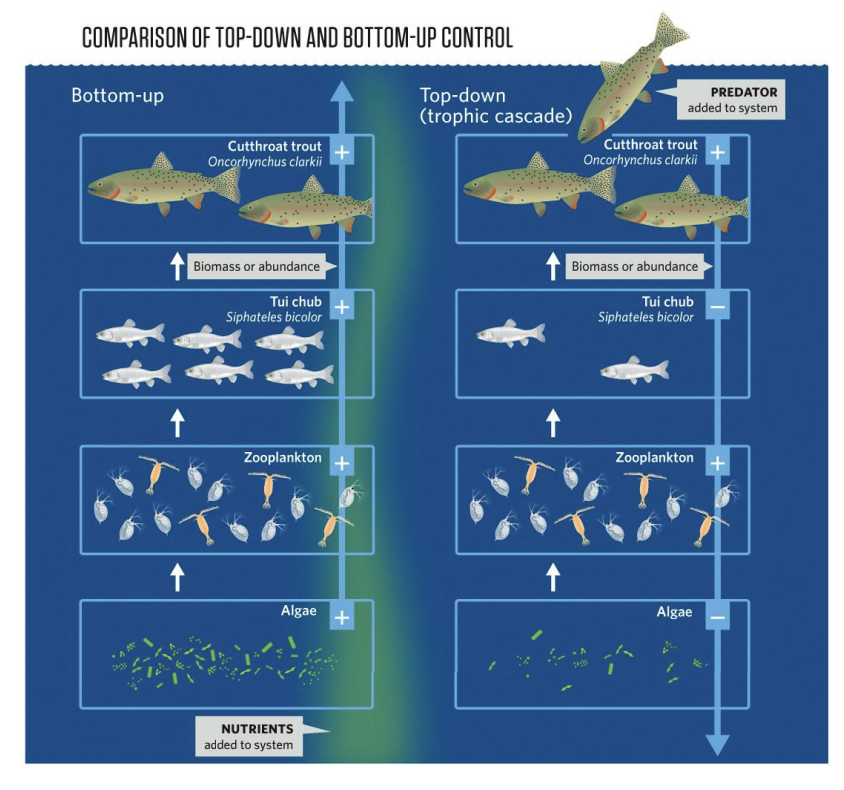
Bottom-Up Control vs Top-Down Control: Definition
Bottom-Up Control: Regulation of ecosystem structure and productivity is driven by the availability of nutrients and energy from lower trophic levels.
Top-Down Control: Regulation is driven by predation pressure from higher trophic levels on lower ones.
Bottom-Up Control vs Top-Down Control: main driver
Bottom-Up Control: Nutrients and primary productivity (light, phosphorus, nitrogen).
Top-Down Control: Predators and consumer interactions (fish, zooplankton, phytoplankton)
Bottom-Up Control vs Top-Down Control: Direction of Control
Bottom-Up Control:Energy flow and effects move upward through the food web.
Top-Down Control: Effects move downward through the food web.
Bottom-Up Control vs Top-Down Control: Example in a Lake
Bottom-Up Control:Increased nutrient input (eutrophication) → boosts phytoplankton growth → increases zooplankton → supports more fish
Top-Down Control: Increase in predatory fish → decreases zooplankton (their prey) → allows phytoplankton to increase (since fewer grazers).
Bottom-Up Control vs Top-Down Control: Outcome
Bottom-Up Control: Ecosystem productivity depends on nutrient supply and light availability.
Top-Down Control: Ecosystem composition and productivity depend on trophic interactions and predation strength.
Bottom-Up Control vs Top-Down Control: Management Focus
Bottom-Up Control: Reduce or add nutrients to influence productivity (e.g., nutrient limitation experiments).
Top-Down Control: Manipulate predator populations (biomanipulation) to restore ecological balance
The effects of bottom-up control
The effects of bottom-up control can often be seen by enriching the lowest trophic level and observing the effects on biomass across upper trophic levels
The effects of bottom-up control example
Example: The addition of nutrients to aquatic ecosystems, for example, through agricultural fertilizer runoffs, can turn oligotrophic water bodies (a few primary producers, low biomass) into eutrophic ones (many primary producers, high biomass
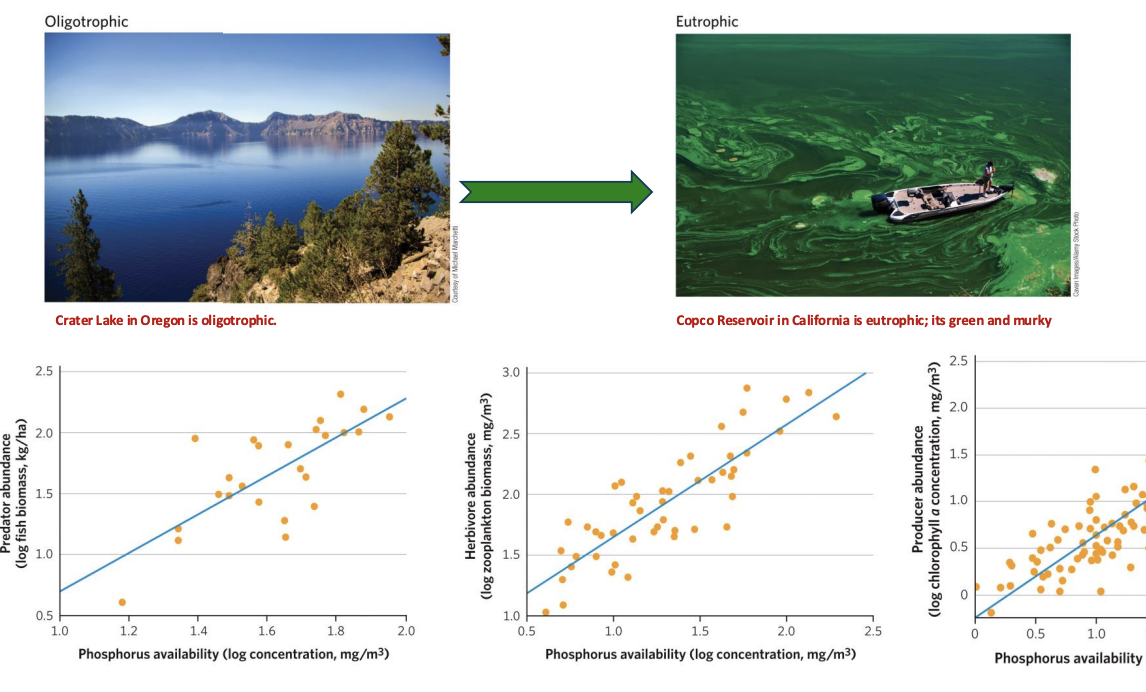
Eutrophication
Eutrophication is the process by which a water body becomes enriched with excess nutrients, especially nitrogen (N) and phosphorus (P), leading to overgrowth of algae and phytoplankton.
steps in Eutrophication
1. Nutrient Enrichment
Agricultural runoff, sewage, or detergents add nitrogen and phosphorus to lakes or rivers.
2. Algal Bloom Formation
Rapid growth of phytoplankton or algae (often forming a thick green layer on the surface).
3. Sunlight Blockage
Dense algal cover blocks sunlight, preventing it from reaching submerged aquatic plants.
4. Decay and Decomposition
When algae die, decomposers break them down, consuming large amounts of dissolved oxygen (DO).
5. Oxygen Depletion (Hypoxia)
Oxygen levels drop, causing fish kills and disrupting the entire aquatic ecosystem.
The effects of top-down control
The effects of top-down control were first outlined by Aldo Leopold and subsequently, Hairston, Smith, and Slobodkin (HSS), based on the simple observation that the terrestrial world is generally fairly green: what keeps herbivores in check from completely depleting plant biomass?
Top-down control implies that food chains with odd numbers of trophic levels have
have high densities of primary producers (a green world),
Top-down control implies that food chains with even numbers of trophic levels have
low densities of primary producers (a brown world).
When herbivore numbers are not limited, they can
deplete plant life.
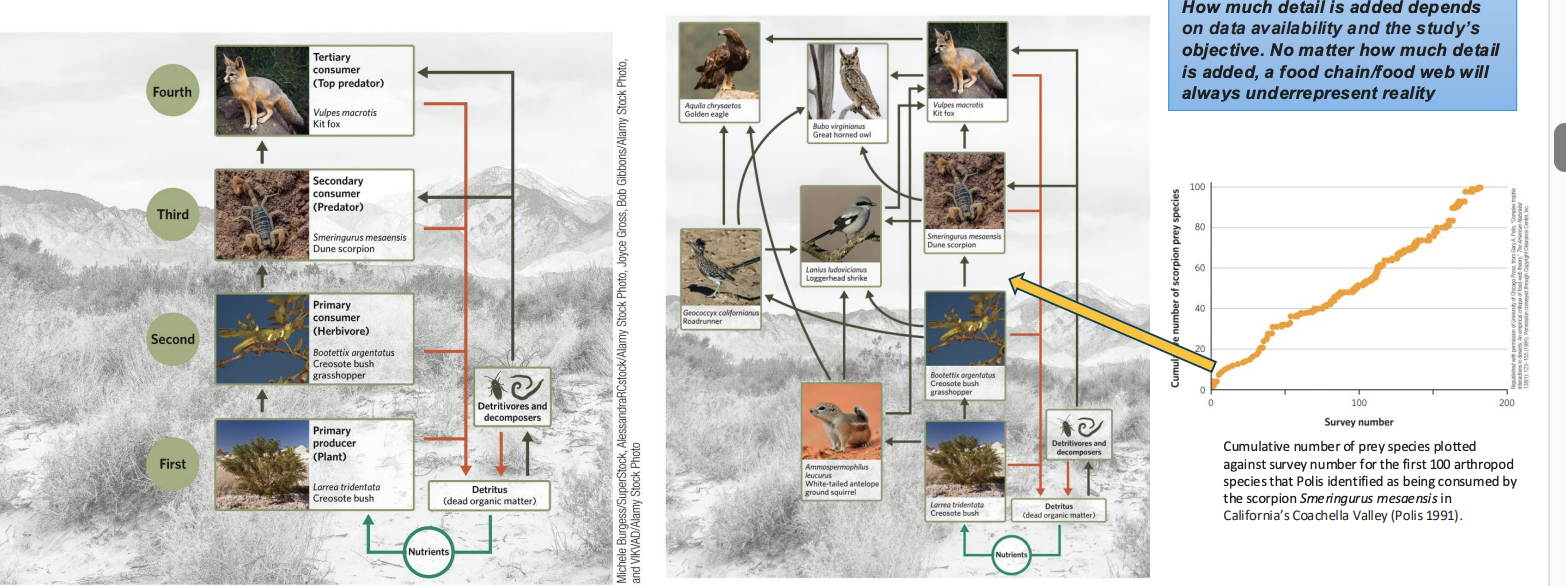
Food Webs: Adding Complexity
Food chains are simplified representations of reality that omit much biological detail. They do not distinguish between different species at the same trophic level, omit diet variations (e.g., across seasons or ontogeny), omit multiple feeding interactions both within (e.g., diet variation of a carnivore) and across trophic levels (e.g., omnivory), and omit detritivores and decomposers.
Examples of Food Webs
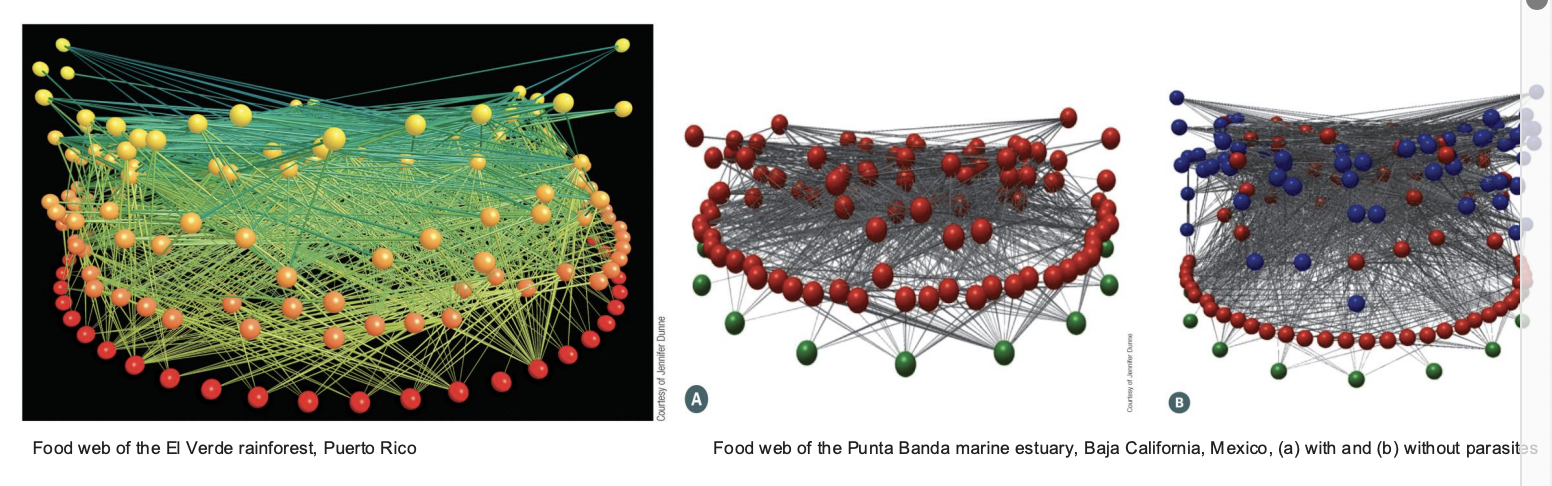
Modern food web diagrams typically use three-dimensional “ball-and-stick diagrams” to represent the complexity of connections (sticks) among species at various trophic levels (balls; colours indicate trophic levels)
variation in Trophic Levels in Food Web
Variation in diet makes it difficult to assign a specific trophic level to a species, as we have done for food chains. Species rarely feed on one trophic level only; quantifying this diet variation is critical for correctly assigning trophic levels.
eg Squirrels as a group are omnivores and consume a wide variety of food types beyond nuts and berries, including animal protein (e.g., spiders, snakes, small birds, and small mammals) on occasion.
Multiple methodologies exist for determining a species’ diet.
Direct Observation
Gut content and fecal analyses
Determining Diets and Trophic Levels: Direct Observation
1. Direct observation was key in many classical studies. However, this method is comparatively inefficient and easily creates documentation biases towards common diet items; diet items that are rarely consumed can easily be missed due to limited observation periods.
Determining Diets and Trophic Levels: Gut content and fecal analyses
2) Gut content and fecal analyses are direct methods ecologists use to understand an animal’s diet composition and therefore identify its trophic position (feeding level) in a food web.
Gut Content Analysis
examining the stomach or intestinal contents of an organism.
• Microscopic, chemical, or DNA techniques can reveal the types of prey or plant material consumed.
• This provides short-term dietary information, a “snapshot” of recent feeding behaviour.
Example: Studying fish gut contents can show whether they fed mostly on
Fecal Analysis
Examines undigested remains (such as bones, hair, scales, plant fibres) in feces.
• Reflects the overall diet over a longer period, complementing gut analysis.
Example: Analyzing the feces of wolves may reveal prey species, helping confirm their role as top predators
Stable isotope
are variants of chemical elements that have differing numbers of neutrons in the atomic nucleus that do not decay radioactively over time.
As stable isotopes are preserved through trophic transmission, these ratios can be used to determine an individual’s diet, days, weeks, or even months into the past, depending on the tissue sample.
Using a _____, ecologists can measure the ratio of different isotopes in tissue samples.
mass spectrometer
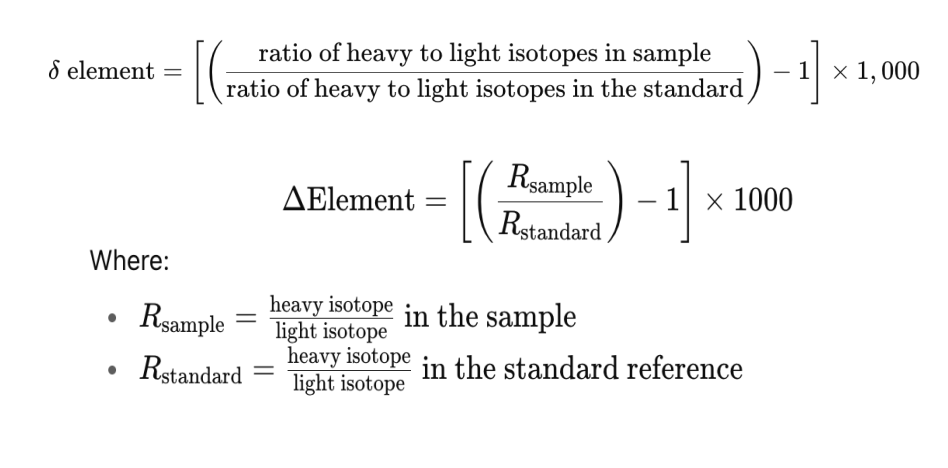
Isotope formula
Carbon isotopes are_____
conserved when an organism eats a food item
Nitrogen isotopes____
accumulate up a food chain.
The δ notation denotes
measurement from a tissue sample made relative to an isotopic standard
nitrogen and carbom across a food pyramid
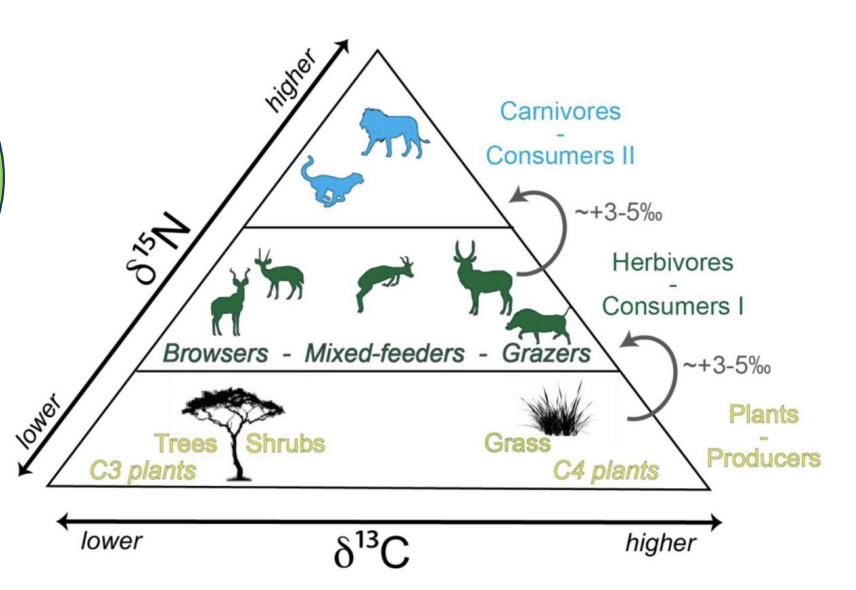
Measuring the carbon isotope ratio 13C:12C in tissue samples can indicate
the source of an individual’s carbon, because different species of primary producers have differing carbon isotope ratios 13C:12C signatures
Measuring the nitrogen isotope ratio 15N:14N in tissue samples can indicate
an individual’s trophic position, because 15N accumulates in higher trophic levels (~3.4 additional units of 15N per trophic level)
Food Web Energy Limits
Top predators occur at much lower densities than lower trophic levels due to the limits on energy transfer efficiency. A hypothetical predator of such top predators would have to cover huge distances and expend large amounts of energy to sustain itself. Such amounts of energy are simply not available at upper trophic leve

Considering the limited trophic energy transfer efficiency can reveal unexpected ecosystem connections.
For example, many ecosystems are supported by both endogenous and exogenous energy inputs
Allochthonous
refers to organic material or energy that originates outside a particular ecosystem and is imported into it.
River Continuum Hypothesis
explains that a river is an ecological continuum, where energy sources, organisms, and processes change gradually and predictably from headwaters to mouth — creating a linked, dynamic system.
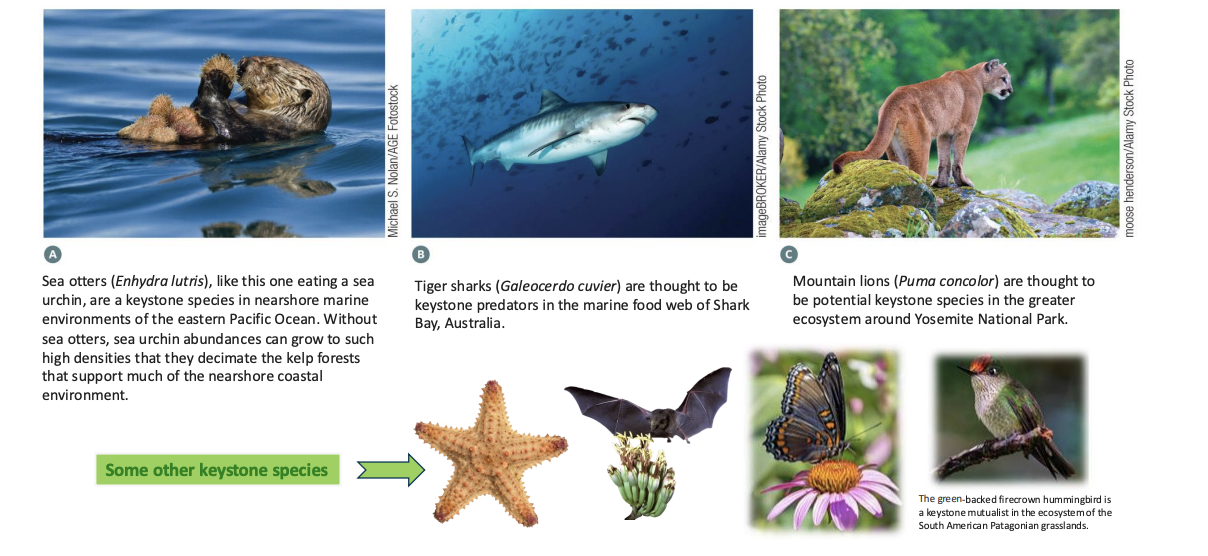
Keystone Species:
is one that significantly impacts its ecosystem relative to its abundance or biomass.
➢ If a keystone species is removed, the entire ecosystem
may undergo significant changes, often leading to loss of biodiversity or collapse of community structure.
Keystone Predators:
those that help maintain species diversity by controlling the population of dominant competitors or herbivores, thus preventing any single species from monopolizing resources.
Example: Grey Wolf (Canis lupus) in Yellowstone preys on elk, regulating herbivore numbers and allowing vegetation and other species to recover (classic trophic cascade example).
Keystone Mutualists:
those that engage in mutualistic interactions crucial for the survival or reproduction of many other species. Their removal disrupts essential ecological processes.
Example: Honey Bees (Apis mellifera) pollinate a wide variety of plants; without them, plant reproduction and food webs would collapse.
Other examples of Keystone Species
Indirect effects of interactions
can substantially influence community function and structure.
four common types of indirect effect interactions.
resource competition
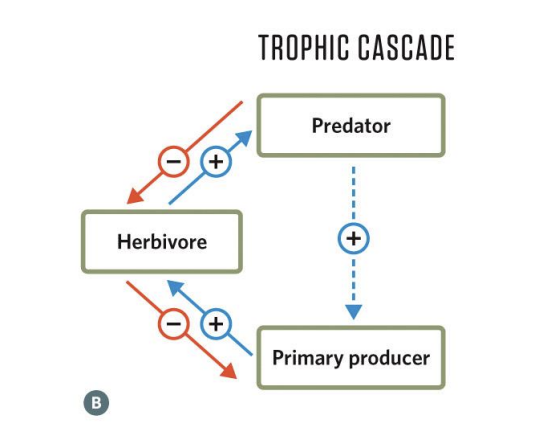
trophic cascade
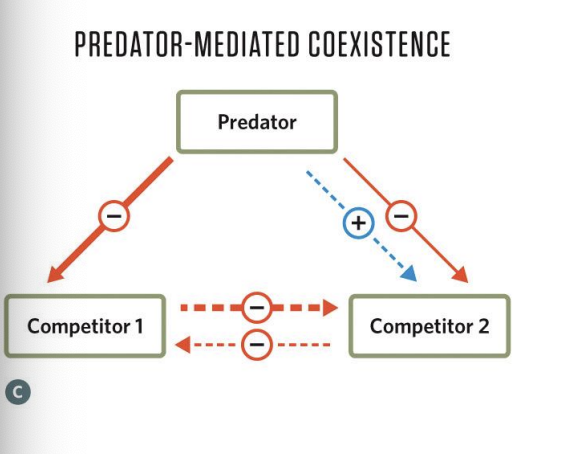
predatory mediated co existence
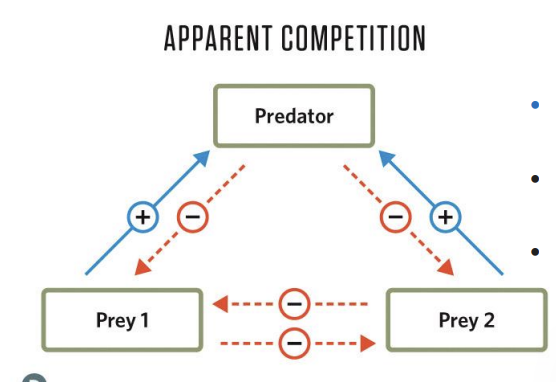
apparent competition
resource competition
Solid arrows for direct effects
Dashed arrows for indirect effects.

trophic cascade
Solid arrows for direct effects
Dashed arrows for indirect effects.
Example: tortoises and cactus mice negatively influence each other’s abundances, but this is not through competition for a shared resource but rather through regulation by a shared predator.
predatory mediated co existence
Solid arrows for direct effects
Dashed arrows for indirect effects.
Example: Predatory sea stars hold highly competitive barnacles in check, allowing a diverse community to thrive
apparent competition
Solid arrows for direct effects
Dashed arrows for indirect effects.
Examples: Wolves in Yellowstone NP. Sea otters & kelp forests
Interaction Webs vs Food Webs
Despite their complexity, food webs remain simplified representations of reality that omit much biological detail. In particular, they do not consider non-feeding interactions or knock-on effects of feeding interactions that ripple through the community. Interaction webs aim to include such interactions in addition to trophic interactions.
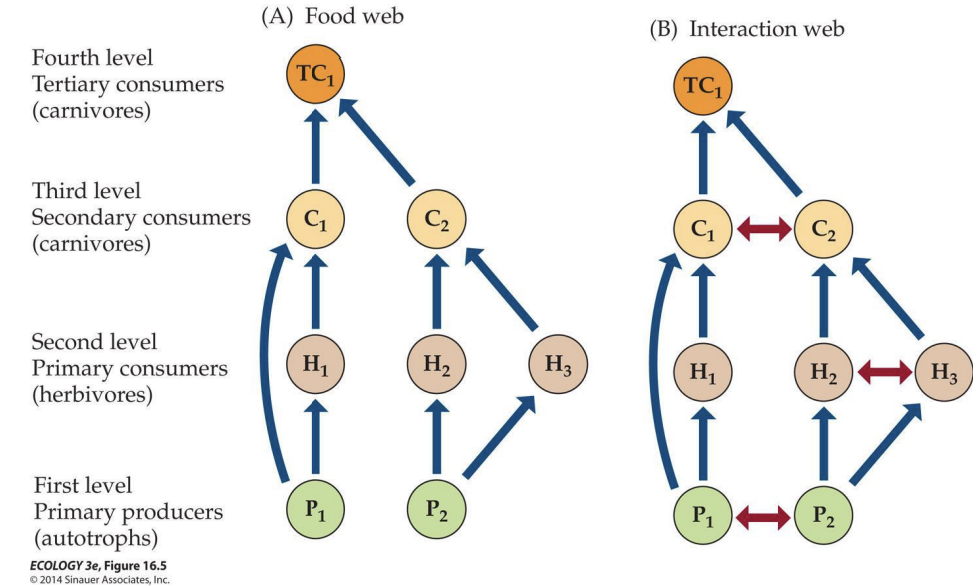
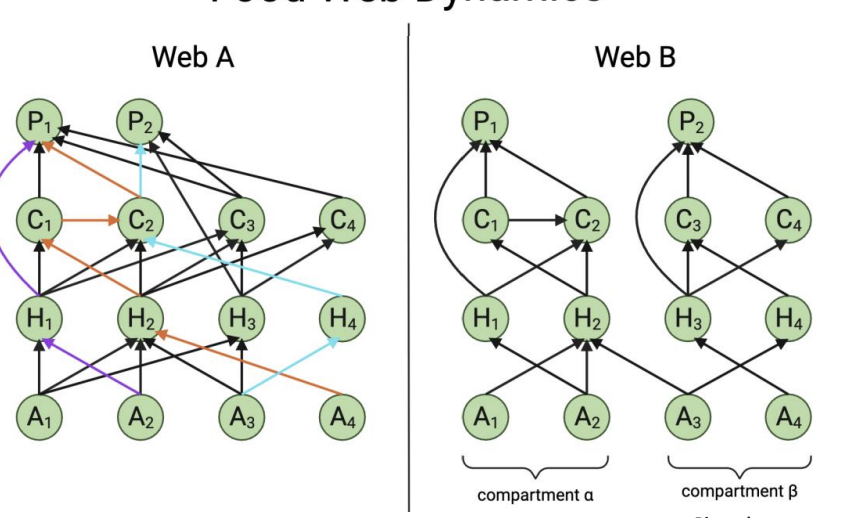
Connectivity and diversity in a food web influence
Connectivity and diversity in a food web influence ecosystem stability and resilience.
• Web A shows a complex, integrated food web, typical of stable ecosystems with high biodiversity.
• Web B shows a simplified, compartmentalized system, where interactions are more isolated.
A keystone species is one that has a ______ on the structure and function of an ecosystem relative to its abundance or biomass. Its presence or absence strongly influences______
disproportionately large impact
species diversity, community composition, and ecosystem stability
sea star - keystone predator
Sea star (Pisaster ochraceus): a keystone predator in intertidal zones; its removal leads to mussel overgrowth and loss of biodiversity
Grey wolf - keystone species
controls herbivore populations in Yellowstone, triggering a trophic cascade that restores vegetation and river systems.
foundation species
is a dominant, abundant species that creates or maintains habitat and supports many other organisms in an ecosystem. It provides physical structure or resources that shape community interactions and environmental conditions.
coral foundation species
builds reef structures that provide shelter and food for thousands of marine species.
kelp foundation species
forms underwater forests supporting fish, invertebrates, and other marine life
mangrove trees foundation species
stabilize coastlines and create nursery habitats for aquatic organisms
keystone vs foundation species - definition
keystone species - an orginism that helps to define an entire ecosystem
foundation species - the species that has a strong role in structuring a community
keystone vs foundation species - term coined by who
keystone species - robert paine
foundation species - paul k dayton
keystone vs foundation species - maintains what
keystone species - biodiversity
foundation species - the strcuture of the ecosystem
keystone vs foundation species - impact on species
keystone species - have a more significant impact on all other species in the ecosystem
foundation species - contribute to the creation and maintenance of a landscape in order to thrive by other soecies
keystone vs foundation species - how does it change ecosystem
keystone species - strongly affect the composition of communities in the ecosystem
foundation species - physically modify the environment, produce and maintain habitats, benefitng other species
keystone vs foundation species - trophic or non trophic
keystone species - trophic and share a common collection of prey and predators
foundation species - non-trophic and do not share a common collection of prey and predators
keystone vs foundation species - examples
keystone species - starfish, seaotters, etc
foundation species - trees in forrest, coral reefs
Ecosystem engineers
Both keystone species and foundation species can be ecosystem engineers, i.e. species that create, modify, maintain, or destroy physical habitat
