AP Statistics Unit 1
1/28
There's no tags or description
Looks like no tags are added yet.
Name | Mastery | Learn | Test | Matching | Spaced |
|---|
No study sessions yet.
29 Terms
What do you need to remember when plotting?
Title
Tick, Tick (x and y axis)
Label, label, label (x and y axis, key for stem-and-leaf plot)
relative frequency
frequency / total
Describing Quantitative Data: C S(4) O C S
Context
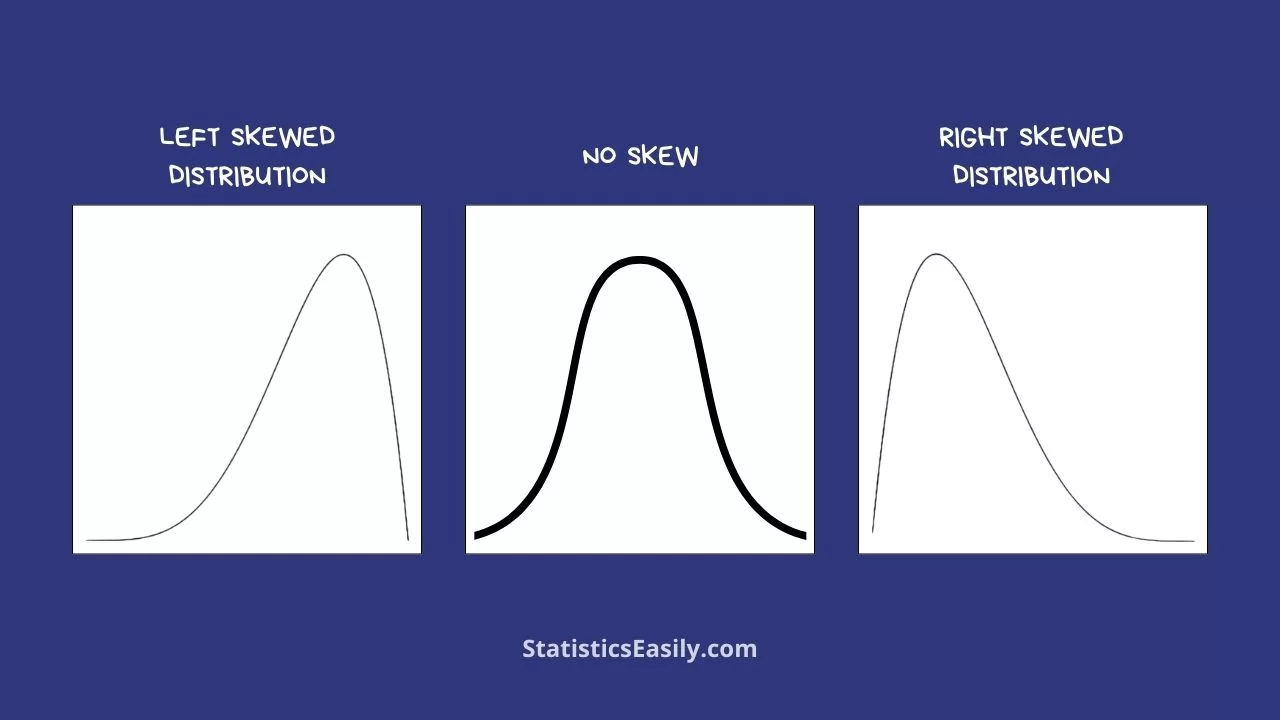
Shape: Skewed left/skewed right/symmetric, uniform, unimodal/bimodal, gaps
Outliers: Unusual data points
Center: Mean (average) or Median (middle value)
Spread: Range, IQR (Q3 – Q1), Standard Deviation
Left-skewed looks like ____, median ____ mean
Right-skewed looks like ____, median _____ mean
How to describe the shape of stemplots? ______
Tail on the left, median > mean
Tail on the right, median < mean
Rotate so stems are on the bottom
3 Measures of center
mean, median, general center
Mean is denoted by ___ for ____ or _____ for ______
μ for population; x̄ for sample
Median position formula
n+1 / 2
3 Measures of spread
range, IQR, standard deviation
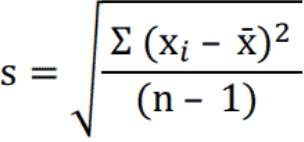
Standard deviation: typical ____ from the ____
What’s the formula? ___
Find the distances from mean for each point, ____ them, ___ them up, divide by _____, and take the ____
distance, mean
square, add, n-1, sq root
Range formula:____ Range is a ____
max-min
number
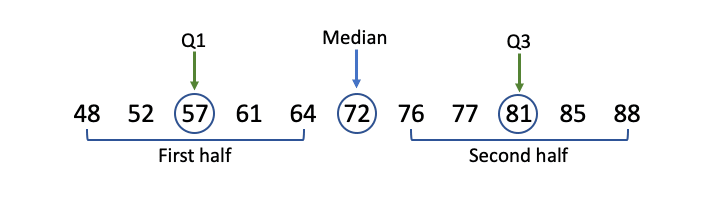
IQR Formula
Q3-Q1
Choosing appropriate measures of center and spread
If the data is fairly symmetric, use the ____ and _____.
If the data is skewed or outliers are present, use the ______ and _____ instead.
mean, standard deviation
median, IQR
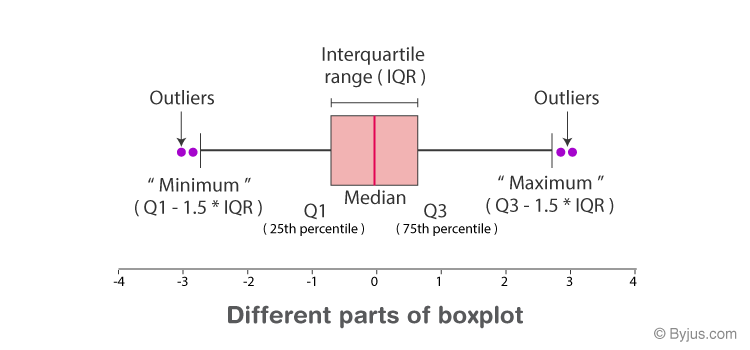
Formulas for outlier boundaries:
Upper limit: ____
Lower limit: ____
Q3 + 1.5xIQR
Q1 - 1.5xIQR
6 Components of a box plot
min, Q1, median, Q3, max, outliers
CSOCS for boxplot
C: context
S: Skew (not modes)
O: dots
C: median
S: IQR
When asked to compare distributions for dotplots, stemplots, histograms, and boxplots
use _____
use _____ language and _____ for each feature
csocs
comparative (eg. less than, greater than, similar), NUMBERS
Linear transformations: adding or multiplying by a constant. Did these change?
SOCS
Addition only affects center and five number summary positions
multiplication affects center and spread, five number summary positions
Quantitative data: Data that is ______. The values have an inherent _____. See if it makes sense to ____ it
Categorical data: Data where values are categories or group labels, which often ____ have an inherent order
numerical, order, average
don’t
6 ways to graph quantitative data
Dotplots
Histograms
Stemplots
Boxplots
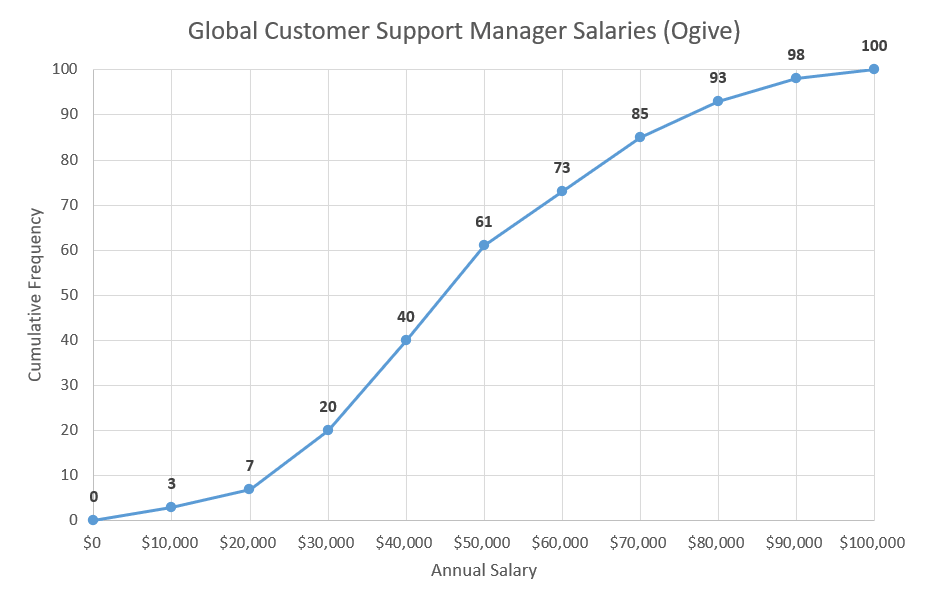
ogive (cumulative relative frequency graph)
timeplot
4 ways to graph categorical data
stacked bar graph
pie chart
bar graph
mosaic plot
3 parts of Describing Categorical Data
Context, relative frequency (%s), modes
Ogive: cumulative relative frequency graph
cumulative relative frequency on y axis
can find Q1, med, Q3 by finding 25%, 50%, and 75% on y-axis
Timeplot
time is on x-axis
collecting data from sample —>
collecting data from population —>
statistic
parameter
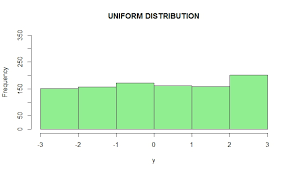
uniform distribution
variance
standard deviation squared
how to draw histogram from boxplot
do 4 equal area rectangles from the quartiles (since each contains 25% of data) then split them up into equal sized bins
don’t forget to do this when making boxplot
find outliers
how to show higher concentration of data in histogram, dotpot, boxplot, ogive, stemplot
taller bins
taller bins
skinnier boxes/quartiles
steeper slope
more leafs