Chapter 6 - Economic Growth, the Financial System, and Business Cycles
1/37
Earn XP
Description and Tags
Textbook + Lecture videos + hs notes
Name | Mastery | Learn | Test | Matching | Spaced | Call with Kai |
|---|
No analytics yet
Send a link to your students to track their progress
38 Terms
Economic Growth
The % increase in an economy’s total output (real GDP) is most appropriate when measuring an economy’s overall productive capacity.
How to measure economic Growth
Per Capita GDP (per person)
Total GDP produced in a country in a given year / Population
Countries with a higher GDP tend to have higher life expectancy and lower infant mortality rates
Growth Rate calculations (formula)
(This method is quicker and is useful during tests):
(Final value / Initial value) –1
Growth Rate of real GDP per capita
The % Change from the previous year
Compound Interest
"Preview" example to average growth rates
Compound interest example
Suppose I put $1000 into a savings account, earning 4% interest per year.
How much will I have after 10 years?
$1000 (1.04)^10 = 100 (1.48)
= $1480
Rule of 70
How many years does it take for real GDP per capita to double?
Formula:
70 / Growth Rate
Rule of 70 - Example
If the growth rate is 3.7%, how many years does it take for real GDP per capita to double?
70 / 3.7 = 18.9 years
What are the sources of growth?
Labour productivity: Y/L
Output per worker
Increasing capital (per labour hour)
Technological improvements
Property rights
Property rights
If a firm is assured that any investments it makes, either in capital stock or in R&D, it is more likely to undertake that spending, knowing it’ll make a profit.
Closed economy
A country that does not trade with other countries and does not allow capital to flow either in or out of its borders
Y = C + I + G
No "NX" term here
What is private saving?
The amount of income households have left after receiving transfer payments, paying taxes, and spending on consumption.
Formula for private saving (Sp)?
Sp = Y + TR − T − C
Where:
Y = Income
TR = Transfer payments
T = Taxes
C = Consumption spending
What is Public saving?
Anything left over once the government has inflows from taxes, made transfer payments and purchased goods and services
Formula for Public saving (Sg)?
Sg = T − TR − G
Where
T = Taxes collected (inflows of income from households)
TR = Transfer payments (outflows to households)
G = Government spending (on goods and services)
Definition of Saving:
S = Sp + Sg
National saving
National Saving = Investment
(S = I)
Surplus Budget
Tax revenue > Government spending + Transfer payments
Flow variables
Deficit Budget
Tax revenue < Government spending + Transfer payments
Flow variables
Balanced Budget
Tax Revenue = Government spending + Transfer payments
Government debt
An accumulation of past deficits
Stock variable
National Income Accounting Identity (Closed economy)
Y = C + I + G
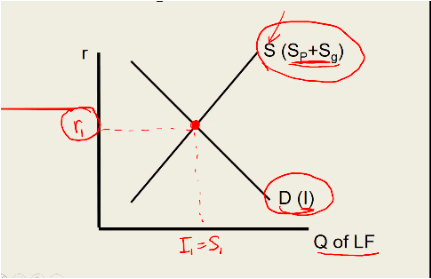
Market for Loanable Funds
Includes the market diagrams model
Supply and demand for loanable funds --> brings savers and borrowers together.
Demand for Loanable Funds
Firms borrow funds in order to invest (purchase new capital goods)
What is the slope of the demand for loanable funds?
Downward sloping
Why is the demand for loanable funds downward sloping?
Higher interest rates → higher borrowing cost → less investment.
Relationship between interest rate (r) and the demand for loanable funds?
Negative relationship.
Higher r → lower investment demand.
Demand for Loanable Funds - Shift factors
When firms need/want to purchase less capital at any given interest rate, demand for LF decreases
Supply of Loanable Funds
Savings made available for borrowing in the financial market by households and the government
Why do households supply loanable funds?
To earn interest on their savings.
What is the slope of the supply of loanable funds?
Upward sloping.
Why is the supply curve upward sloping?
Higher interest rates → more savings → more loanable funds supplied.
Supply of Loanable Funds - Shift factors
When households/governments save MORE, the supply of LF increases.
When households/governments save LESS, the supply of LF decreases.
Does public saving depend on interest rates?
No.
Government saving is independent of interest rates.
Market Diagram
Components:
R = Real interest rates
(Q) = Quantity of loanable funds
S = Savings
Sp = Private savings
Sg = Public saving
I1 = S1 —> Savings = Investment
Potential GDP
The level of real GDP is attained when all firms are producing at capacity.
Capacity ≠ maximum possible output.
Capacity = production using:
normal working hours
a normal workforce
Potential GDP increases when:
Labour force grows
New factories and machines are added
Technology improves labour
Output Gap
% difference between actual GDP and potential GDP (Bank of Canada).
Negative output gap:
Actual GDP < potential GDP
Unused resources, often during recessions
Positive output gap:
Actual GDP > potential GDP
Unsustainable production causes inflation