Analyzing Enzyme Graphs And Diagrams
Gibbs Free Energy Graphs
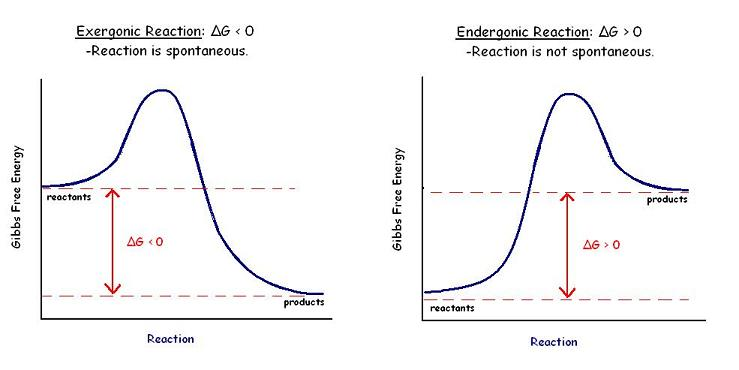
The Gibbs free energy graph shows whether or not a reaction is -- whether it is exergonic or endergonic. %%Therefore, if the reaction goes from higher free energy to lower free energy, there will be a negative ΔG, and the reaction will be spontaneous%%. ==A positive ΔG indicates that the reaction is endergonic, or that it requires energy to go from reactants to products.==
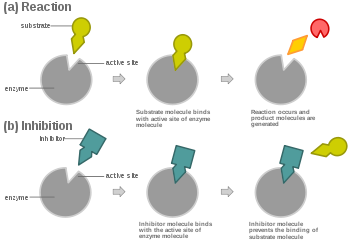
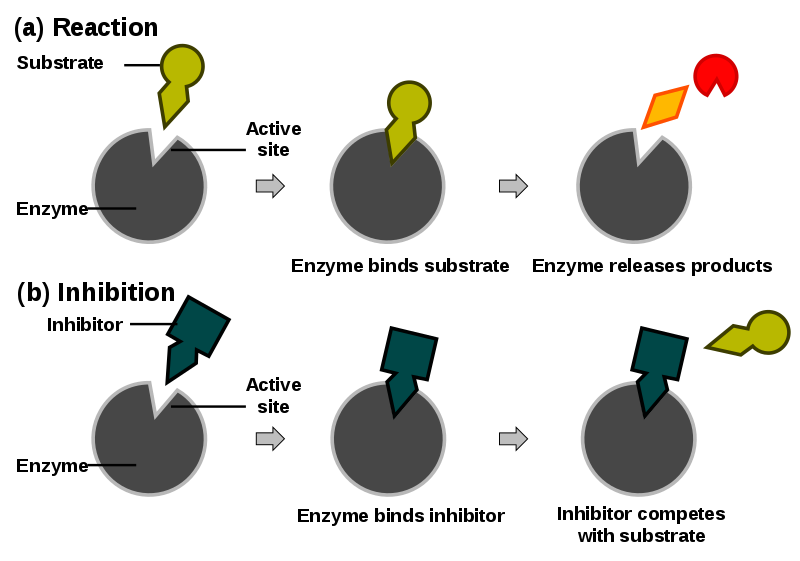
Inhibitor diagrams
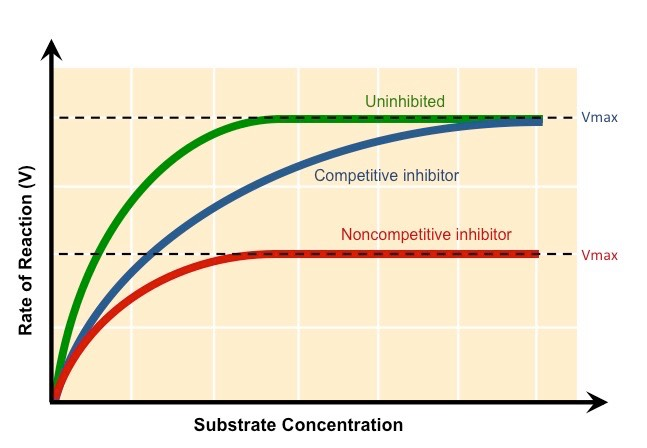
Inhibitor graph analysis
Competitive Inhibitor: %%The rate of reaction is reduced as the inhibitor competes with the substrate,%% Maximum rate can be achieved if substrate levels are high enough
Non-Competitive Inhibitor: , Maximum rate cannot be achieved by raising substrate levels
Temperature Graph
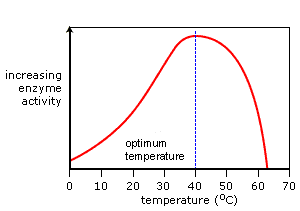
@@As the temperature increases so do the rate of enzyme activity.@@ Optimum activity is reached at the enzyme's optimum temperature. A continued increase in temperature results in a sharp decrease in activity as the enzyme's active site changes shape. It is now denatured.
pH Graph
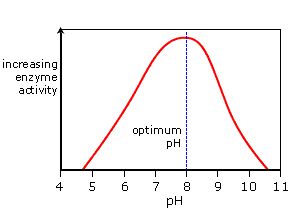
==In the graph above, as the pH increases so do the rate of enzyme activity.== Optimum activity is reached at the enzyme’s optimum pH, pH 8 in this example. A continued increase in pH results in a sharp decrease in activity as the enzyme’s active site changes shape. It is now denatured.
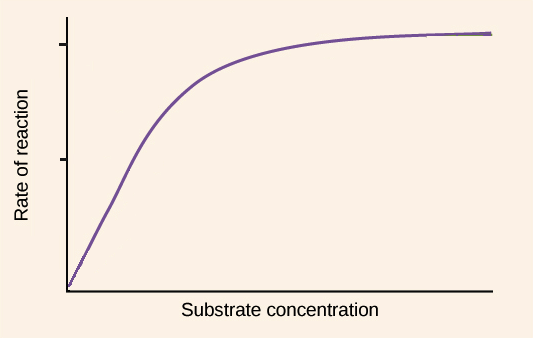
Substrate Graph
^^As the substrate concentration increases so do the rate of enzyme activity.^^ An optimum rate is reached at the enzyme’s optimum substrate concentration. A continued increase in substrate concentration results in the same activity as there are not enough enzyme molecules available to break down the excess substrate molecules.