Analyzing Enzyme Graphs And Diagrams
0.0(0)
Studied by 7 people0%Exam Mastery
Build your Mastery score
Supplemental Materials Call Kai
Card Sorting
1/7
Earn XP
Description and Tags
This flashcard set looks at analyzation of enzyme graphs and their diagrams.
Last updated 3:08 AM on 11/29/22
Name | Mastery | Learn | Test | Matching | Spaced | Call with Kai | Chat |
|---|
No analytics yet
Send a link to your students to track their progress
8 Terms
1
New cards
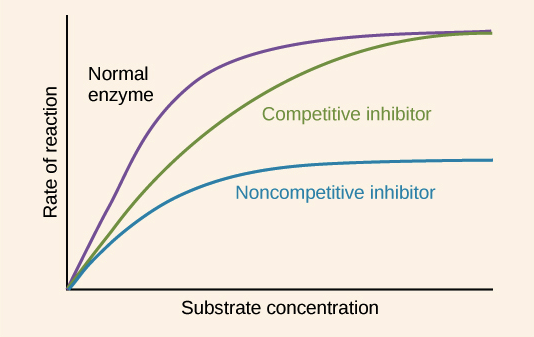
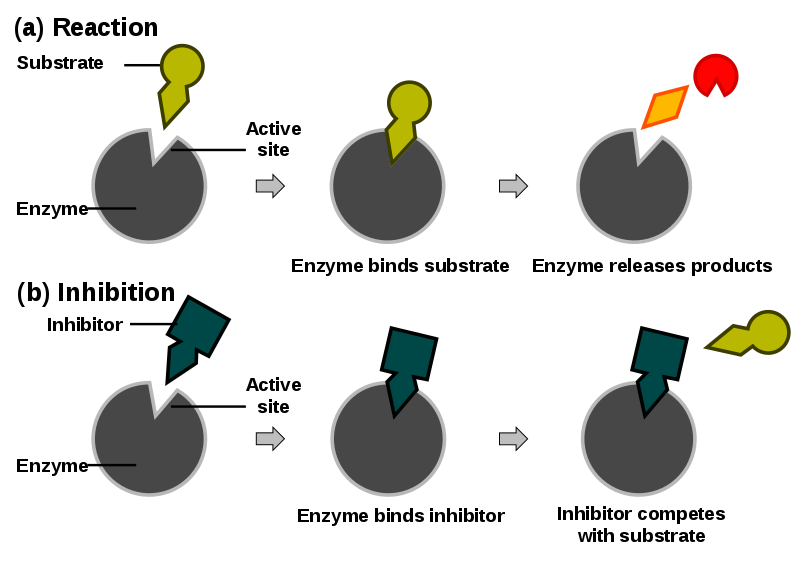
Competitive Inhibitor
The rate of reaction is reduced as the inhibitor competes with the substrate, Maximum rate can be achieved if substrate levels are high enough
2
New cards

Non-Competitive Inhibitor
The rate of reaction is reduced as the enzyme's active site is altered, Maximum rate cannot be achieved by raising substrate levels
3
New cards
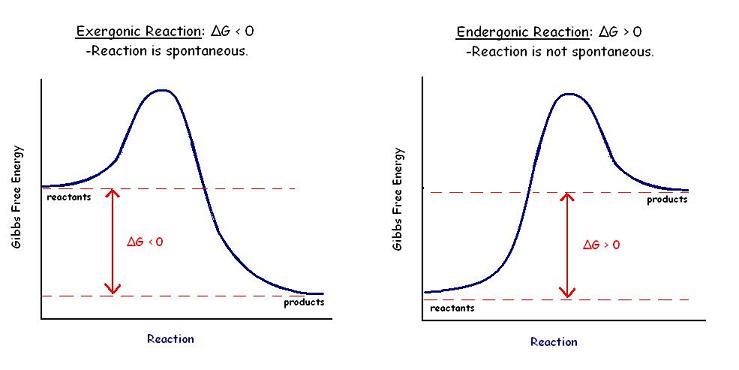
Gibbs Free Energy Graph
The Gibbs free energy graph shows whether or not a reaction is spontaneous-- whether it is exergonic or endergonic. Therefore, if the reaction goes from higher free energy to lower free energy, there will be a negative ΔG, and the reaction will be spontaneous. A positive ΔG indicates that the reaction is endergonic, or that it requires energy to go from reactants to products.
4
New cards
Temperature Graph
As the temperature increases so do the rate of enzyme activity. Optimum activity is reached at the enzyme's optimum temperature. A continued increase in temperature results in a sharp decrease in activity as the enzyme's active site changes shape. It is now denatured.
5
New cards
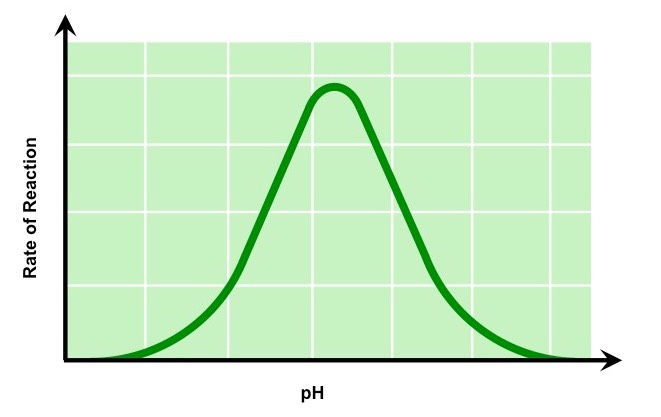
pH Graph
In the graph above, as the pH increases so do the rate of enzyme activity. Optimum activity is reached at the enzyme’s optimum pH, pH 8 in this example. A continued increase in pH results in a sharp decrease in activity as the enzyme’s active site changes shape. It is now denatured.
6
New cards
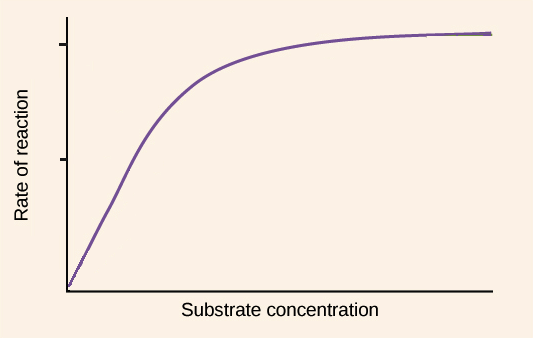
Substrate Graph
As the substrate concentration increases so do the rate of enzyme activity. An optimum rate is reached at the enzyme’s optimum substrate concentration. A continued increase in substrate concentration results in the same activity as there are not enough enzyme molecules available to break down the excess substrate molecules.
7
New cards
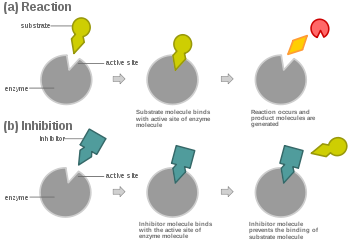
Competitive Inhibitor Diagram
Preventing the substrate
8
New cards
Non Competitive Inhibitor Diagram
Reducing the activity