3-Spatial Data Input and Manipulation
1/45
There's no tags or description
Looks like no tags are added yet.
Name | Mastery | Learn | Test | Matching | Spaced | Call with Kai |
|---|
No analytics yet
Send a link to your students to track their progress
46 Terms
What is spatial data capture?
Spatial data capture is the process of generating new digital spatial data.
-involves direct measurement or analogue to digital conversion
What does vector data capture involve?
key board entry
digitising
field surveying
photogrammetry
LiDAR (light detection and ranging)
What is keyboard entry?
involves obtaining the coordinates of point features from maps, field data or other source document, and typing them into GIS
point features are also called XY events
used when the number of point features in small
What is manual digitising?
manually tracing along boundaries of geographical features from a map or image, while recording the coordinates of the points selected to approximate the boundary or shape of each feature
digitising table and a puck
What is on-screen digitising?
on-screen digitising using scanned paper maps as digital images and then tracing the features on a computer screen
limited by the resolution of the scanned images and may not capture fine details as accurately as manual digitising
Compared to automatic digitising?
automatic digitising converts raster images into vector data using raster-to-vector conversion
highly efficient for handling large datasets
part of a wider push toward automated digital mapping
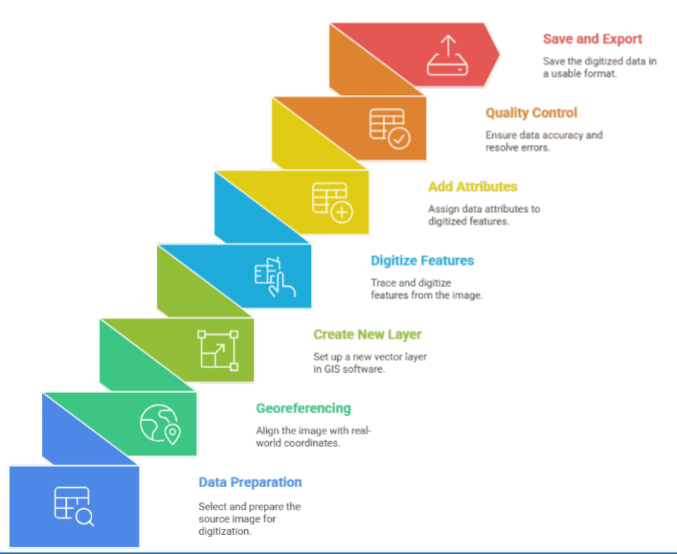
What are the steps in digitising data in GIS?
What is field surveying?
collect spatial data through direct measurements in the field
traditionally surveying methods are used
more recently, total stations and GNSS
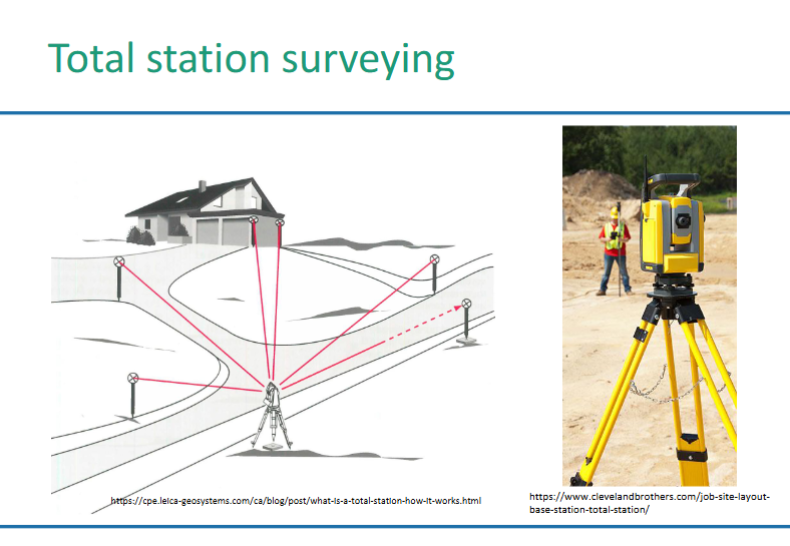
What is total station surveying
Infrared to some kind of receiving station, can work out all angles and distances from that position.
What is global navigation satellite system GNSS?
Satellites broadcast radio signals with location, statuses, and precise time information. GPS radio signal travels at speed of light. GPS device receives signal, and can calculate distance.
provides accurate measurement of a position almost anywhere on the surface of the earth
hand-held GNSS receivers allow data collectors to walk or drive around to collect x,y,z coordinates
GPS global, GLONOSS Russia, Galileo Europe, BeiDou China are 3 main GNSS systems.
Main features of a GNSS:
GPS satellites orbit at 20km above Earth’s in a period of 12 hours in 6 orbital planes
ensures at least 4 satellites are always potentially visible anywhere on earth.
each satellite emits signals in 2-3 frequency bands as radio waves, long wavelength EM radiation which is able to penetrate the atmosphere. At least one of the bands is reserved for military use
low power means arriving signals are not much different from background noise level
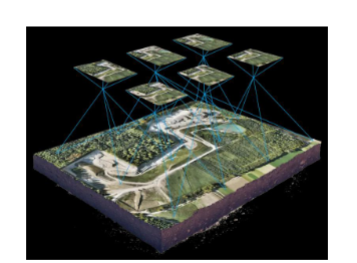
What is photogrammetry?
photogrammetry measures (x,y,z) coordinates of objects using overlapping pairs of aerial photographs (Stereo-pair) taken from different points of view.
What is laser scanning LiDAR?
-LiDAR produces (x,y,z) coordinates for multiple discrete points, called mass points or point clouds.
-Photogrammetry and LiDAR can achieve a vertical accuracy of 10-15cm and horizontal accuracy of 50-100cm
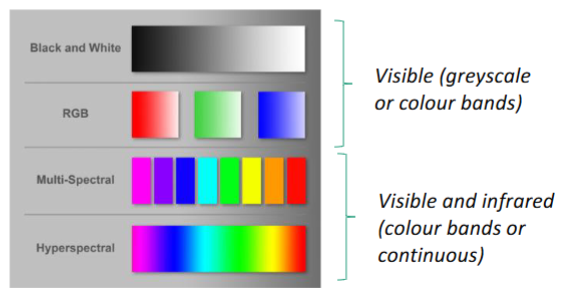
What is raster data capture?
Remotely sensed images, including satellite images, and aerial photographs.
Four main types visible, infrared, multispectral, and hyperspectral.
What is crowdsourcing?
collect spatial data by soliciting contributions from community or general public
involves the use of Internet-enables and location-aware mobile devices to gather location-specific information
disadvantages: possibly skewed data, lack of ownership or confidentiality, loss of expertise
What is spatial data transfer?
Process of converting or translating existing spatial data and importing them into a GIS
import existing spatial data from external sources
may be in different data forms
read directly or translates into a suitable format.
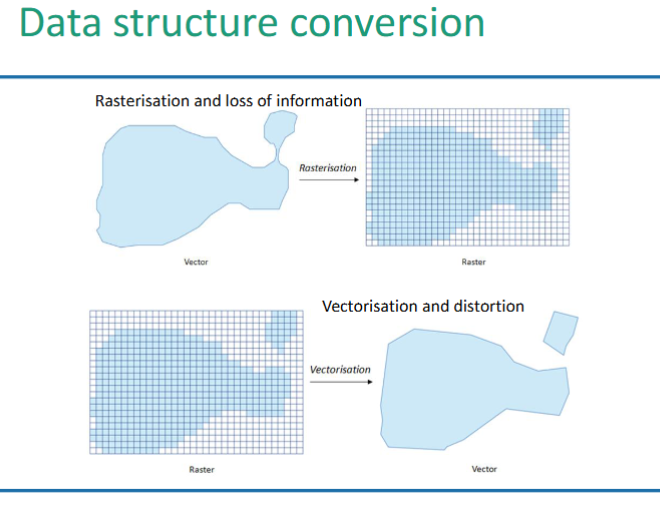
-data structure conversion (raster-to-vector conversion)
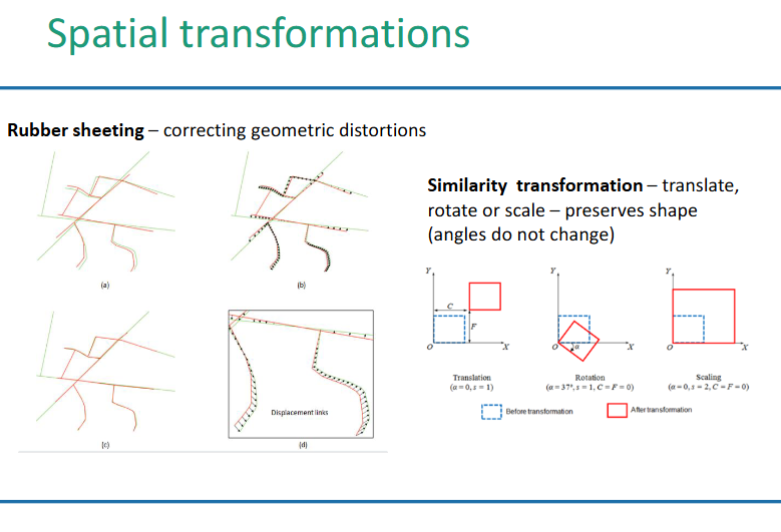
-geometric transformation - rubber sheeting
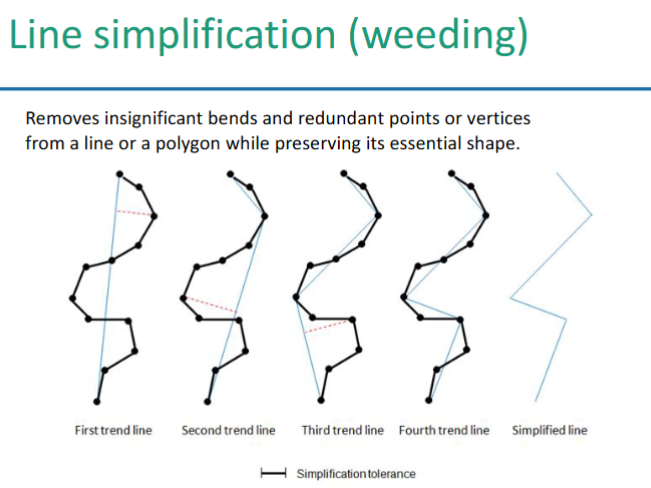
-line simplification
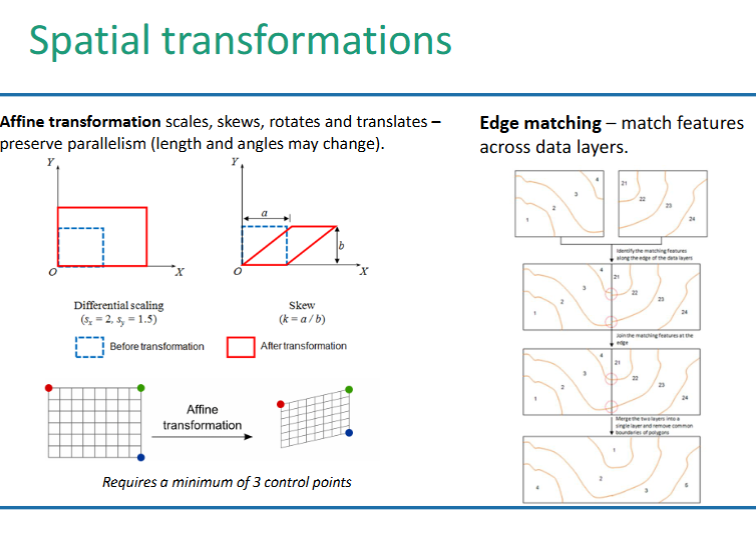
-edge matching
Some common spatial data errors:
data formatting errors, scale, coordinate projection, raster conversion
cartographical generalisation errors
location errors
topological errors
attribute errors
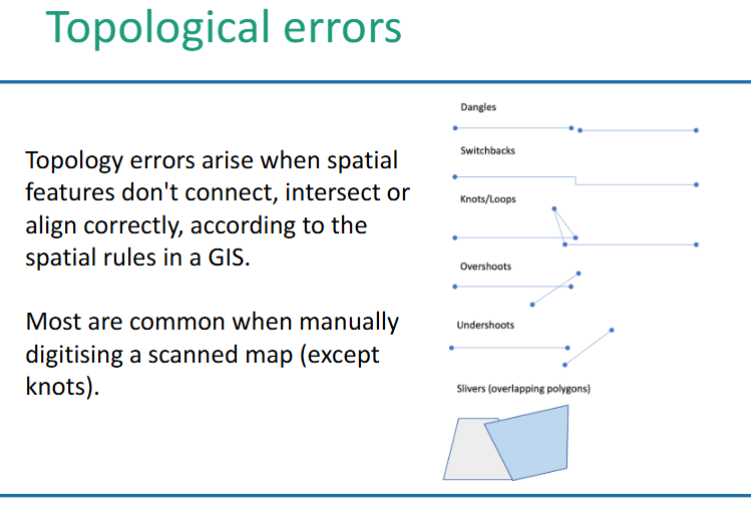
What is topological errors?
What is attribute errors?
attribute data may contain observational or measurement errors, data entry errors or be simply out of date
editing includes adding, deleting or updating attributes associated with features and their values
Number of sites correctly assigned/total
Quiz questions
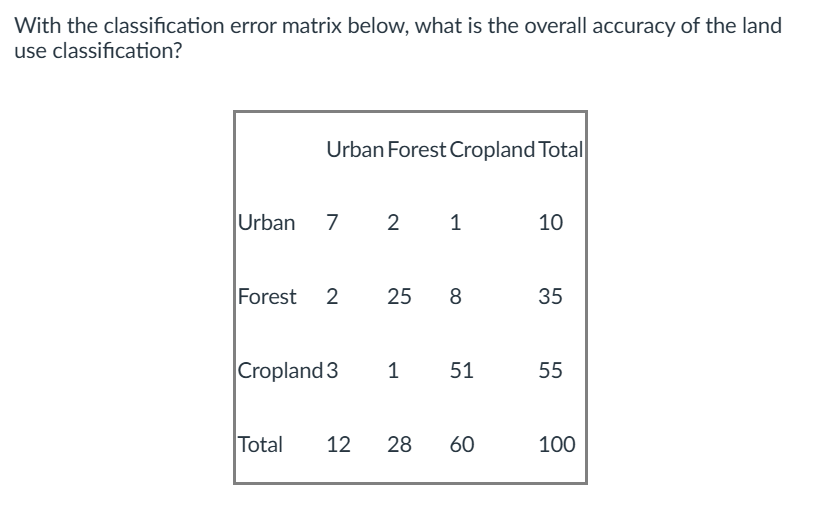
83%
From the table we can see that a total of 7 pixels classified as ‘urban’ were checked against reference data to be urban, Similarly, 25 pixels of 'forest' and 51 pixels of cropland were validated. Adding these up gives 83 pixels validated. As 100 pixels in total were checked, then the answer is 83%.
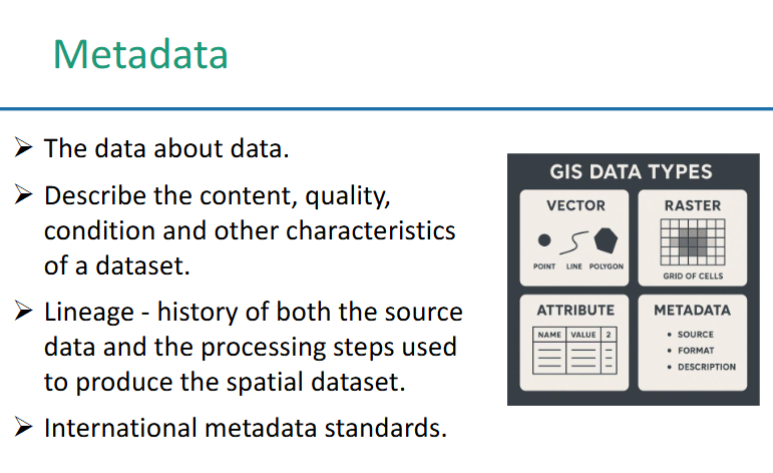
What is the purpose of GIS metadata?
To provide a detailed description of the data, including its title, abstract, and keywords.
Metadata describe the content, quality, condition and other characteristics of a dataset. It has to be detailed, dependable, and well-documented - this is called the three Ds of metadata. It also needs to contain information about the lineage - the history of both the source data and the processing steps used to produce the spatial dataset.
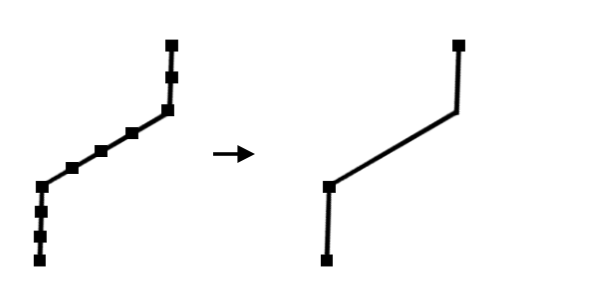
The accuracy of vector data captured through digitising is independent of…
the density of the points selected to approximate the shape of the features.
Manual digitizing involves using tools within GIS software to trace features from georeferenced maps. Typically, a mouse is used to manually trace elements such as roads, boundaries, or rivers, converting them into vector formats like points, lines, or polygons. The example below (right side) shows that if a point is added at every vertex of a line it maintains the accuracy of the shape, it is not necessary to increase the density of points, although many tracing tools in GIS software will automatically add vertices at regular distances as shown on the left image.
Which of the following statements accurately describes limitations of crowdsourced data?
results can be easily skewed based on the crowd being sourced
lack of confidentiality or ownership of an idea
potential to miss the best ideas, talent, or direction and fall short of the goal or purpose
Crowdsourcing, while valuable, has its limitations, including potential biases, lack of confidentiality, and the risk of missing critical insights
Vector to raster conversion may cause loss of information because…
small polygons could be lost.
If a vector polygon is smaller than the resolution (cell size) of the target raster, it may not occupy enough of a cell to be registered. Cells in a raster grid are assigned a value based on method which are either what feature is at the centre of cell, or what covers most area. Small polygons displaced from the centre or representing little of the total are of the cell are therefore likely to be lost during the rasterisation process.
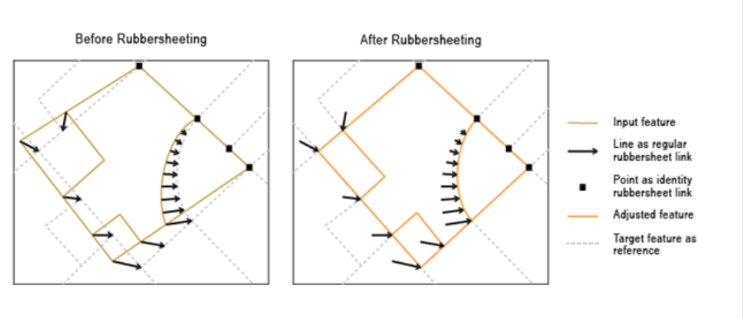
What is rubber sheeting?
geometrically adjusts map features to force a data layer to fit a base map
Rubber sheeting is correcting geometric distortions in a data layer. Geometric distortions often occur in source maps, due to low position accuracy (such as in historical maps), inaccurate georeferencing in map compilation, paper shrinkage caused by atmospheric conditions such as humidity and heat, scale distortion or other causes. Rubber sheeting involves mathematically stretching one data layer (the source layer) to comply with another (the target layer, which is often an accurate base map). It geometrically adjusts map features to force the data layer to fit the base map.
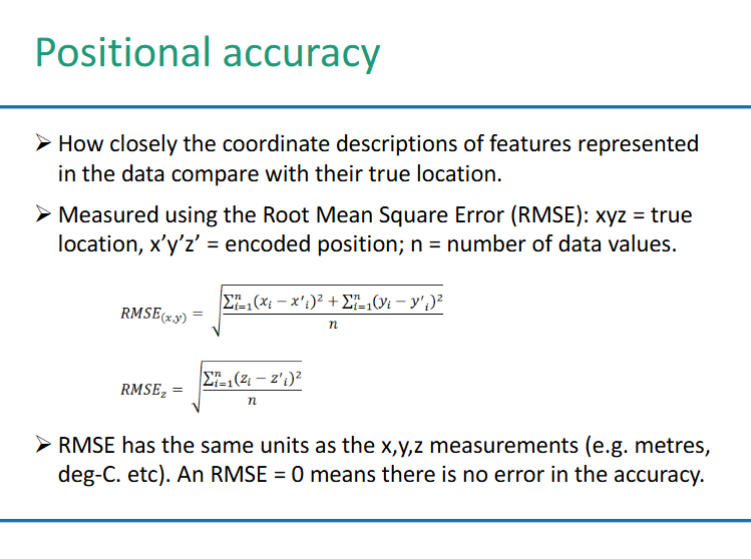
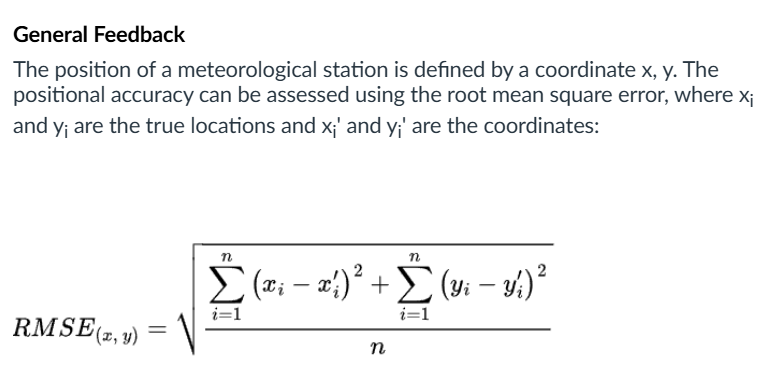
The positional accuracy of the air temperature data recorded at a number of geographically distributed meteorological stations can be assessed using:
RMSE
Georeferencing an image in GIS involves:
mathematically establishing linear or non-linear relationships between image coordinates and real-world coordinates
transforming the image so that each location on the image can be defined in a real-world coordinates
selecting at least four control points
Using an image as a map layer requires a step called georeferencing where locations on the map called control points are marked at specific coordinates and the software stretches (transforms) the image to align the control points with locations on the ground. Usually a minimum of 4 control points are needed, ideally widely spaced across the map area (e.g. ideally at or close to, the four corners)
Vectorisation may…
distort the shape of features
Converting raster data to vector features is called vectorisation. It is a process of converting a raster dataset or scanned image to point, line, or polygon features. The resolution of the input raster data is important for raster-to-vector conversion, as it determines how well the line or area shapes are defined. At a higher resolution, the cells are smaller, and the results of vectorisation will approximate the real shapes more closely. As the resolution gets lower, the cells becomes larger which leads to poorer representation of the shapes after vectorisation and may even result in distorted shapes when compared to the original raster features.
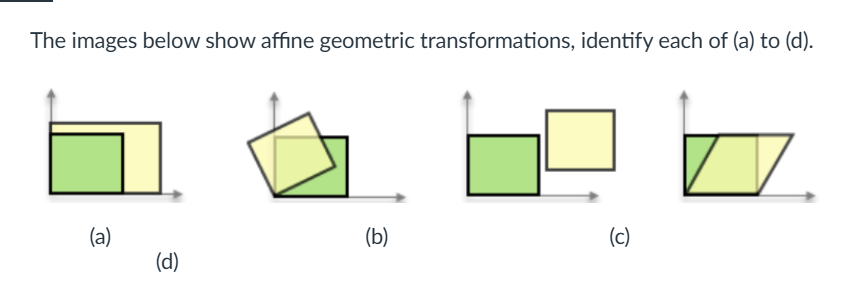
a) scaling
b) rotation
c) translation
d) skew
The positional accuracy of a point feature is associated with…
errors in its recorded xyz coordinates
Positional accuracy is a measure of how closely the coordinate descriptions of features represented in the data compare to their true location. Positional accuracy of a single point feature is defined as the distance between the encoded location and the actual location, usually composed of horizontal (x,y), and vertical (z) accuracy.
Manual digitising is a significant source of errors in spatial data. But which of the following is not typically an error from manual digitising?
Knot, knots are often associated with inexperienced digitisers (human error). As the digitiser becomes more experienced and familiar with the software’s tools, these types of manual errors become rare. GIS software allows users to apply snapping tools during the digitisation process which forces the cursor to automatically connect to existing nodes or lines, this prevents a line from crossing over itself or dangling in a way that would create a loop or knot.
(other options what are errors from manual digitising are undershoot, overshoot, dangles, switchback, silvers)
What is digitising a process of?
converting paper maps or images to digital vector data
Digitisation is the process of converting geographic data into digital form (normally as vector data). It is an important process for GIS as it transforms physical maps and analogue data into digital formats that are easier to manipulate, analyse, and store. Digitisation also protects invaluable historical data and increases their accessibility and usability. Digitising is usually done in one of 3 ways
1) manually using a digitising tablet and a puck (mouse)
2) on-screen digitising where maps are scanned first into digital images and then traced on a computer screen
3) automatically by using raster-to-vector conversion (of scanned maps or remote sensing images) which is good for handling large datasets.
To digitise a paper map, one first needs to establish control points. The control points may be
a) points on soil boundaries
b) road intersections
c) centre points on water bodies
d) points on contour lines
b) Road intersections.
When georeferencing high-accuracy maps, four control points at well-defined places on the map, ideally at the four corners of the mapped area, are needed for accurate georeferencing. While road names change and roads are sometimes moved or removed, road intersections commonly stay stable over time so are good choices for control points, this is unlike natural geographic features which change their shape due to weathering, erosion, flooding, droughts etc.
Direct transfer of spatial data allows …
Direct transfer of spatial data allows the non-native data to be translated on the fly.
If the acquired data are in the format supported by the GIS system, they can be read directly into the system; otherwise, they need to be translated into a compatible form. Direct transfer allows the non-native data to be translated on the fly and displayed with other datasets in the GIS, while the source dataset remains in its original format. However, direct transfer usually does not allow data editing. Moreover, direct transfer is mainly used for importing data in relatively simple formats, more complex data may require specialised translation software, such as the Feature Manipulation Engine in ArcGIS Pro.
True or False: High accuracy implies high precision and vice versa.
False
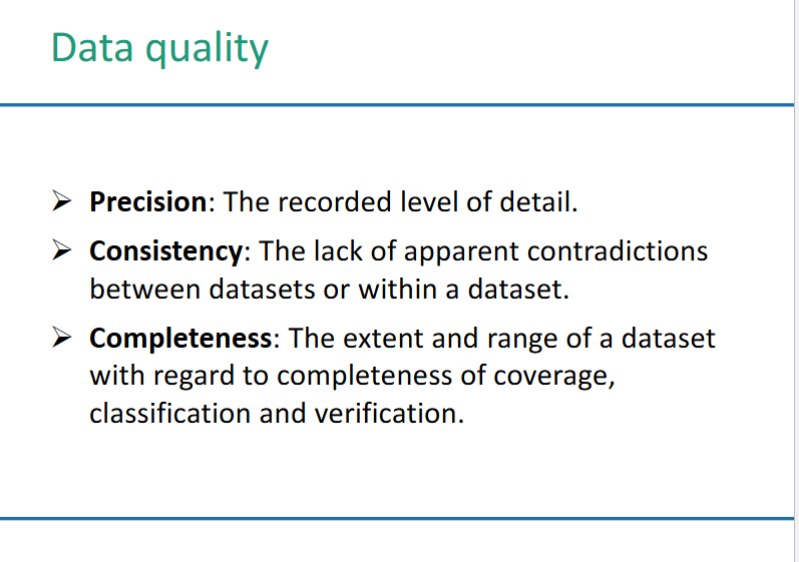
Precision refers to the recorded level of detail, or level of measurement and exactness of description in spatial data. It is important to note that high precision does not indicate high accuracy, or vice versa. Precise data, no matter how carefully measured, may be inaccurate. For example, a wrong reading in a distance measurement made to 0.01metres is very precise but inaccurate.
An affine transformation requires a minimum of…
3 control points.
Transformations are made by using control points which have known x,y, coordinates. These are required to solve transform matrix, the mathematical procedure used to calculate the output coordinates for the new image. For an affine transformation 3 control points are needed, for a similarity transformation 2 control points are required.
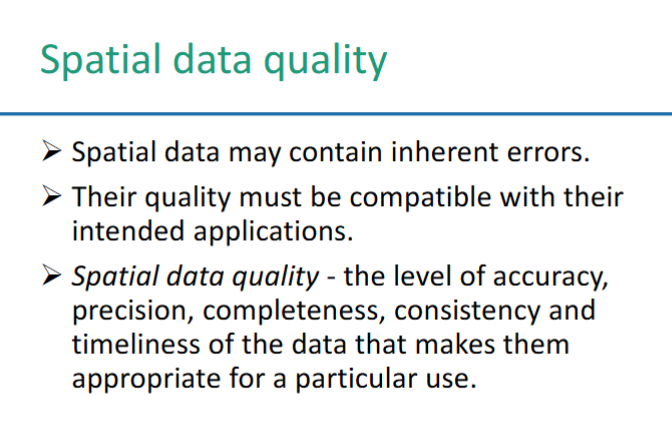
Spatial data accuracy refers to…
How close the spatial data are to a true representation of reality.
Accuracy is a measure of the closeness of the data values to the true values or values accepted as being true. The difference between observed and true values is error. In other words, accuracy is a measure of the degree to which a data value is free from error.
Raster data can be captured…
by means of remote sensing.
Remote sensing data are raster format (imagery). A GNSS provides crucial location data for the images and the raster data can be converted to vector data by digitisation.
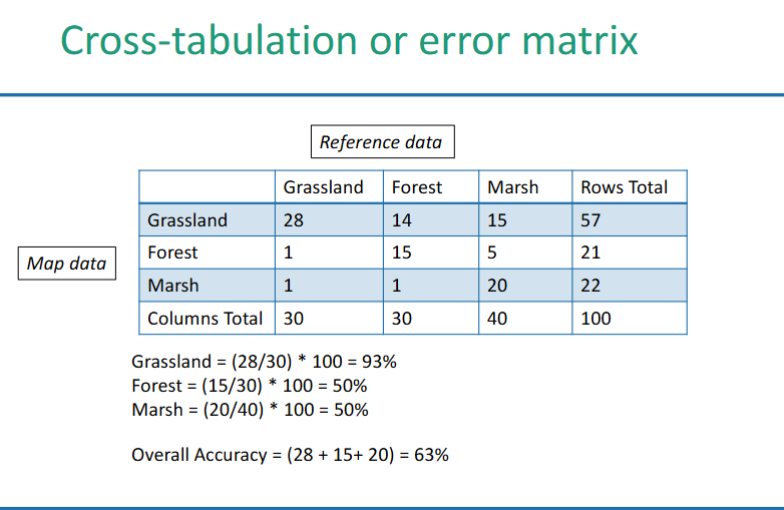
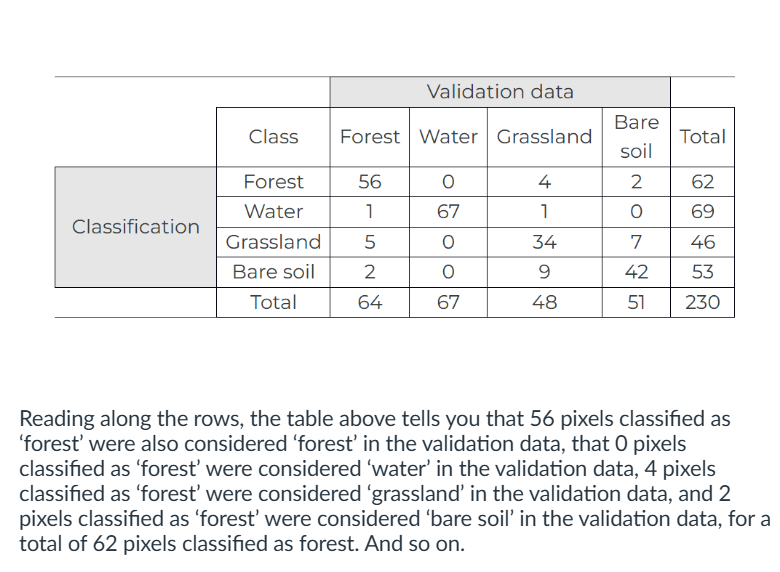
The accuracy of land cover classification on a land lover map can be assessed using…
Cross-tabulation.
Cross-tabulation methods are used to assess the accuracy of the soil map. This involves comparing the actual land cover type (ground truth) with the land cover predicted by the map. The example below illustrates how this works using a cross-tabulation or error matrix (sometimes also called a confusion matrix)
Lineage of a spatial dataset does not describe…
The layout of its source maps.
Data lineage is a record of a dataset’s origin, processing steps and transformations over time. It captures the life cycle of the data from its creation, processing, analysis, and dissemination. It provides a traceable account of how the data have been manipulated and changed.
The quality of data produced from an overlap procedure is…
As good as the worst data input to the process.
It seems obvious that any GIS analysis is limited by the quality of the source datasets, however, it is important to remember that errors in one dataset may be compounded in a GIS project when we need to employ more than one data source. In these types of projects, one error leads to another, propagating its effects on the analysis and affecting the entire project.