End of Year 12 Geography Exam Questions they haven't asked
1/89
There's no tags or description
Looks like no tags are added yet.
Name | Mastery | Learn | Test | Matching | Spaced |
|---|
No study sessions yet.
90 Terms
Describe the Site of New York:
New York City is located on the Atlantic Coastal Plain, predominantly on low-lying, gently undulating land ranging from 0–80m above sea level, with Manhattan averaging 30m ASL. The original settlement was established in lower Manhattan around New York Bay, a deep-water sheltered harbour situated at the convergence of the Hudson and East Rivers, providing excellent conditions for trade, transport, and maritime activity. To the west, the Catskill and Appalachian Mountains rise steeply to over 900m, forming a natural barrier to inland expansion while also functioning as a crucial watershed that supplies around 90% of the city’s water, safeguarded by strict planning controls.
Describe the Situation of New York:
New York City’s situation is defined by its location in the north-eastern coastal region of the United States at 40°42’N, 74°00’W (taken from the Financial District in Manhattan), around 430km north-east of Washington D.C., placing it within a highly developed and influential urban corridor along the Eastern Seaboard. Its proximity to other major political, economic, and cultural centres enhances its strategic importance nationally and globally. The city is exceptionally well connected through a vast mass transit network, with Lower Manhattan serving as a hub where subway lines, major bridges such as the Brooklyn and Manhattan Bridges, tunnels including the Brooklyn-Battery Tunnel, and multiple ferry terminals converge.
Describe the External Morphology of New York:
New York City’s external morphology is multicellular, with a multi-nuclei structure that spans across three major islands—Manhattan, Staten Island, and Long Island—and is organised into five boroughs: Manhattan, Queens, Brooklyn, the Bronx, and Staten Island. Covering an area of 790km², the metropolitan area extends roughly 60km along a northeast–southwest axis, reflecting its expansive urban footprint. Manhattan, in particular, demonstrates a distinctive linear morphology, stretching approximately 22km north to south, which exemplifies the city’s elongated form shaped by its island geography.
Explain the Demographic characteristics of New York:
Age:
New York City has a median age of 38, reflecting an ageing population similar to other developed cities. About 20% of residents are under 18 and 16% are over 65. Manhattan has the highest share of working-aged adults (48% aged 15–44), as professionals, singles, and dual-income households are drawn to its jobs and lifestyle. In contrast, the Bronx and Brooklyn have younger populations, with more residents under 18 (24% and 22%), linked to larger families and lower housing costs in less affluent areas. Queens and Staten Island are older, both with median ages of 40 and higher proportions over 65, as outer boroughs appeal to families and retirees seeking quieter lifestyles and larger homes. The city overall is ageing, with the median age projected to reach 40 by 2030.
Gender:
In New York, females slightly outnumber males (52% to 48%), largely due to higher female life expectancy. While males dominate younger cohorts (0–19), women outnumber men from age 20 onwards. Borough differences reflect socioeconomic and neighbourhood structures: Manhattan and Brooklyn have more women in older and single-person households, while the Bronx shows higher female populations linked to public housing and social services. In contrast, areas like the Financial District have more men due to male-dominated industries such as finance and technology. Overall, NYC mirrors the global trend of women outliving men, with older age groups increasingly female.
Socioeconomic:
Socioeconomic conditions in New York City vary sharply between affluent and disadvantaged areas. Manhattan and parts of Brooklyn are the wealthiest, with high land values, elite housing, and jobs in finance, real estate, and tech. In 2020, Manhattan households earned a median weekly income of $2,485, with 63% holding a bachelor’s degree or higher. In 2023, neighbourhoods like Hudson Yards and Tribeca had median housing price of approximately $3.9million, reflecting high demand driven by location, transport access, and open space. In contrast, the Bronx and parts of East Harlem face entrenched poverty, unemployment, and crime, with 48% of Bronx neighbourhoods persistently in poverty. Public housing is concentrated in areas such as the South West and Central West Bronx, and educational inequality reinforces disadvantage, with only 17% of residents in high-poverty neighbourhoods holding a degree compared to 41% citywide.
Cultural Distribution:
New York City is one of the world’s most ethnically diverse cities, with nearly 40% of residents foreign-born and over 200 languages spoken. Its population reflects migration from the Caribbean, Latin America, Europe, and Asia, creating a cultural “melting pot.” Major groups include White (31%), Hispanic (28%), African American (20%), and Asian (16%). This diversity has formed cultural enclaves such as Chinatown and Little Italy in Manhattan, Brighton Beach in Brooklyn, and Astoria and Flushing in Queens. Queens is the most diverse borough, with almost half of residents born overseas, while Staten Island is the least, with a majority White population. Cultural clustering provides support networks and helps preserve traditions, making diversity a defining feature of the city.
Explain the Scope of a Challenge of New York - Transportation:
Definition:
The movement of people and goods from one place to another and the various means by which each movement is accomplished.
Scope:
The scope of New York City’s transportation challenge is large & city-wide, impacting all five boroughs due to the mismatch between infrastructure & demand. With the longest average commute time in the United States at 40 minutes, many New Yorkers face crowded, unreliable, & lengthy journeys to & from work. The scale of the system highlights the extent of the issue: the subway, which is 60% underground, operates 36 lines & carried 760 million riders in 2021, while buses transported 312 million passengers. More than half of residents do not own a car, meaning there is heavy reliance on public transport, although 22% of commuters still drive alone, contributing to congestion. The challenge is further complicated by the involvement of multiple managing authorities, including the Department of Transport and the Metropolitan Transit Authority, making transportation a complex, city-wide urban issue rather than a localised one.
Explain a Planning Strategy for a Challenge Facing New York - Select Bus Service:
Explanation of the Select Bus Service as a Planning Strategy used to Address the Challenge:
The Select Bus Service (SBS) is a strategic planning initiative under New York City’s OneNYC 2050 framework aimed at addressing the city’s transportation challenges by improving efficiency, reliability, & sustainability. Launched in 2008, SBS buses operate on exclusive lanes & serve high-ridership routes, primarily in Manhattan, with the network now expanded to 20 lines across all five boroughs. The service incorporates features designed to reduce travel time, including three-door entry points, pre-boarding ticket collection stations, & widely spaced stops, resulting in an estimated 20% faster customer travel times. Since implementation, approximately 62 kilometres of SBS lanes have been installed, saving commuters a total of 8 million hours of travel time. By prioritising rapid & efficient bus transit, SBS contributes to OneNYC 2050’s goal of reducing car reliance, enhancing mobility, & making the city more sustainable for the future.
Explain a Planning Strategy that Addresses an Urban Challenge on New York - Urban Freight:
Urban Freight Initiatives (UFI) is a strategic planning approach by the NYC Department of Transportation aimed at reducing congestion and improving the efficiency of freight movement across the city. A central project is the Off-Hour Delivery program, a voluntary and incentivised initiative that encourages businesses in congested areas, such as Lower and Midtown Manhattan, to shift deliveries to off-peak hours between 7 pm and 6 am, offering annual incentives of $1,000–$4,000 per business. Since its launch in 2010, over 900 businesses, including Whole Foods in Union Square, have participated, resulting in less congested streets and increased productivity for carriers like FedEx and Freightcenter, which have shifted up to 50 daily delivery routes, saving over AU$4 million per year. The city aims to move 62,000 trucks to off-peak hours by 2040, which could reduce Manhattan congestion by 6% if 10% of freight receivers participate. UFI also promotes environmental sustainability by encouraging the use of electric trucks or vehicles using cleaner fuels, reducing emissions from idling trucks that currently contribute to the $900 million annual economic cost of congestion.
Explain the Scope of a Challenge of New York - Housing:
Definition:
The provision & availability of affordable housing, which is defined by the New York Housing Authority housing affordability as housing that costs roughly one third or less of a household’s income & is regulated in such a way that rent cannot increase drastically overtime.
Scope:
New York City’s housing affordability challenge is city-wide, affecting all five boroughs, though its severity varies by location & income levels. With 67% of households renting (far above the national average of 36%) the majority of New Yorkers are exposed to rising rental costs, & more than 50% of rental households are considered rent-burdened, with over 30% severely rent-burdened, spending more than half their income on housing. The Bronx, where 80% of residents rent & median incomes are the lowest at AU$64,480 per year, faces the highest demand for government housing support. At the same time, median house prices across the city are extremely high, averaging AU$1.2 million in 2025, with Manhattan being the least affordable at AU$1.8 million. This means that the income needed to purchase a home is nearly double the city’s median household income of AU$102,000. With 13.6% of New Yorkers living below the poverty line, the shortage of affordable housing is a widespread & entrenched issue, only partially mitigated by government programs that provide affordable housing for just 1 in 17 residents.
Explain a Planning Strategy of a Challenge facing New York - Housing - Urban Redevelopment Projects:
Urban redevelopment projects under OneNYC 2050 address New York’s housing challenge by transforming underutilised brownfield sites into mixed-use neighbourhoods with substantial affordable housing. For example, Hunters Point South in Queens converted 12 hectares of abandoned industrial land into 5,000 housing units, 60% permanently affordable for low- and middle-income families, alongside a 4.5-hectare park, retail spaces, and two schools. By 2026, the city aims to create or preserve 300,000 affordable units, 40% for very low-income earners. These projects increase housing supply, and revitalise neglected areas.
Explain a Planning Strategy of a Challenge facing New York - Housing - ShareNYC:
ShareNYC, launched by NYC’s Department of Housing Preservation & Development in 2018, tackles housing affordability through shared co-living units for extremely low- to moderate-income residents. By 2025, it will provide 310 units across Manhattan & Brooklyn, including a 10-storey, 36-unit building in East Harlem for those leaving shelters. With average rents of $1,800 (far below the city median of $6,000) these developments include gyms, coworking spaces, & are close to public transport. The program increases affordable housing, supports vulnerable populations, & enhances urban liveability.
Define - Urban Sprawl:
Urban sprawl is the most prevalent challenge facing metropolitan Perth. It can be defined as the outward spread of typically low density residential & urban development on the periphery of urban areas.
Explain the Impacts of one Urban Challenge - Urban Sprawl:
Urban sprawl in Perth has significant environmental, economic, & social impacts. Environmentally, extensive greenfield development has cleared 6,800 ha of vegetation in the past decade, leaving only 29% of original Swan Coastal Plain vegetation & threatening ecosystems like Banksia woodlands & wetlands. This habitat loss places pressure on endangered species such as Carnaby’s Black Cockatoo, whose population has declined 50% in 45 years, with only 10–30% of its native food sources remaining. Economically, greenfield housing costs the state around $150,390 per lot (triple the $55,830 cost of infill) diverting funds from inner-city upgrades & costing $2.5 billion annually in congestion. Fringe suburbs also face high car dependency, with Northwest corridor residents recording 68.7% private vehicle commutes & households owning an average of 2.4 cars compared to 1.2 in inner areas. Socially, sprawl contributes to reduced amenity & inequality: Perth’s canopy cover sits at 20%, below the national capital average of 30%, despite trees boosting property values by $17,000 & reducing urban heat. Moreover, service delivery often lags behind housing development, as seen in Ellenbrook (est. 1995), where 50,000 residents have waited decades for the delayed Morley–Ellenbrook rail line, reinforcing disconnection & socio-spatial disadvantage.
Explain two Planning Strategies used to Address the Challenge of Urban Sprawl:
Urban Infill:
Urban Infill refers to new urban developments that are sited on under-utilised land that is vacant or undeveloped. It is typically sited on land within an existing community & is surrounded by other types of development. Urban infill strategies like the Perth and Peel @ 3.5 million metropolitan framework address the urban challenge of sprawl, promoting a planning strategy focused on creating a compact, connected, & consolidated city through urban infill. It sets a target for 47% of new dwellings to be built within existing urban areas by 2050, compared to the current 30%, reducing reliance on fringe greenfield developments. This is achieved through redeveloping under-utilised land, often brownfield sites, into higher-density, mixed-use communities that integrate housing, services, & transport. DevelopmentWA, for instance, is transforming over 2,600 hectares into transit-oriented developments (TODs) such as Montario Quarter (Shenton Park) & Claremont on the Park, which combine medium to high-density living with green spaces, retail, & proximity to public transport. These projects diversify housing options for demographics like families, retirees, & DINKs, while fostering sustainable “urban village” environments that reduce car dependency & limit further environmental damage caused by outward sprawl.
Urban Consolidation:
Urban Consolidation aims to increase residential density, particularly in the established residential zone & slow down the rate of urban sprawl on the fringes of the city. Urban consolidation is a key planning strategy used to limit Perth’s urban sprawl by increasing residential density within the established residential zone rather than expanding onto the urban fringe. It involves rezoning & subdividing larger blocks, such as the traditional quarter-acre (≈900m²), into smaller lots that allow for multiple dwellings including duplexes, townhouses, & apartments. Local councils such as the City of Stirling & City of Melville have actively pursued this through density coding, with suburbs like Scarborough, Innaloo, Palmyra, & Alfred Cove now supporting densities of R40 (40 dwellings per hectare) or higher, while parts of Subiaco reach R80 (80 dwellings per hectare). Fieldwork observations in Melville highlight the scale of this change, where a section of land between Marmion Street & Challenger Place was transformed from single homes into 43 dwellings of low to medium density. By encouraging redevelopment of existing suburbs, urban consolidation provides more housing choice, makes efficient use of existing infrastructure, & slows the outward spread of the metropolitan area.
Evaluate the Two Planning Strategies used to Address the Challenge of Urban Sprawl using the Concept of Sustainability & Liveability:
Urban Infill:
Urban infill is an effective strategy to address Perth’s urban sprawl as it supports sustainability, defined as meeting the needs of current & future generations through simultaneous environmental, social, & economic improvements, while enhancing liveability, the quality of space & the built environment linked to health, safety, & access to services. Environmentally, infill reduces sprawl-driven deforestation, with land clearing on Perth’s fringes decreasing by 40% since 2010, while projects like Montario Quarter retain 26% open space & canopy cover above city averages, mitigating the urban heat island effect & protecting biodiversity. Socially, infill fosters diverse, vibrant “urban villages” with mixed housing densities, community events (e.g., sunset yoga, planting days), & shared facilities that build cohesion & improve safety through passive surveillance, though affordability is an issue, with Montario land averaging $4000/m² compared to $1000/m² in fringe suburbs like Baldivis. Economically, infill is cost-efficient, costing governments around $55,830 per lot versus $150,390 for greenfield developments, while integrating retail & services to support local economies; however, higher densities can pressure infrastructure, as seen in the $68 million expansion of Bob Hawke College. In terms of liveability, infill improves air quality by reducing car dependency through transit-oriented developments like Claremont on the Park, less than 100m from a train station, while access to healthcare, green space, & fitness facilities enhance health & quality of life. Overall, urban infill balances sustainability & liveability reducing environmental impacts, improving community well-being, & delivering economic efficiencies, despite affordability & infrastructure capacity challenges.
Urban Consolidation:
Urban consolidation is a key strategy to address urban sprawl by increasing residential density within established suburbs, aligning with sustainability, defined as meeting the needs of current & future generations through environmental, social, & economic improvement, & enhancing liveability, the quality of the built environment linked to health, safety, & access to services. Socially, consolidation diversifies housing stock, attracting a broad demographic from retirees to young professionals, while residents in areas such as Challenger Place benefit from proximity to 24 primary schools, 9 high schools, & aged care facilities, reducing isolation. However, higher densities also fuel neighbourhood disputes, with complaints to the WA Citizens Advice Bureau rising from 20 to 2,000 annually in six years. Environmentally, consolidation reduces the 900 hectares of bushland cleared annually on Perth’s fringes, protecting species like the black cockatoo, yet can also reduce canopy cover (already just 16%, the lowest of any Australian capital) exacerbating urban heat, prompting councils to regulate tree removal. Economically, it is cost-efficient (lots in consolidated areas are up to three times cheaper to service than greenfields) while boosting local businesses, as seen in Scarborough’s revitalised shopping strips & Melville’s 396% rise in house prices between 1990 & 2020. Yet, this has reduced affordability, pushing lower-income residents to outer suburbs. From a liveability perspective, consolidated areas often have superior transport, such as frequent bus links from Challenger Place to Fremantle & Booragoon, improving mobility, reducing car dependency, & enhancing air quality, though rising property values & shrinking backyard space pose challenges for families. Overall, urban consolidation strongly advances sustainability & liveability goals, but requires careful management to balance affordability, community cohesion, & environmental protection.
Discuss the Views of Two Stakeholder Groups Related to the Challenge of Urban Sprawl:
Department of Planning, Lands & Heritage:
The Department of Planning, Lands and Heritage (DPLH) is a key stakeholder (a group of people who are affected by an issue & may contribute to the decision making & planning process) in addressing the challenge of urban sprawl. Environmentally, the department highlights that sprawl consumes around 900 hectares of land annually, contributing to biodiversity loss, with up to 70% of the Swan Coastal Plain (on which Perth is located) already cleared of native vegetation. Socially, sprawl reduces liveability by limiting access to key services & infrastructure, creating long commutes, & contributing to physical & mental health issues for residents in outer suburbs. Economically, the DPLH favours urban consolidation & infill development because they are more cost-effective than greenfield expansion, costing approximately $55,000 per infill lot compared to $150,000 per greenfield lot for the provision of services such as transport, power, & education. This position is reflected in the state government’s Perth and Peel @ 3.5 million plan, which seeks to build a compact, consolidated, & connected city that can support both current & future generations. Overall, the department views curbing urban sprawl through consolidation as essential to balancing sustainability, liveability, & economic efficiency.
Western Australian Tree Canopy Advocates:
The Western Australian Tree Canopy Advocates (WATCA) is a community-driven stakeholder group (a group of people who are affected by an issue & may contribute to the decision making & planning process) established to address the environmental impacts of urban sprawl, particularly the loss of tree canopy in Perth’s suburbs. Representing 25,000 members across 30 local councils, WATCA is highly concerned that Perth has the lowest canopy cover of any Australian capital city at just 16%, which threatens biodiversity & climate regulation. Sub-groups such as the Melville Tree Canopy Advocates highlight the issue at the local scale, opposing the removal of trees in suburbs like Melville & Booragoon where canopy cover sits at 17%, & noting that more than 50% of trees lie on private land, making them vulnerable to removal during urban infill & consolidation developments. To counteract this, they support initiatives such as the City of Melville’s “Trees on your Land” project, which promotes a tree registry, resident support for pruning & maintenance, & development designs that incorporate existing trees where possible. WATCA’s position is that while infill development may reduce sprawl, it should not come at the expense of tree canopy, as trees are essential for biodiversity, community wellbeing, & the mitigation of urban heat island effects.
Explain the Scope of one Urban Challenge - Water Supply:
Definition:
The challenge of water supply occurs when the amount of potable (drinking) water available is less than the amount required to sustain current use, leading to a water shortage. Perth is one city that is experiencing water scarcity.
Scope:
Perth’s water supply represents a complex urban challenge, spanning environmental, infrastructural, social, & economic dimensions, all intensified by population growth & climate change. Managed by the Water Corporation through the Integrated Water Supply Scheme (IWSS), the system provides over 2 million people across Perth, the Goldfields, farming regions, & parts of the southwest with 309 billion litres of water annually. Historically reliant on dams, the city now increasingly depends on desalinated water, groundwater, & groundwater replenishment, as declining streamflow & a projected 15% decrease in winter rainfall by 2030 reduce dam reliability. Groundwater alone accounts for up to 70% of urban water use, particularly for gardens, lawns, & parks, with many households accessing garden bores up to 20 metres deep. Despite a 20% reduction in per capita water use since 2001, daily consumption remains high at 250–300 litres per person, making Perth one of Australia’s highest water-consuming cities. With the population expected to reach 3.5 million by 2050, water infrastructure demands will need to double, necessitating expanded desalination, groundwater replenishment schemes, smart metering, & public education campaigns, highlighting the critical, multifaceted scope of water supply as an urban challenge in Perth.
Explain the Causes of one Urban Challenge - Water Supply:
Definition:
The challenge of water supply occurs when the amount of potable (drinking) water available is less than the amount required to sustain current use, leading to a water shortage. Perth is one city that is experiencing water scarcity.
Causes:
Perth’s urban water supply challenge is primarily driven by the combined impacts of climate change & rapid population growth, which strain both supply & demand. Climate change has altered weather patterns in the southwest, resulting in a 20% decline in annual rainfall since the 1970s & an 80% reduction in streamflow into dams, while average temperatures have risen by 1.4°C since 1910, increasing evaporation & reducing stored water reliability. This has made traditional surface water sources increasingly unreliable, necessitating greater reliance on groundwater & desalination. Simultaneously, Perth’s population is projected to reach 3.5 million by 2050, increasing water demand by an estimated 238 billion litres annually, equivalent to five additional Kwinana desalination plants. Urban sprawl & low-density housing exacerbate the issue, with approximately 75% of residents living in detached homes averaging 399m², leading to high outdoor water use through lawns, gardens, & irrigation systems, including garden bores that heavily draw on groundwater. Despite a 20% reduction in per capita consumption since 2001, daily use remains high at 250–300 litres per person. These factors, coupled with the financial & logistical challenges of expanding water infrastructure to meet growing demand while coping with decreasing supply, make Perth’s water supply a complex & pressing urban challenge.
Explain the Impacts of one Urban Challenge - Water Supply:
Definition:
The challenge of water supply occurs when the amount of potable (drinking) water available is less than the amount required to sustain current use, leading to a water shortage. Perth is one city that is experiencing water scarcity.
Impacts:
The urban water supply challenge in Perth has significant environmental, economic, & social impacts. Environmentally, over-extraction of groundwater from the Gnangara system has lowered aquifer levels by around 3.5 metres since 1979, resulting in the loss of 1,000 gigalitres, degradation of wetlands such as Perry Lakes, habitat loss for species, & stress on Banksia woodlands & native trees valued at $100 million, while desalination projects contribute to land clearing & brine discharge affecting marine ecosystems. Economically, the challenge imposes rising costs on households, with tiered water pricing ranging from $1.82–$4.55 per kilolitre & water bills expected to rise by up to 50% in the next decade, while major infrastructure projects such as the Kwinana ($387 million) & Alkimos ($1.4 billion) desalination plants require significant government investment, although they generate jobs & stimulate the WA economy. Socially, residents must adapt to water restrictions & behavioural changes that reduce household & garden aesthetics, yet there is general public acceptance of alternative water sources like desalination & groundwater replenishment, with careful planning ensuring minimal community disruption & protection of cultural & recreational spaces. Collectively, these impacts illustrate the multifaceted consequences of Perth’s water supply challenge on the city’s sustainability, liveability, & economic stability.
Explain Two Planning Strategies used to Address the Challenge of Water Supply:
Desalination:
Desalination is a key adaptation strategy adopted by the WA state government to secure Perth’s water supply in response to declining rainfall & reduced dam inflows caused by climate change. Using reverse osmosis, seawater is pressurised through fine membranes to remove salt, bacteria, & other impurities, producing potable water while returning concentrated brine to the ocean. Perth currently operates two large-scale desalination plants: the Perth Seawater Desalination Plant in Kwinana (opened in 2006), which supplies around 20% of the city’s water, & the Southern Seawater Desalination Plant in Binningup (opened in 2011), which provides about 30%. Together, these plants meet nearly half of Perth’s water demand & are powered using renewable energy sources such as wind & solar, reducing their carbon footprint. A third facility, the Alkimos Seawater Desalination Plant, is under construction & expected to deliver 100 billion litres annually by 2028. This strategy ensures a climate-independent, reliable water source to support population growth & long-term urban sustainability.
Water Recycling:
Water recycling is a central strategy in Perth’s water planning, designed to reduce dependence on rainfall & groundwater while creating a sustainable, climate-resilient supply. The Water Corporation currently treats over 460 million litres of wastewater daily at major treatment plants, with increasing volumes being reused for irrigation, industry, wetlands, &, critically, groundwater replenishment. The Kwinana Water Reclamation Plant, established in 2004, supplies high-quality recycled water to local industries, reducing demand on potable supplies, while the Beenyup Advanced Water Recycling Plant recharges up to 14 billion litres annually into deep aquifers such as the Leederville and Yarragadee. This process uses advanced treatment including ultrafiltration, reverse osmosis, & ultraviolet disinfection to ensure water safety before reinjection. Expansions like Beenyup’s Stage 2 upgrade, which doubled its recharge capacity, demonstrate the city’s commitment to scaling up recycling, alongside the state government’s target to recycle 30% of wastewater by 2030. By diversifying sources & reinvesting treated wastewater into natural systems, Perth’s recycling strategy reduces pressure on dams & aquifers, supports population growth, & strengthens long-term water security.
Evaluate the Two Planning Strategies used to Address the Challenge of Water Supply using the Concept of Sustainability & Liveability:
Desalination:
Desalination is a key planning strategy addressing Perth’s declining rainfall & dam inflows, delivering a climate-independent water supply that underpins sustainability & liveability. Environmentally, it reduces pressure on ecosystems such as wetlands & bushland, protecting biodiversity including the endangered Carnaby’s Cockatoo, while groundwater replenishment sustains regional habitats. However, it is energy-intensive & produces brine discharge, though the Water Corporation is transitioning to 100% renewable power by 2035 & employs constant monitoring & engineered outflow systems to mitigate risks. Economically, desalination is costly (Perth’s first plant cost $387 million to construct & adds ~$44 annually to household bills) but boosts employment, supports industry growth, & secures supply to prevent severe price shocks. Socially, desalination is widely accepted, with plants sited away from residential areas (e.g., Alkimos’ sand dune buffer) to minimise disruption while safeguarding natural & cultural assets. In terms of liveability, it enhances quality of life by preserving green spaces & reducing amenity impacts, stabilises the cost of living through long-term planning & renewable energy purchases, & secures health outcomes by providing pathogen-free water even during events such as algal blooms. Overall, desalination balances high economic & environmental trade-offs with strong social & liveability benefits, making it a vital though imperfect strategy for Perth’s long-term water security.
Water Recycling:
Water recycling is a key planning strategy addressing Perth’s declining rainfall by providing a climate-resilient, sustainable water source that supports both sustainability & liveability. Environmentally, recycling reduces pressure on finite surface & groundwater supplies while preventing pollutants from entering fragile ecosystems; projects like the Beenyup Advanced Water Recycling Plant recharge up to 14 billion litres annually into deep aquifers, with Perth’s sandy soils providing additional natural filtration. Economically, it creates a valuable, cost-effective resource by reducing the need for expensive new supplies & avoiding environmental remediation costs, while scalable plants such as Alkimos (20–160 million litres/day) accommodate population growth without major long-term expense. Socially, recycling enhances resilience by securing safe, rainfall-independent supply, supported through public engagement under the Water Forever plan, & by minimising odour & land-use conflicts through careful siting. In terms of liveability, it sustains quality of life by maintaining wetlands & waterways like Loch McNess & Perry Lakes, valued for recreation & cultural identity, stabilises the cost of living by reducing reliance on costly emergency water measures, & protects health by providing pathogen-free water that undergoes ultrafiltration, reverse osmosis, & aquifer recharge before reuse. Overall, while site-specific limits exist, water recycling delivers strong long-term sustainability & liveability benefits, making it a vital pillar of Perth’s water security strategy.
Discuss the Views of Two Stakeholder Groups Related to the Challenge of Water Supply:
The Water Corporation:
The Water Corporation, as WA’s main water provider, views the challenge of water supply through the lens of long-term sustainability, cost efficiency, & public trust. It prioritises local, climate-resilient solutions such as desalination & groundwater replenishment over large-scale transfers from the Kimberley, which it regards as environmentally & economically unsustainable. As a stakeholder, it emphasises conservation & demand management, targeting a 15% reduction in per-person water use by 2030, while also balancing the need to keep household costs affordable—despite desalination adding around $44 annually to bills. Its investment in projects like the Alkimos Seawater Desalination Plant reflects a commitment to securing supply for Perth’s growing population, but with attention to social & environmental impacts by siting plants away from residential areas, using renewable energy to reach net zero emissions by 2035, and implementing careful outflow monitoring to protect marine ecosystems. Overall, the Water Corporation’s perspective is shaped by its dual responsibility to guarantee water security for over 2 million residents while maintaining community support and minimising environmental trade-offs.
The Department of Fisheries in WA:
The Department of Fisheries views Perth’s urban water supply challenge primarily through the lens of marine ecosystem protection, as desalination plants pose risks to fisheries and biodiversity. Its key concern is the brine discharge produced by reverse osmosis, which raises salinity & lowers oxygen levels, threatening sensitive breeding grounds & migratory pathways for fish in areas such as Cockburn Sound. To manage this, the department conducts regular water quality sampling near discharge sites & collaborates with the Water Corporation & Environmental Protection Authority (EPA) to implement monitoring, enforce compliance, & develop mitigation strategies. As a stakeholder, its position balances recognition of desalination as a vital climate-resilient water source with advocacy for strict environmental safeguards to ensure the long-term health of WA’s fisheries & marine habitats, which are economically, ecologically, & socially valuable.
Define - Site:
Site characteristics refer to the physical features of the landscape on which the feature is built upon including altitude, landforms, drainage, vegetation & soils.
Define - Situations:
Situation characteristics refer to the relative location of a settlement, in particular with the surrounding region & include, latitude & longitude, distance & direction from a significant place, or the position along a major transport link.
Define - External Morphology:
The overall shape & extent of an urban area.
Define - Internal Morphology:
The layout of land uses & urban functions within a city.
Define - Demographics:
Demographics refer to the characteristics of a population, such as age, gender, cultural background, & socioeconomic status, which is often measured through indicators such as income, occupation, home ownership, & education. These characteristics are valuable to urban planners & government agencies as they inform strategies for managing city growth & addressing the specific needs of the population.
Describe the Situation of Perth:
The situation of Perth refers to its relative location within the surrounding region and its connectivity to key transport links. Perth is located on the southwest coast of Western Australia, with its central business district (CBD) positioned at approximately 31°05′S latitude and 115°51′E longitude. The CBD acts as a central node, converging major transport routes including the Great Eastern Highway, Albany Highway, and the Kwinana Freeway, facilitating movement within the metropolitan area and beyond. Perth is one of the most isolated cities in the world, situated 2,700 km west of Adelaide and approximately 180 km north of Bunbury, and is closer to Singapore than to the nation’s capital, Canberra. Its position on the coast and along these major transport links has influenced its growth, accessibility, and regional significance despite its geographic isolation.
Describe the External Morphology of Perth:
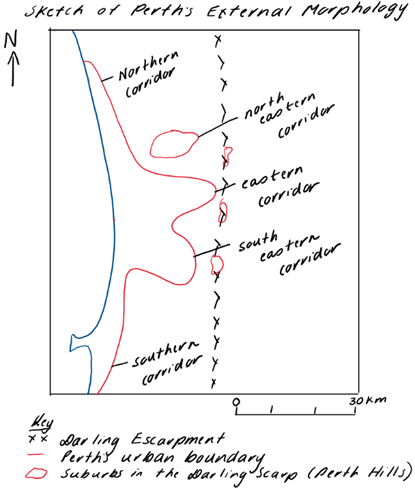
Perth’s external morphology refers to the overall shape, extent, & pattern of its urban development. The city can be described as semi-stellate, gradually becoming more rectangular over time, covering an area of approximately 1,600 km². The metropolitan area stretches roughly 120 km from north to south along the coastline, from Yanchep in the north to Singleton in the south, with the majority of development situated on the Swan Coastal Plain along a north–south axis, extending about 30 km inland & bounded by the Darling Escarpment. Perth’s urban form is centred around the Swan-Canning River, from which four major corridors of development extend: north to Joondalup, east to Midland, south-east to Armadale, & south to Rockingham. A fifth corridor is emerging to the north-east towards the satellite suburb of Ellenbrook. Minor pockets of development also occur on the Darling Escarpment in suburbs such as Roleystone, Kalamunda, & Lesmurdie, reflecting the influence of topography on urban expansion.
Describe the Internal Morphology:
Internal Morphology:
Internal morphology refers to the layout of land uses and urban functions within a city. It is the study of the internal arrangement and change of an urban place (settlement) over time. Perth’s internal arrangement of land use patterns is characterised by eight major functional zones: the Central Business District (CBD), Inner Mixed Zone (IMZ), Established Residential Zone (ERZ), Newer Growth Zone (NGZ), Outer Business District (OBD), Rural–Urban Fringe (RUF), Industrial Zone, and Special Purpose Areas.
1) Central Business District:
Perth’s Central Business District (CBD), located on the northern banks of the Swan River about 17 km upstream, is bordered by the Mitchell Freeway, East Perth, the Esplanade, and Wellington Street. Serving as the city’s commercial, administrative, retail, & residential hub, it features a compact, dynamic grid layout with streets such as St Georges Terrace, Adelaide Terrace, William Street, & Hay Street. Highly accessible, the CBD connects via seven train lines, including the Airport & Mandurah lines. It has the city’s highest land values, with commercial space starting at $500 per square metre, & high-rise buildings dominate due to intensive land use. The daytime population reaches approximately 150,000, compared to around 30,000 residents (2024). Key features include pedestrian malls, historic sites like the Perth City Link, Elizabeth Quay, government institutions, & corporate head offices, cementing its role as Perth’s centre for commerce, finance, & business
2) Inner Mixed Zone:
The Inner Mixed Zone (IMZ) of Perth includes older inner-city suburbs fringing the CBD, such as East Perth, Northbridge, Highgate, & West Perth, originally early residential areas. It is a transitional zone with a semi-intensive, heterogeneous mix of land uses, including warehouses, factories, restaurants, offices, apartments, & transport terminals. The zone has high accessibility & channels commuter traffic to the CBD, though congestion is common, e.g., Thomas Street in West Perth. Many buildings have changed function, with old houses converted to restaurants, studios, or medical surgeries along Colin & Richardson Streets (West Perth) & Churchill Avenue (Subiaco). Processes of invasion & succession are evident, such as James Street in Northbridge becoming an entertainment precinct. Some areas show urban blight, with decaying properties due to delayed upgrades pending redevelopment.
3) Established Residential Zone:
The Established Residential Zone of Perth includes older inner & middle suburbs beyond the CBD, such as Cottesloe, Dalkeith, & Peppermint Grove. It is the largest & most space-extensive functional zone, dominated by housing with a dormitory function, showing diverse styles & densities. Streets feature well-established vegetation, with tree canopy cover of 20–30%, while higher-density apartments & townhouses cluster near the city, coastal areas, or universities for higher rental returns. Infrastructure is well-developed, including schools, shopping centres, health services, libraries, & recreational facilities. Housing quality & cost vary by location, with affluent areas near the coast, rivers, & city, & cheaper suburbs inland or near industrial zones. Urban consolidation & infill increase density in suburbs such as Melville, Scarborough, Wembley, Como, & Tuart Hill. Major redevelopment includes Perry Lakes, Subi Centro, & PMH & Shenton Park Hospital sites.
4) Newer Growth Zone:
The Newer Growth Zone (NGZ) of Perth includes recently developed suburbs beyond the Established Residential Zone, often near the rural–urban fringe, such as Baldivis, Ellenbrook, Aubin Grove, Hammond Park, Iluka, Burns Beach, Jindalee, Butler, and Treeby. Dominated by modern, off-the-plan housing, it is often homogenous, with average block sizes of 400 m² and typical single-storey, four-bedroom, two-bathroom homes that attract younger families due to affordability. Streets and gardens are less established, with tree canopy cover as low as 5%. Land use competition is low, and poor accessibility and limited public transport mean house prices are often below the Perth median of $780,000 (May 2025). Vacant land is reserved for future schools, shopping centres, and recreation, while approximately 90% of trips rely on private cars.
5) Outer Business District:
Outer Business Districts (OBDs) in Perth operate outside the CBD & are dispersed along major transport routes, such as Albany Highway. They consist of diverse commercial & retail activities, ranging from small clusters of shops or shopping plazas to large suburban shopping complexes, reflecting a hierarchy of OBDs. While multifunctional, they primarily focus on retail & are highly accessible due to proximity to main roads, highways, & public transport. Some OBDs show evidence of agglomeration, where similar businesses cluster together, such as Homebase centres or car yards, which often form linear “ribbon” patterns along major roads. Claremont Quarter is an example of a smaller, well-serviced OBD catering to retail & commercial needs.
6). Industrial Zone:
The Industrial Zone of Perth is a space-extensive area dispersed throughout the metropolitan region & can be classified as light, medium, or heavy industry. Heavy industry is capital-intensive, produces large or refined goods such as oil & alumina, & is located further from the CBD, for example, Kwinana, 40 km south of Perth. Light industry is less capital-intensive, consumer-oriented, & often involves small-scale manufacturing, such as timber, tiles, or plumbing supplies, with examples including O’Connor & Myaree. Industrial buildings & infrastructure occupy large areas, reflecting the space requirements of manufacturing & storage. Medium industries occupy intermediate locations & scales. The zone’s distribution reflects the need to separate heavy, polluting industries from residential areas while maintaining access to transport networks for raw materials & goods.
7) Special Purpose Zone:
Special Purpose Zones (SPZs) in Perth are areas that cannot be classified into standard land use functions & are unevenly dispersed across the city. They are often “one of a kind” & space-extensive, serving specific functions such as education facilities, prisons, waste disposal centres, airports, recreational areas, cemeteries, health campuses & hospitals, & parks or reserves. Examples include major hospitals like Fiona Stanley & Perth Children’s Hospital, Perth Airport, & Kwinana Waste Disposal Centre. SPZs are strategically located to balance accessibility & safety, separating potentially disruptive functions like waste disposal or prisons from residential areas while maintaining proximity to transport & infrastructure networks. Their distribution reflects the city’s functional requirements & ensures specialised services are accessible across Perth.
8). Rural Urban Fringe:
The Rural Urban Fringe (RUF) of Perth is a transitional zone on the city’s outer edge, between built-up areas & rural countryside. It contains a mixture of land uses with no dominant function, including intensive agriculture – market gardens in Wanneroo & Spearwood, vineyards & wineries in Guildford & the Swan Valley (e.g., Sandalford Wines, Duckstein), horse studs, nurseries, strawberry farms, & floriculture. Hobby farms on estates of 5+ acres are common in Bedfordale, Mundaring, Forrestdale, & Byford. Residential development is expanding through invasion & succession, with new housing estates & subdivisions. Sport & recreation facilities, including golf courses, horse riding centres, speedways, prisons, & nature reserves, are scattered throughout. Low land-use competition & affordable land attract these space-extensive functions, but rapid housing encroachment can cause conflict with undesirable activities, such as dog kennels, poultry farms, & rubbish tips.
Define the Processes of Urban Sprawl:
Refers to the outward spread of typically low density residential & urban development on the periphery of urban areas.
Define the Process of Invasion & Succession:
Invasion refers to the gradual invasion of one land use type into an area dominated by a different land use. Succession has occurred when the invading land use has almost completely transformed the land use in that particular area.
Define the Process of Renewal:
The rehabilitation of urban areas, by regeneration, replacement, repair or renovation, in accordance with comprehensive plans, typically larger scale redevelopment projects, usually initiated by government.
Define the Process of Land Use Planning:
Planning policies & regulations that play an important role in shaping the land uses & characteristics of urban & rural places. Land use planning includes land use zoning, transport planning, grouping of compatible land uses, creation of buffer zones between incompatible land uses, determining residential densities, renewal project & planning for future growth.
Define the Process of Land Use Competition:
The competition that occurs between different land use functions when more than one land use can benefit from a particular location. This competition increases the land value & usually the land use that can deliver the highest return on investment will locate in that particular area. For example, the CBD of a city is usually the most accessible & therefore desirable & the most expensive.
Define the Process of Inertia:
Resistance to movement; for example, factories that would benefit from changing location but instead decisions are made to keep them where they are located.
Define the Process of Agglomeration:
A group of similar, but not necessarily the same, land uses that locate in the same area in order to benefit from common infrastructure and each other’s operation.
Define - Urbanisation
The proportion of a population living in urban areas of a region or country.
Define - Urban Growth:
An increase in the number of people living in urban places
Define - Urban Place:
The ABS identifies urban places in Australia as having population clusters over 1000 people
Define - Rural Place:
The ABS identifies rural places in Australia as having population clusters under 1000 people.
Define - Liveability:
The quality of space and the built environment. The concept of liveability has been linked to a range of factors; for example, quality of life, health, sense of safety, access to services.
Define - Rural to Urban Drift/Migration:
The physical movement of people from rural, or countryside, areas to urban centres, such as cities, due to factors like better economic opportunities, higher wages, increased job availability, more extensive educational institutions, and perceived better quality of life.
Define - Demographics:
Refers to the characteristics of a population, such as age, gender, cultural backgrounds and socio-economic status (often measured by indicators of income, occupation, home ownership, education).
Define - Spatial Distribution:
The arrangement of geographical phenomena or activities across the Earth’s surface.
Define - Pull Factors (Centripetal):
Pull (centripetal) factors attracts people to urban areas including greater access to higher education (such as universities & TAFE), specialised healthcare, more diverse employment opportunities, better infrastructure, & increased social connectivity.
Define - Push Factors (Centrifugal):
Push (centrifugal) factors drive people away from rural areas including the impacts of climate change (e.g., frequent droughts or floods), loss of rural jobs due to technological advances, poor infrastructure, lack of access to services such as healthcare & education, & remoteness.
Describe the Historical, Cultural & Environmental Factors that have Contributed to the Spatial Distribution of Urban and Rural Places in Australia:
Historical Factors:
The historical development of Australia has significantly shaped the spatial distribution of urban & rural places. British colonisation in the late 1700s & early 1800s established key urban settlements such as Sydney, Hobart, Melbourne, Brisbane, Adelaide & Perth, chosen for their strategic coastal locations with access to freshwater, rivers, & deep harbours. These cities quickly became ports & trade hubs, anchoring population growth along the coast. The introduction of commercial agriculture during the Industrial Revolution further encouraged settlement close to capital cities where fertile land & proximity to ports allowed the export of goods, as seen in the Swan Valley near Perth. Historical events such as the 19th-century gold rushes in Victoria, New South Wales & Western Australia also drove population growth in those regions, while pastoral expansion pushed settlement into inland areas, though these remained sparsely populated due to harsh conditions. Following Federation in 1901, cities consolidated as centres of politics, administration, finance & industry, reinforcing the centralisation of the population in urban places along the coast.
Cultural Factors:
Cultural influences have also shaped the uneven distribution of Australia’s rural & urban places. Australians are predominantly urban dwellers, with over 90% living in cities, drawn by centripetal (pull) factors such as employment, higher education, health services, & recreational opportunities. Migrants, who mostly originate from urban areas, also settle in major cities like Sydney, Melbourne & Perth, contributing to their multicultural growth. For example, British migrants often prefer coastal suburbs such as Rockingham & Mindarie in Perth. Culturally, Australians value a coastal lifestyle & outdoor living, reinforcing urban & rural settlement along the eastern seaboard & the south-west coast of WA. This has created linear settlement patterns, such as the corridor between Perth & Busselton, & contributed to the popularity of ‘sea-change’ destinations like Byron Bay & Margaret River. Additionally, tourism & lifestyle industries have supported the growth of smaller, specialised urban places such as Dunsborough, while mining towns such as Paraburdoo reflect cultural & economic adaptations to regional opportunities.
Environmental Factors:
Environmental conditions remain the most decisive influence on spatial distribution across Australia. The majority of the population is concentrated along the coast, where moderate climates, fertile soils, & reliable rainfall support both intensive agriculture & urban growth. Coastal lowlands such as the Swan Coastal Plain in Perth offer flat & fertile land, while inland regions are sparsely populated due to arid & semi-arid conditions, infertile soils, & limited water supply. Access to rivers & water systems, such as the Murray-Darling Basin, has historically supported higher population densities in rural areas. Climate also shapes agricultural practices: intensive farming in wetter, temperate regions supports closer-settled rural populations & urban centres, while extensive farming in drier areas, such as the WA Wheatbelt, results in dispersed rural settlement. Natural resources, particularly mining, have also shaped the distribution of settlements, with towns like Kalgoorlie, & Capel emerging in otherwise remote regions to support resource extraction. Overall, Australia’s environmental constraints have reinforced the concentration of people in temperate coastal regions, leaving much of the interior sparsely populated.
Outline the Changing Demographic Characteristics, including Age & Gender, Socioeconomic & Cultural Distributions in Urban & Rural Places in Australia:
Changing Demographics of Age:
The age characteristics of Australia’s population are changing in both urban & rural places, with overall trends of ageing populations but differing dynamics. In urban areas, the population is slowly ageing, as reflected in the rise in median age in capital cities from 36 years in 2018 to 37 years in 2022. This is linked to higher living standards & better access to healthcare. However, urban populations remain relatively young, with 38% of people aged 20 to 44 years in capital cities compared with 30% in the rest of Australia. Young professionals, students & recent migrants are drawn to cities by centripetal forces such as employment, education & lifestyle opportunities. In contrast, rural places are ageing more rapidly: the median age in regional areas increased from 41 years in 2018 to 42 years in 2022. This is due to youth outmigration to cities for work & study, combined with an increasing proportion of retirees seeking “tree-change” or “sea-change” lifestyles in towns such as Pemberton or Dunsborough. Farmers also tend to be older, further contributing to an ageing rural population.
Changing Demographics of Gender:
Gender characteristics also differ between urban & rural places in Australia. Urban populations tend to have a higher proportion of females. In 2022, the sex ratio in capital cities was 98.2 males per 100 females, reflecting the long-term settlement of women who are attracted to urban centres for safety, socio-cultural opportunities & employment in professional sectors. Women also have higher life expectancy (85 years compared to 81 years for men), increasing their long-term presence in urban areas. By contrast, rural & regional places tend to have a higher proportion of males. In 2022, the sex ratio outside of capital cities was 100 males to 99.2 females, reflecting the male-dominated workforce in industries such as agriculture, mining & construction. Mining towns like Newman & Kalgoorlie demonstrate this skewed gender distribution, where the majority of workers are male.
Changing Demographics of Status:
Socioeconomic characteristics vary significantly between urban & rural places. Urban populations generally have higher income levels, educational attainment, & employment in professional occupations. For example, in Perth the median weekly income is $859, compared with $701 in the Central Wheatbelt of WA. Additionally, 24% of Perth’s population holds a tertiary qualification, compared with only 9% in the Wheatbelt. Urban populations are increasingly employed in tertiary & quaternary industries such as education, health & research, although they face growing issues of housing affordability, with Perth’s housing prices increasing by 50% in the past decade. Rural populations generally have lower incomes, lower educational attainment, & higher unemployment levels, with labour force participation at 55% in the Central Wheatbelt compared to 65% in Perth. Many rural residents, particularly farmers, work longer hours, with 32% working over 45 hours per week compared to 21% in Perth. Rural economies remain reliant on agriculture, mining & tourism, which dominate local employment opportunities.
Changing Demographics of Cultural Distributions:
Cultural characteristics of Australia’s population are also changing, with urban places becoming increasingly multicultural while rural places remain less diverse. In capital cities such as Perth, 40% of residents were born overseas, with England, New Zealand, India, South Africa & Malaysia being the most common countries of origin. Skilled migrants, who made up over 70% of Australia’s migration intake in 2024/25, are attracted to capital cities due to employment opportunities & established migrant networks, reinforced by chain migration. By contrast, rural places generally have less cultural diversity, although regional migration programs and seasonal agricultural work bring temporary increases in cultural variety. For example, towns such as Manjimup have seen an influx of short-stay migrants from Tonga for fruit picking. Additionally, Indigenous Australians make up a higher proportion of the population in many rural & remote areas, shaping the cultural identity of these regions.
Define - Mitigation:
The implementation of strategies to eliminate or minimise the severity of a hazard or similarly adverse occurrence such as climate change.
Define - Sustainable Housing Design:
A strategy that aims to mitigate global climate change by reducing greenhouse gas emissions and promoting environmentally responsible living.
Define - Fossil Fuels:
Non-renewable, carbon-based energy sources formed from the fossilized remains of ancient plants & animals that lived millions of years ago, such as coal, petroleum (oil), & natural gas.
Define Renewable Energy:
Energy derived from natural resources and processes that are continuously replenished on a human timescale, such as sunlight, wind, water, and biomass. Unlike fossil fuels, these sources are not depleted when used.
Define - Non-Renewable Energy:
Non-Renewable energy comes from sources with a finite supply that exist in fixed quantities on Earth and cannot be replenished at a rate comparable to human consumption.
Define - Adaptation:
Adaptation is when humans make alterations or adjustments in response to changed environmental conditions.
Definition - Climate:
The long term (decades) average weather conditions for a particular location. It is measured by examining the patterns of precipitation and temperature and is expressed as seasonal averages. For example, Perth has a Mediterranean climate (hot, dry summers and mild, wet winters).
Definition - Climate Change:
Long term change in the statistical distribution of weather patterns over periods of time that range from decades to millions of years. It may be a change in the average weather condition or a change in the distribution of weather events with respect to an average; for example, greater or fewer extreme weather events. Climate change may be limited to a specific region, or may occur across the whole earth. Variations in temperature may result in either global cooling (i.e. ice ages) or global warming. In recent history, certain human activities have also been identified as significant causes of current climate change, often referred to as global warming. For example, global surface temperatures have risen 1.2oC since 1880 and in Australia surface temperatures have increased by 1.5oC since 1910.
Definition - Orographic Rainfall:
A type of rainfall that is created by mountains that act as a barrier, coastal facing slopes receive more rainfall that inland facing slopes & areas.
Definition - Albedo:
The reflectivity of a surface.
Definition - Heat Budget:
The balance between incoming solar radiation (insolation & outgoing heat energy (radiation) on Earth.
Definition - Greenhouse Gas:
Gases that absorb and delay the escape of heat from the atmosphere into space.
Definition - Greenhouse Effect:
The greenhouse effect is an essential component/element to system.
Definition - Carbon Cycle:
A biochemical cycle whereby carbon continues to be recycled by exchanges between sinks or reservoirs in the atmosphere, lithosphere, hydrosphere & biosphere.
Definition - Atmospheric Circulation:
A system driven by insolation involving the large scale movement of air, controlling the distribution of heat across the Earth’s surface. It generates global wind systems & high & low pressure cells – it is a major factor in regulating global temperatures.
Describe the Key Elements of the; Heat Budget (including the Greenhouse Effect):
Heat Budget Definition: The balance between incoming solar radiation (insolation & outgoing heat energy (radiation) on Earth – an essential system in influencing the Earth’s climate.
Grean House Effect Definition: The greenhouse effect is an essential component/element to system.
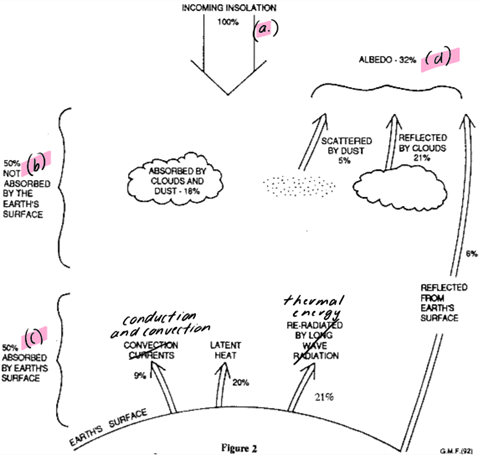
The Earth’s heat budget is a fundamental system that regulates the planet’s climate by balancing incoming and outgoing energy. As shown in the diagram, shortwave solar radiation from the sun takes approximately 8 minutes to reach the Earth and constitutes 100% (a) of incoming solar energy. Of this energy, around 50% is absorbed by the Earth’s surface, warming it, while the remaining 50% (b) is reflected or filtered by the atmosphere, clouds, and surface features. The absorbed energy is then re-emitted as longwave radiation back into the atmosphere, where some is trapped by greenhouse gases, maintaining the Earth’s temperature. This continuous exchange of energy between incoming solar radiation and outgoing terrestrial radiation forms the heat budget cycle, which is essential for sustaining climate patterns and influencing processes such as evaporation, weather formation, and seasonal temperature variations.
Not all incoming solar radiation contributes to the Earth’s heat budget cycle, as a significant portion is reflected back into space through the process of albedo. Approximately 32% (d) of insolation is reflected, with 21% scattered by clouds, 5% by dust and aerosols, and 6% by light-coloured surfaces such as Antarctica. This reflected energy does not directly influence the climate system. Of the remaining incoming solar radiation, about 18% is absorbed by atmospheric components including water vapour in clouds, dust, and ozone. This absorption plays a critical role in the heat budget cycle by warming the atmosphere, influencing weather patterns, and regulating the distribution of energy across the Earth’s surface.
As shown in the diagram, the remaining 50% of incoming solar radiation passes through the atmosphere and is absorbed by the Earth’s surface (c), which then re-emits this energy as longwave radiation. This longwave radiation moves slowly and has less energy, so it cannot easily pass through the atmosphere, gradually heating the air. Approximately 9% of this energy is transferred through conduction and convection currents, known as sensible heat, which is the heat we can physically feel. Around 20% of the energy is carried upward by water vapour through evaporation, called latent heat, as it is stored in water molecules. The remaining 21% of heat energy is re-radiated as thermal infrared energy, contributing to the overall redistribution of energy within the heat budget cycle and regulating atmospheric temperature and climate patterns.
As illustrated in the diagram, not all of the longwave radiation re-emitted by the Earth’s surface escapes into space, as approximately 15% is absorbed by greenhouse gases (GHGs) in the lower atmosphere, including carbon dioxide (CO₂), methane (CH₄), and water vapour (H₂O). This process, known as the natural greenhouse effect, traps heat and warms both the lower atmosphere and the Earth’s surface, playing a crucial role in the heat budget cycle by regulating energy flow. Without this effect, the planet would be around 30°C cooler, with a much greater diurnal temperature range and freezing cold nights, making it inhospitable for life. The absorption and retention of heat by GHGs therefore maintain the balance of the Earth’s heat budget and sustain the stable climate conditions necessary for ecosystems and human life.
Describe the Key Elements of the Hydrological Cycle:
Hydrological Cycle Definition: The hydrological cycle, also known as the water cycle, is the continuous circulation of water on, above, and below the surface of the Earth. It involves various processes like evaporation, transpiration, condensation, precipitation, runoff & infiltration driven by solar energy and gravity.
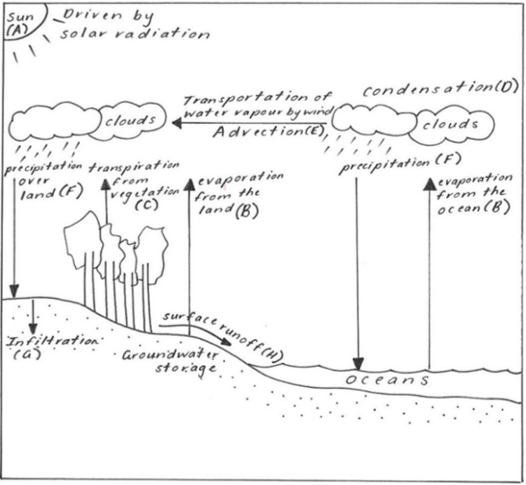
The uptake of water in the hydrological cycle (A–C on the diagram) is powered by the sun, which provides the energy for evaporation and transpiration. Approximately 97% of the Earth’s water is stored in the oceans, making them the dominant source of evaporation, while only 3% is freshwater, with 2% locked in icecaps and glaciers and just 1% available in rivers, lakes, swamps, and reservoirs to contribute to the cycle. Through evaporation from oceans, rivers, and lakes (A), and transpiration from plants (B), water is released as vapour into the atmosphere. Together, these processes are called evapotranspiration (C), and they transfer water from the Earth’s surface into the atmosphere, where it cools, condenses, and forms clouds, enabling its eventual return as precipitation and ensuring the continuous cycling of water through all of Earth’s spheres.
Once water vapour enters the atmosphere, it cools and condenses (D) into tiny droplets of liquid water, often coalescing around particulate matter to form clouds. This moisture can then be transported across regions through advection (E), as winds move clouds and atmospheric water over large distances. Eventually, the droplets become heavy enough to fall as precipitation (F) in the form of rain, sleet, hail, or snow. After evaporating, a water molecule typically remains in the atmosphere for about 10 days before returning to the Earth’s surface, although in equatorial regions, warm rising air can cause these processes to occur daily, producing frequent cloud cover and thunderstorms. These steps ensure that water is temporarily held in the atmosphere, allowing its distribution across different parts of the globe.
When water falls back to the Earth as precipitation, it can infiltrate the soil (G), percolating through the soil profile and collecting in underground aquifers, which recharge groundwater supplies. Water that does not infiltrate becomes surface runoff (H), flowing across the land to refill rivers, streams, lakes, and eventually the oceans. Over time, both surface and groundwater are returned to the atmosphere through evaporation, continuing the closed cycle. These processes ensure the redistribution and storage of freshwater on land, which constitutes only 3% of the Earth’s total water, with 2% locked in icecaps and glaciers and just 1% available in lakes, rivers, swamps, and reservoirs.
Describe the Key Elements of the Carbon Cycle:
Carbon Cycle Definition: A biogeochemical cycle whereby carbon continues to be recycled by exchanges between sinks or reservoirs in the atmosphere, lithosphere, hydrosphere & biosphere.
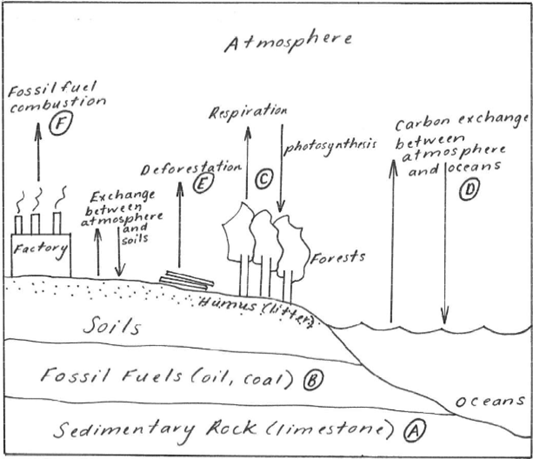
The lithosphere plays a major role in the carbon cycle, acting as both a storage and release system for carbon. The majority of carbon is stored in sedimentary rocks such as limestone (A), while fossil fuels like coal and oil represent another significant carbon reservoir that can be released into the atmosphere through mining (B). Permafrost soils, which cover approximately one-quarter of the land in the Northern Hemisphere, sequester carbon while frozen but slowly release greenhouse gases such as methane and carbon dioxide (CO₂) when thawed during warmer months. Additionally, tectonic activity, including volcanic eruptions, contributes to carbon release through degassing, whereby carbon dissolved in magma is emitted into the atmosphere. These processes highlight the lithosphere’s dual role in both storing carbon long-term and influencing atmospheric carbon levels through natural and human-induced activity.
The biosphere plays a key role in the carbon cycle through processes such as respiration and photosynthesis. Animals take in oxygen and release carbon dioxide (CO₂) as a waste product through respiration, while green plants sequester carbon from the atmosphere during photosynthesis (C) by combining water and CO₂ to build new carbon compounds. Vegetation effectively regulates atmospheric carbon levels, offsetting emissions from decaying plant and animal matter, soils, and rocks. For example, a mature tree can sequester approximately 22 kg of CO₂ per year, demonstrating the importance of plant biomass in maintaining carbon balance and mitigating greenhouse gas concentrations in the atmosphere.
The hydrosphere acts as a major carbon store, holding about 50 times more carbon than the atmosphere (D). Marine organisms, such as phytoplankton, absorb and release dissolved CO₂ through photosynthesis and respiration, contributing to carbon cycling in the oceans. Due to anthropogenic activities that release additional carbon into the atmosphere, more CO₂ is being absorbed by the oceans, which currently take up approximately 30% of human-caused emissions. Over time, this has led to increased ocean acidity, negatively impacting marine ecosystems and oceanic processes. Carbon is also stored long-term in the ocean floor as sedimentary rock through the deposition of dead and decaying marine life. Despite these exchanges between sources and sinks, the system generally maintains a balance over long timescales, regulating global carbon levels.
Describe the Key Elements of Atmospheric Circulation:
Atmospheric Circulation Definition: A system driven by insolation involving the large-scale movement of air & controlling the distribution of heat across the Earth’s surface. It generates global wind systems & high & low pressure cells. It is a major factor in regulating global temperatures.
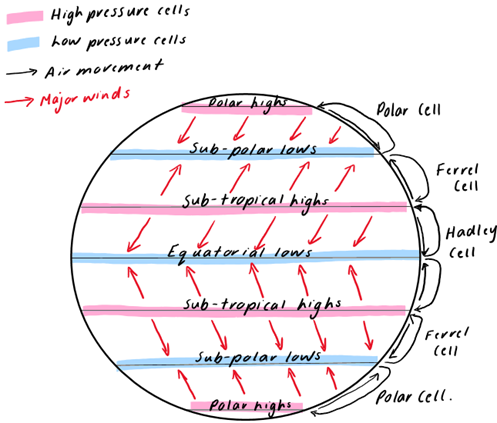
As demonstrated in the diagram, atmospheric circulation is driven by the uneven heating of the Earth’s surface due to the tilt of its axis and its curvature, which causes the equator to receive more solar energy than the poles. This uneven heating generates differences in air pressure that drive wind systems, as the atmosphere works to redistribute heat and maintain balance. To achieve this, three major circulation cells operate in each hemisphere: the Hadley cell, which circulates warm air from the equator toward subtropical regions; the Ferrel cell, which moves air between the subtropics and the mid-latitudes; and the Polar cell, which circulates cold air near the poles. These large-scale cells interact to transport heat and moisture around the globe, shaping prevailing winds, weather patterns, and climate zones across different latitudes.
The Hadley cell is the largest of the three atmospheric circulation cells, extending from the equator (0°) to approximately 30° north and south. Often called the “heat engine,” it follows the overhead sun, known as the heat equator, which receives the most direct insolation. This intense heating causes the air to warm, become less dense, and rise, leading to cooling and condensation as the air ascends. This process forms clouds and results in cloudy, unstable, and wet conditions with frequent rainfall. The rising air also creates a broad band of low pressure at the equator, known as the equatorial lows, which drives the movement of air toward higher latitudes and is a key component of global atmospheric circulation.
The Polar cells are located in the polar regions, beyond 60° north and south of the equator, where the region receives relatively low insolation. The cold, dense air in these areas sinks toward the surface, creating dry, stable, and generally fine conditions with clear skies. This sinking motion generates a broad band of high pressure, known as the polar highs, which drives the circulation of air toward lower latitudes and interacts with the Ferrel and Hadley cells to help redistribute heat and maintain global atmospheric balance.
The Ferrel cells occupy the mid-latitudes between the equator and the poles, acting as intermediate circulation systems that connect the Hadley and Polar cells. These cells are associated with key pressure belts, including the subtropical highs around 30° latitude and the subpolar lows near 60° latitude. Air within the Ferrel cells moves in a more complex pattern, generally flowing poleward at the surface and equatorward aloft, and helps to transport heat and moisture between the warm tropics and cold polar regions. By linking the Hadley and Polar cells, Ferrel cells play a crucial role in shaping prevailing westerly winds, storm tracks, and the overall redistribution of energy in the Earth’s atmosphere.
The Ferrel cells, located in the mid-latitudes between the equator and the poles, act as intermediate circulation systems linking the Hadley and Polar cells. These cells are associated with pressure belts such as the subtropical highs around 30° latitude and the subpolar lows near 60° latitude. Within the Ferrel cells, air generally moves poleward at the surface and equatorward aloft, helping to transfer heat and moisture between the tropics and polar regions. The variation in air pressure within these cells generates prevailing winds, such as the westerlies, which blow from the subtropical highs toward the subpolar lows, as indicated by arrows on the diagram. By redistributing energy and driving these wind patterns, Ferrel cells play a key role in shaping mid-latitude weather systems and the global atmospheric circulation.
Explain how the Heat Budget Influences Climate:
The heat budget significantly influences Earth’s climate by regulating the concentration of greenhouse gases, which control the amount of heat retained in the atmosphere. Greenhouse gases such as carbon dioxide (CO₂) absorb longwave radiation, a key component of the heat budget, keeping the planet warm enough to sustain life. Human activities, including fossil fuel burning and deforestation, have increased CO₂ levels in the troposphere, enhancing the natural greenhouse effect and trapping more heat, contributing to a global temperature rise of approximately 1.2°C since 1880, as shown in the diagram. This warming affects the climate system by increasing evaporation rates and altering rainfall patterns, particularly in equatorial and tropical regions. Additionally, the reflective ability of surfaces, or albedo, interacts with the carbon cycle; ice-covered regions with high albedo reflect more insolation, cooling the Earth, whereas low-albedo areas such as tropical rainforests absorb more heat, amplifying warming.
Explain how the Hydrological Cycle Influences Climate:
The hydrological cycle significantly influences climate by regulating key elements of weather such as temperature and rainfall. When water is taken up into the atmosphere through evaporation (A, B) and transpiration (C), it contributes to cloud formation (D) and precipitation (F), creating long-term climatic patterns to which soils, vegetation, and people have adapted. Disturbances to the cycle, such as deforestation, reduce evapotranspiration rates and can lead to drier conditions; for example, rainfall in southwestern Western Australia has declined by 20% since the 1970s, with forest loss responsible for around half of this decrease. Conversely, warming oceans increase evaporation (A, B), adding more water vapour to the atmosphere (C) and enhancing rainfall, particularly in equatorial regions like Singapore, where daily thunderstorms occur, providing a cooling effect and helping regulate temperatures. Through these processes, the movement and storage of water across the land (G, H) and atmosphere maintain climate stability and influence regional and global weather patterns.
Explain how the Carbon Cycle Influences Climate:
The carbon cycle plays a crucial role in regulating global climate by controlling the concentration of carbon compounds, such as carbon dioxide and methane, in the atmosphere. When levels of CO₂ are high, more heat is trapped in the troposphere, leading to higher temperatures, whereas lower CO₂ concentrations result in cooler temperatures. Carbon sinks, including oceans (D), vegetation (C), sedimentary rock (A), and permafrost soils, sequester carbon and help keep atmospheric levels in check. Conversely, carbon sources such as mining (B), deforestation, and melting permafrost release carbon back into the atmosphere, increasing concentrations. Today, atmospheric CO₂ levels are the highest they have been in the past three million years, having risen by approximately 50% since the Industrial Revolution due to anthropogenic activities like fossil fuel combustion and forest clearance. Enhanced carbon emissions intensify the greenhouse effect, trapping more heat and raising global temperatures, while the removal of carbon sinks, such as vegetation, further reduces the biosphere’s capacity to sequester carbon, amplifying climate change.
Explain how Atmospheric Circulation influences Climate
Atmospheric circulation plays a crucial role in shaping global climate by distributing heat and moisture around the planet through patterns of high and low pressure cells. Low pressure cells, highlighted in blue on the diagram, occur where warm, less dense air rises, cools, condenses, and produces clouds and rainfall. These cells form the equatorial lows, a continuous band around the equator, bringing regular thunderstorms and rainfall that have a cooling effect on temperatures in tropical regions. In contrast, high pressure cells, formed by sinking cool, dense air, create dry and sunny conditions. These cells form the sub-tropical highs, two large bands in each hemisphere, which influence regions like southern Australia during summer, bringing hotter and drier conditions. Overall, the movement and positioning of these pressure systems directly affect local temperature, precipitation patterns, and the seasonal climate experienced across the globe
Definition - Environment:
The living (biotic elements – plants & animals) & non-living (abiotic elements – rocks & air) elements of the Earth’s surface & atmosphere including changes made by humans.
Broadly classified as the cultural (modified by humans) or natural environment & can exist on various scales (local, regional, global).
E.g., the local environment at Point Walter Reserve in Bicton or the regional environment of the Jarrah forests in Southwest WA.
Definition - Biome:
A community of life forms adapted to a large natural area, biomes have two main categories: natural and anthropogenic.
Definition - Natural Biome:
A biological community of living organisms adapted to a large natural area and has not been directly altered or changed by human activity.
Natural biomes include aquatic, deserts, forests, tundra and grasslands featuring distinctive vegetation, climate & soil characteristics.
E.g., plants within a tropical rainforest adapt to hot & wet conditions such as drip tip leaves, thin/smooth bark & climbing woody vines that capture sunlight.
Definition - Anthropogenic Biome:
Biomes that result from sustained direct human interactions within ecosystems altering the form and function of the terrestrial biosphere.
E.g., anthropogenic biomes include urban, rural or villages, croplands & rangelands – Metropolitan Perth is an anthropogenic biome that is urban in nature due to the establishment & growth of urban settlements which has replaced natural vegetation
Definition - Land Cover Change:
Changes that have taken place in natural environments due to a variety of natural (climate change or natural hazards) and/or human induced causes (deforestation urban expansion, agriculture & mining).
E.g., over the last 100 years 90% of native woodlands have been cleared in the Wheatbelt Region of WA for agriculture resulting in loss of habitats, biodiversity loss and land & soil degradation (salinity & erosion).
E.g., Urban encroachment into areas of native vegetation and/or farmland, over 900 hectares of native vegetation is converted into urban areas in Perth per year.
Definition - Ecosystem:
A community made of biotic & abiotic elements that interact with each other through energy & nutrient cycles. While environment refers to the surroundings, ecosystem means the interaction between the environment & living organisms.
Definition - Ecosystem Dynamics:
The relationships between biotic & abiotic elements including the flow of energy between the elements (food chains & food webs). There is also an exchange of matter between biotic & abiotic elements (i.e., nutrient cycle).
E.g., Water is recycled as well as the exchange of carbon between sinks and sources.
Definition Biodiversity Loss:
The extinction of plant and/or animal species worldwide, & the local reduction or loss of species in a certain habitat.
E.g., In Southwest WA black the black cockatoo population has been decimated by land clearing for anthropogenic activities such as urban areas, mining & agriculture – over 50% of the population of 3 species have been lost over the last 50 years.
E.g., only 50% of Australia’s forests & bushland remain intact compared to pre-European arrival.
Causes of biodiversity loss may result from natural processes & anthropogenic activity
Natural causes: asteroid impacts, large volcanic eruptions, sea level changes and interglacial & glacial periods.
Anthropogenic causes: land cover change (e.g., deforestation), introduction of feral animals, overexploitation (e.g., fishing) & introduction of genetically modified species (e.g., crops in farming)
E.g., due to deforestation, Indonesia has the highest number of declining species in the world.
Definition - Climate Change:
A long-term change in the statistical distribution of weather patterns in a place over periods of time ranging from decades to millions of years. It may be a change in the average condition or a change in the distribution of weather events in respect to an average. Climate change may be limited to a specific region or occur across the Earth.
i.e., the Global surface temperatures have risen 1.2°C since 1880, in Australia surface temperatures have increased by 1.5°C since 1910.
E.g., 2024 was the hottest year on record (since 1880)
Climate change has been caused by various natural processes & anthropogenic most recently human activities such as burning fossil fuels & deforestation have been identified as significant causes of climate change.
Definition - Sustainability:
Meeting the needs of current and future generations through simultaneous, economic, environmental & social adaptations & improvements, achieved by the development & implementation of responsible, long-term planning & risk management.
E.g., Sustainable strategies mitigate effects of climate change by shifting from finite energy sources like coal to renewables like wind & solar, reducing greenhouse gas emissions.
E.g., The increase in investment in public transport infrastructure aims to decrease vehicle emissions & address traffic congestion.
Describe how Remote Sensing Images are used to Identify & Measure the Location, Type, Rate & Extent of Land Cover Change:
Definition of Remote Sensing: Science of obtaining information about objects or areas from a distance, from aircraft or satellites producing aerial, satellite, & infrared images of oceans, land use, and vegetation to measure location, type, rate & extent of land cover change overtime.
Location: Can be examined at a range of scales, from local, regional to global.
Type: The category of land cover change occurring such as deforestation.
Rate: The speed at which changes have taken place over a period of time.
Extent: The size & area of land cover change (LLC).
Example: The Landsat project collects data from a series of satellites creating a variety of remote sending imagery. Since launched in 1972 there has been a total of 9 satellites, the most recent (Landsat 9) takes over 700 scenes per day – the data obtained plays a critical role in monitoring, understanding & managing land cover change
Describe the Process of Land Cover Change - Intensification of Agriculture:
Intensification involves increasing the productivity of existing farmland by improving labour efficiency, technology, irrigation, chemical use, and seed or crop selection. It occurs where land expansion is limited due to urban sprawl or land-clearing restrictions. Globally, food production has grown significantly despite less land being available, with cereal crop production doubling over the past 60 years while the cultivated land area has remained relatively stable. This demonstrates how intensification has enabled food supplies to keep pace with population growth.
Describe the Process of Land Cover Change - Growth of Urban Settlement:
Urban settlement growth results from urbanisation, where natural vegetation is replaced by built structures such as roads, buildings, and infrastructure. Although urban areas cover only 1–3% of global land, they house 56% of the population, and urban land cover has more than doubled since 1992. Expansion is often most rapid on city fringes, leading to urban sprawl. For example, over 900 hectares of vegetation and farmland are converted to urban use each year in Perth. Global urban areas are projected to triple by 2030, with the fastest growth in China and India, reflecting the strong link between rising urbanisation and city expansion.
Outline the Impacts of Growing Affluence - Expansion & Intensification of Agriculture on the Type, Rate & Extent of Land Cover Change:
Growing affluence, measured by rising GDP per capita, increases demand for food, contributing to higher rates and extents of agricultural land cover change. Since 1960, world cereal production and GDP per capita have both tripled, illustrating a strong link between wealth and food production. Affluent diets, especially in MEDCs, are increasingly meat and dairy based, driving global pasture expansion. In China, meat consumption has grown sevenfold since 1990, accounting for 28% of global meat consumption. To meet this demand, countries such as Brazil have converted vast tracts of rainforest into farmland, with around 15% of the Amazon cleared for cattle ranching since 1960. Thus, affluence accelerates both agricultural expansion and deforestation.
Explain the Impact of Aboriginal & Torres Strait Islander People’s Land Management Practices on Land Cover Over Time:
Fire Stick Farming (Cultural Burning):
For thousands of years, Aboriginal peoples used fire stick farming, a practice involving cool, low-intensity mosaic burning of native vegetation. This technique cleared undergrowth, made movement through bushland easier, and reduced the risk of intense wildfires by lowering fuel loads. It also promoted biodiversity by encouraging seed germination in species such as acacia and banksia, while providing fresh grazing pastures for animals like kangaroos. For example, the Noongar people in Southwest WA carried out mosaic burning during the season of Birak (December–January). Over time, this practice transformed dense forests into more open scrublands and grasslands, controlled weeds, reduced bare land, and increased the diversity of understorey vegetation. Today, cultural burning is being revived in some regions, such as the Kimberley, as a sustainable fire and land management tool
Seasonal Calendars:
Aboriginal and Torres Strait Islander peoples developed complex seasonal calendars that guided land management by observing ecological cues rather than fixed dates. For instance, the Noongar people of Southwest WA recognise six distinct seasons, each linked to changes in plants, animals, water, weather, fire, and the stars. These calendars indicated when foods were ready for harvest, when animals were breeding, and when specific land and sea management activities should take place. This ensured resources were used sustainably and prevented overexploitation of the environment. Over time, the use of seasonal calendars maintained ecological balance, minimised long-term impacts on land cover, and demonstrated a deep respect for country by aligning human activity with natural cycles
Definition - Climate Change:
Climate change is a long-term change in the statistical distribution of weather patterns over periods of time that range from decades to millions of years. It may be a change in the average weather condition or a change in the distribution of weather events with respect to an average. Climate change may be limited to a specific region, or may occur across the whole earth.
Definition - Deforestation:
Land cover change involving the removal & conversion of forests to other land uses, such as agriculture, urban development & mining.
Explain Two Anthropogenic Causes of Global Climate Change:
Anthropogenic Cause – Deforestation:
Deforestation is a major driver of climate change because it disrupts the carbon cycle & weakens Earth’s ability to store carbon. Forests act as vast carbon sinks, with one mature tree sequestering up to 22 kg of carbon per year. Since 1970, around 20% of Brazil’s Amazon rainforest has been cleared, often replaced by monocrops like palm oil or pasture, which are only temporary carbon stores. When trees are burned, their stored carbon is released as carbon dioxide, directly adding to greenhouse gas concentrations. This enhances the greenhouse effect, creating a positive feedback loop that accelerates warming. Globally, deforestation contributes about 10% of greenhouse gas emissions, and since 1880, surface temperatures have already risen by 1.2°C.
Deforestation also alters albedo & rainfall patterns. Forests, with low albedo, absorb heat & drive high evapotranspiration, with tropical rainforests generating about 50% of their rainfall this way. Clearing increases surface reflectivity (higher albedo), reduces evapotranspiration, & lowers rainfall. If current rates continue, rainfall across the Amazon Basin could fall by more than 20% by 2050. In southwest Western Australia, deforestation is estimated to have caused 50% of the region’s rainfall decline.
Overall, deforestation accelerates climate change both globally, by releasing greenhouse gases, & regionally, by disrupting rainfall & surface processes, making it one of the most significant human-driven contributors to climate instability.
Anthropogenic Cause – Raising of Ruminant Livestock:
The raising of ruminant livestock is a major driver of climate change, largely due to methane emissions from enteric fermentation. In this digestive process, microbes in the rumen break down plant matter, producing methane that is expelled mainly through belching. One cow emits 60–120 kg of methane per year & one sheep about 8 kg. Livestock account for nearly 30% of global methane emissions, & in Australia they produce two-thirds of national methane emissions. This is especially concerning as methane traps 30–80 times more heat than carbon dioxide, & although it lasts only around 10 years in the atmosphere, it strongly enhances the greenhouse effect. This has contributed to Australia’s 1.5°C temperature increase since 1910.
Livestock farming also adds to other greenhouse gases: about 10% of global carbon dioxide emissions come from land clearing, transport, & machinery use, while manure & fertiliser application contribute 65% of global nitrous oxide emissions. Land clearing for grazing further reduces carbon sequestration, amplifying warming.
Overall, ruminant livestock accelerate global climate change by producing methane, carbon dioxide, & nitrous oxide, which together drive positive feedback loops & intensify the greenhouse effect, making animal agriculture one of the most significant contributors to rising global temperatures.
Explain the Rate of Global Climate Change:
Increase in Global Temperature:
An increase in global temperature drives the rate of climate change by disrupting Earth’s heat balance. Normally, the planet maintains an average temperature of 15°C by balancing incoming solar radiation with outgoing infrared radiation, regulated by the natural greenhouse effect. Human activities, particularly the rise in CO₂, have intensified this effect, trapping more heat & raising the global average temperature by 1.2°C since 1880.
Higher temperatures accelerate climate change through feedback loops. Melting ice & glaciers reduce albedo, causing more sunlight to be absorbed & further warming. Thawing permafrost releases methane, a greenhouse gas 30–80 times more potent than CO₂, & warming oceans absorb less carbon dioxide, weakening a key carbon sink.
Thus, rising global temperatures both indicate & accelerate climate change, with positive feedback loops amplifying warming & increasing the rate of environmental & atmospheric shifts.
Loss of Ice & Glaciers:
The loss of glaciers and ice sheets both results from and accelerates climate change, amplifying global warming. Glaciers and ice sheets, such as the Thwaites Glacier in Antarctica and the Greenland ice sheet, store vast amounts of freshwater and reflect solar radiation, helping regulate Earth’s energy balance. The Thwaites Glacier is retreating at one kilometre per year, with its ice shelf expected to collapse by 2026, potentially raising sea levels by 65 cm. The Greenland ice sheet, melting five times faster over the past 20 years, could contribute 2.6 cm to 21st-century sea level rise under low emissions and up to 5 cm under high emissions, with total capacity of 7.2 m.
Arctic sea ice has declined 13% per decade since 1979, reducing Earth’s albedo and allowing more solar energy to be absorbed by darker ocean surfaces. This enhances warming through positive feedback loops, accelerating the rate of climate change.
Overall, the retreat of glaciers, ice sheets, and sea ice decreases solar reflection, raises sea levels, and disrupts climate systems, intensifying global warming and increasing the pace of climate change.
Sea Level Rise:
Sea level rise is both an indicator and accelerator of climate change. It occurs due to thermal expansion of seawater as it warms and the addition of water from melting glaciers, ice sheets, and declining Arctic Sea ice. Since 1993, global sea levels have risen 102.33 mm, with the current rate of 2.6 mm per year more than doubling the 1.4 mm per year observed for most of the 20th century.
Rising seas increase coastal flooding, storm surges, and erosion, disrupting ecosystems and human settlements. They also alter ocean circulation and heat distribution, amplifying global warming and extreme weather.
Thus, sea level rise both reflects and accelerates climate change, reinforcing warming and increasing the rate and severity of its impacts worldwide.