UNIT 3 AP BIO TEST
1/17
There's no tags or description
Looks like no tags are added yet.
Name | Mastery | Learn | Test | Matching | Spaced | Call with Kai |
|---|
No analytics yet
Send a link to your students to track their progress
18 Terms
Students investigated the effect of light intensity on the rates of photosynthesis and cellular respiration in algae.
They placed equal numbers of algal cells into test tubes containing a solution at pH 7.40. The test tubes were divided into four treatment groups, and each treatment group was exposed to a different light intensity. The pH in the tubes was measured every 10 minutes and used asand used as an indicator of CO, concentration because CO, produces an acidic solution when dissolved in water (Figure 1).
Which of the following claims is best supported by the data?
Algae that are exposed to 100 umo l•m 2.5 of light have a greater rate of photosynthesis than of cellular respiration over time.
Students investigated the effect of light intensity on the rates of photosynthesis and cellular respiration in algae.
They placed equal numbers of algal cells into test tubes containing a solution at pH 7.40. The test tubes were divided into four treatment groups, and each treatment group was exposed to a different light intensity. The pH in the tubes was measured every 10 minutes and used asand used as an indicator of CO, concentration because CO, produces an acidic solution when dissolved in water (Figure 1).
Based on Figure 1, which of the following environmental changes will result in the greatest increase in the net photosynthetic productivity by the algae?
A change in light intensity from 0 mol m-2 s-1 to 30 mol -2* s-1
Students investigated the effect of light intensity on the rates of photosynthesis and cellular respiration in algae.
They placed equal numbers of algal cells into test tubes containing a solution at pH 7.40. The test tubes were divided into four treatment groups, and each treatment group was exposed to a different light intensity. The pH in the tubes was measured every 10 minutes and used asand used as an indicator of CO, concentration because CO, produces an acidic solution when dissolved in water (Figure 1).
Scientists claim that changes in the rate of photosynthesis will be reflected by changes in pH.
Which of the following best supports their claim?
Algae performing photosynthesis remove CO, from the solution, increasing pH.
Students investigated the effect of light intensity on the rates of photosynthesis and cellular respiration in algae.
They placed equal numbers of algal cells into test tubes containing a solution at pH 7.40. The test tubes were divided into four treatment groups, and each treatment group was exposed to a different light intensity. The pH in the tubes was measured every 10 minutes and used asand used as an indicator of CO, concentration because CO, produces an acidic solution when dissolved in water (Figure 1).
Based on Figure 1, which of the following was used as a control in the experiment?
The 0 umol• m •5' light intensity treatment.
In plants the enzyme EPSP synthase catalyzes a reaction between two different substrates, S3P and
PEP, to form a product used in the synthesis of three amino acids. The structure of glyphosate, the active chemical in many herbicides, is very similar to that of PEP.
Which of the following explains how glyphosate most likely functions as an herbicide?
Glyphosate prevents synthesis of the three amino acids by competing with PEP for binding to the active site of EPSP synthase.
Compound X binds to complex IV of the mitochondrial electron transport chain and prevents complex TV from
accepting electrons.
Figure 1. The electron transport chain of cellular respiration. The bold arrows passing through the complexes in the membrane represent the path of electron flow in mitochondria.
Based on Figure 1, which of the following best explains why the cells of an animal exposed to compound X have an increased ratio of NADH to NAD+?
NADH cannot be oxidized to NAD⁺ because complexes I, II, and III cannot accept electrons if electrons cannot be passed to complex IV
Researchers investigated the dynamics of a reaction catalyzed by an enzyme. The researchers prepared a series of reactions, each with the same concentration of enzyme but with different concentrations of substrate. The researchers measured the amount of product in each reaction mixture after 5 minutes. The results are shown in Figure 1.
7. Which of the following best describes how an increase in the concentration of substrate in the reaction mixture affected the frequency of enzyme-substrate interactions?
The frequency of enzyme-substrate interactions increased until all of the active sites were interacting with substrate.
Researchers investigated the dynamics of a reaction catalyzed by an enzyme. The researchers prepared a series of reactions, each with the same concentration of enzyme but with different concentrations of substrate. The researchers measured the amount of product in each reaction mixture after 5 minutes. The results are shown in Figure 1.
Which of the following experimental designs would best allow researchers to investigate the effect of pH on the rate of the enzyme-catalyzed reaction?
Measure reaction rates at different pH levels when the enzyme concentration remains the same and the substrate concentration is 100
UM
Which of the following questions best addresses whether a particular inhibitor is competitive or noncompetitive?
Does the inhibitor bind to an allosteric site or the active site of the enzyme?
The graph in Figure 1 shows the percent saturation of fetal hemoglobin and maternal hemoglobin in humans as a function of the partial pressure of oxygen.
Figure 1. Percent saturation of human hemoglobins as a function of the partial pressure of oxygen
Based on the data, which of the following values is closest to the predicted difference in the percent saturation of fetal hemoglobin and maternal hemoglobin at 40 mm Hg?
20
The diagram below shows energy changes in a specific chemical reaction with and without the addition of an enzyme to the reaction.
Which of the following questions can best be answered by the diagram?
Does the addition of an enzyme reduce the activation energy required for the reaction?
Figure 1 shows the change in energy over the course of four chemical reactions.
Figure 1. Change in energy over the course of four chemical reactions.
Based on the data in Figure 1, which of the following most likely represents the change in energy that occurs when ATP hydrolysis is coupled with the phosphorylation of a substrate?
Line 3 represents ATP hydrolysis and line 2 represents phosphorylation of a substrate
Researchers studied the effect of increased temperature on the rate of respiration of three species of Saccaromyces yeast (Q, R, and S) by measuring the rate of oxygen uptake in each species at 30°C and 35°C (Figure 1).
Based on Figure 1, which of the following statements about the effect of the temperature increase on the respiratory rate of one of the. species Q, R, or S, is most likely true?
The median O, uptake rate for species S at 35°C is 0.1 uL xmg xmin' less than it is at
30°C.
Which of the following best describes the process by which the bacteria are breaking down the glucose to produce lactic acid?
The bacteria are breaking down sugars in the absence of oxygen.
Based on the data in Table 1, which of the following is the earliest time point at which there is a statistical difference in average pH between the control and treatment groups?
35 minutes
Which of the following was the dependent variable in the researcher's experiment?
pH
A scientist performed an experiment to test the ability of chloroplasts to produce ATP in the dark.
The scientist maintained chloroplasts under dark conditions and placed them first in a pH 4 solution for 15 seconds and then in a pH 8 solution containing ADP and P, (inorganic phosphate).
Under these conditions, the pH of the stroma increased to 8, the pH of the thylakoid space remained at 4, and the chloroplasts produced ATP.
The difference in pH created a proton gradient that enabled protons to pass through ATP synthase, activating it to produce ATP.
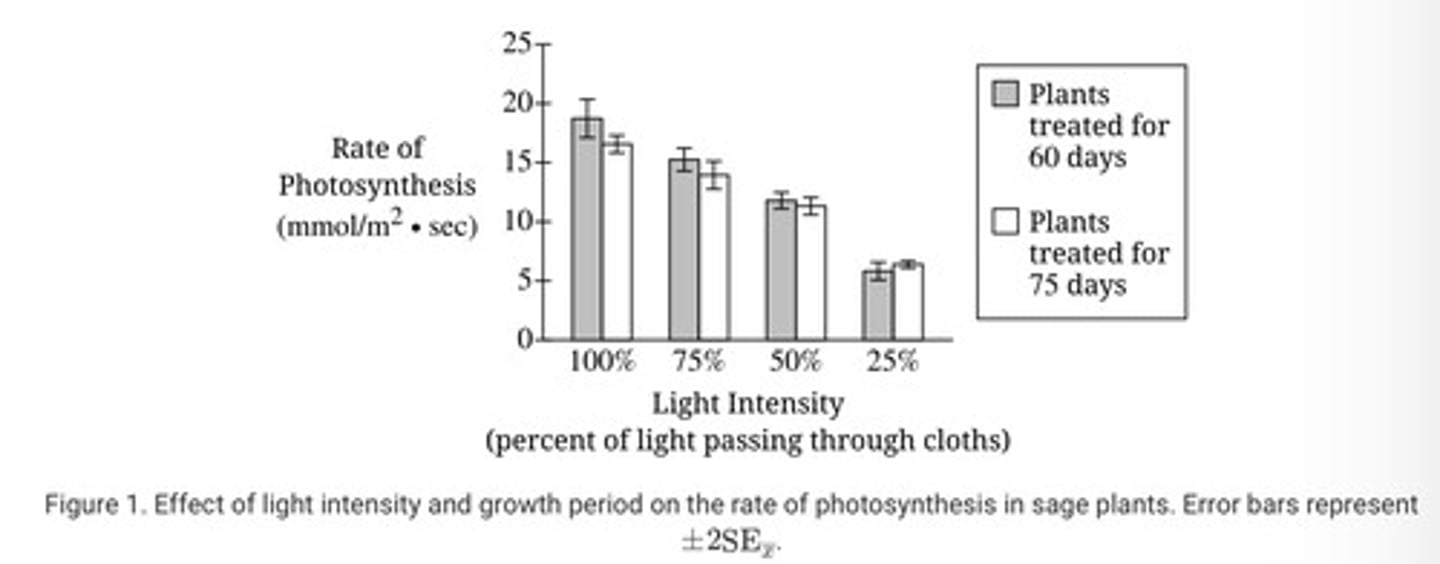
Using light-filtering cloths, scientists exposed sage plants to four different light intensities. Half of the sage plants were exposed to light for 60 days, while the other half were exposed to light for 75 days. The rate of photosynthesis in each plant was then determined (Figure 1).
Figure 1. Effect of light intensity and growth period on the rate of photosynthesis in sage plants. Error bars represent +2SE*
Which of the following statements best describes the data?
At 75% light intensity, the rate of photosynthesis was unaffected by an increase in treatment time.