12ECON Ch 1 Australia's International Trade
1/23
There's no tags or description
Looks like no tags are added yet.
Name | Mastery | Learn | Test | Matching | Spaced | Call with Kai |
|---|
No analytics yet
Send a link to your students to track their progress
24 Terms
Globalisation Definition
. the increased interconnectedness and interdependence of people and countries resulting from the expanding integration of trade, finance, people and ideas in one global marketplace
—> advancements in tech, communication, science, transport and industry have accelerated the pace of this integration over the past few decades
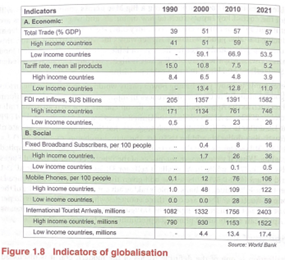
Identify 6 Globalisation Indicators
Value of trade as a % of world GDP – increased from 39% (1990) to 57% (2024)
Average global tariff rate – decreased from 15% (1990) to 5% (2020)
Inflows of foreign investment – increase from US$295b (1990) to US$1582b (2021)
International tourist arrivals – more than doubled between 1990 to 2021.
Foreign direct Investment (FDI):
. Direct investment by companies or governments into foreign firms or projects
. Usually – investment that acquires at least 10% equity in the foreign enterprise
. Brings to recipient economy:
—> New technology
—> Management know-how
—> Skilled labour
—> Access to international markets
Trade (openness):
. Ratio of a country’s trade to GDP
. Ratio has increased across all groups of economies (developed and developing)
What is an example of how globalisation is measured
. Swiss Economic Institute (KOF) publishes an annual globalisation index which measures the dimensions:
Economic:
• Trade flows
• Financial flows
Social:
• Personal contact
• Information flows
• Cultural globalisation
Political:
• Number of embassies
• International non-government organisations
• Participation in UN peacekeeping missions
. Producing a Globalisation score on a scale from 1 to 100 – out of 206 countries
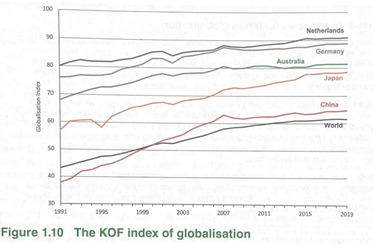
Explain the KOF index of globalisation diagram
• Highest – Netherlands; Switzerland; Belgium (top 15 all in Europe – due to the strength of the EU)
—> reason why EU countries high: high development, close to other countries, physically smaller, part of EU
• Small countries tend to be more globalised:
• EG: big countries US – 24th; Japan – 36th; China – 80th
• Australia – 28th
• Trend – most countries have seen a consistent rise in the index from 1991-2010 but after 2010 has plateaued
Explain factor 1 facilitating globalisation
1. Liberalisation of markets to the flow of goods, services and investment:
. Establishment of a number of UN organisations:
• General Agreement on Tariffs and Trade
—> Set up in 1947 – aim of reducing trade barriers to increase general living standards and promote full employment
• IMF
• World Bank
. Establishment of regional trading groups:
• EU
• North American Free Trade Agreement (NAFTA)
• Association of Southeast Asian Nations (ASEAN)
. Establishment of free trade agreements
Explain factor 2 facilitating globalisation
2. Technology:
. Advances in transport and communications - time-space convergence
—> Travel time between places decreases and distance declines in terms of its significance (but actual physical distance remains the same)
. Transport costs and travel time decreases = more merchandise trade and tourism
. Information technology development = growth of trade in services
Explain factor 3 facilitating globalisation
3. Multinational Corporations (MNCs):
—> Very large firms with headquarters in one country and subsidiaries in one or more other countries
. Establish production and/or retail and distribution facilities in other countries
. 1970 = 7 000 MNCs
. 2026 = over 100 000 parent companies and ~1 million subsidiaries or affiliates
. MNCs expand to increase their sales, market share and profits —> exporting to foreign location of subsidiary through FDI
. Developing countries: mergers and acquisitions
. Developed countries: construction of new facilities (greenfield investment)
. MNCs account for ~1/4 of global GDP
11 Advantages of Globalisation
Provides access to wider range of goods and services
lowers prices: Higher exports (and therefore more imports) = cheaper goods and inputs in production
provides more and higher-paying jobs (due to Growth of businesses in global marketplace)
increases competition + efficiency (Competition in global markers = increased efficiency of companies)
Reduces global poverty (% of people living in extreme poverty has been cut in half)
increases economic growth (New technologies and greater competition)
increases overall living standards
enabled developing economies to access foreign investment
increases multiculturalism
Greater FDI = increased domestic production and employment and source of new technologies = higher productivity
Uniting of people – promotion of a common culture = promotion of stability and world peace
9 Disadvantages of Globalisation
Results in higher unemployment among low-skilled workers (free trade results in job losses in less competitive economies)
—> rational behind trade barriers to protect domestic jobs
lowers wages
destruction of cultural diversity and local cultures (local markets overrun with global brands)
erodes democracy (extreme ideas around people opposed to or for globalisation can cause civil disorder)
increases poverty (Arguably global poverty has not been reduced and income inequality around the world appears to have increased)
unfair to developing countries (favouring the richer, developed nations at the expense of less developed countries)
increases environmental damage due to increased industrialisation
Interdependence (global financial flows) = cause of financial crises in developing economies
—> can leave countries vulnerable in times of war or pandemic
—> volatile capital flows have destabilised developing economies
Can enable the rapid spread of a pandemic
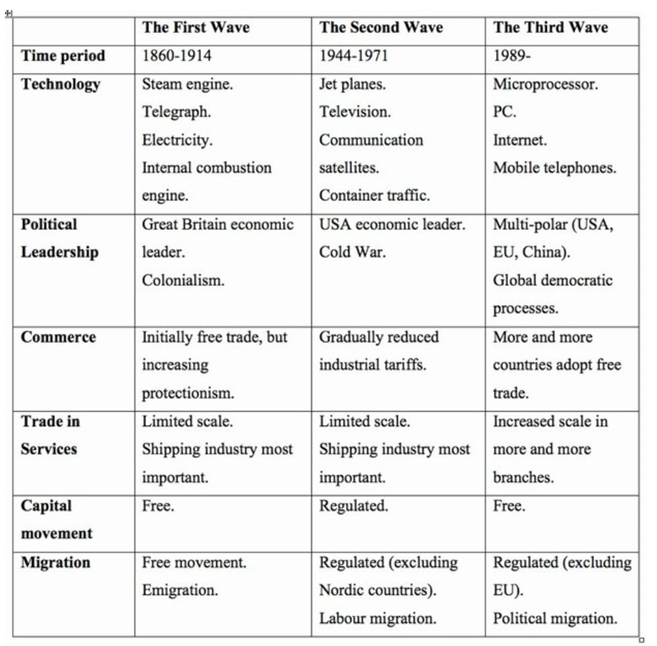
Describe the 3 waves of globalisation, in terms of time period, technology, political leadership, commerce, trade in services, capital movement, and migration
Describe the general trend in global trade overtime
. rapid growth in world trade
Describe 4 reasons for the growth in world trade overtime and a condition to this trend
• Success of world organisations (eg. WTO, IMF and World Bank)
• Improvements in transport and communications = lower costs
• Trade allows for exchange and then specialisation, which results in economic efficiency
• Generally, economies have become more open to trade and investment
—> Condition: However, there has been a rise in economies adopting protectionist policies (away from free trade) like the US tarrifs in April 2025 = slowing of globalisation
Describe what Trade Intensity is
. total trade (exports + imports) as a percentage of GDP
. a measure of globalisation
Describe the relationship between trade intensity and GDP per capita
. rising share of world trade in GDP (trade intensity) has been correlated (strong positive correlation) with rising GDP per capita
. World trade as a % of GDP has increased from ~37% in 1991 to 61% in 2008 (highest level)
. GDP per capita has experienced a rate of increase – more than doubling from ~$4 400 USD in 1991 to ~$9 500 USD in 2008
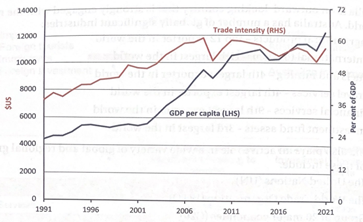
Describe what the relationship between trade intensity and GDP per capita reveal
. the approximate measure of world living standards
Why do economists believe increased trade intensity is important
. as it’s a significant catalyst for both higher economic growth and higher real incomes
Describe how the GFC contributed to slowbalisation
. Rapid increase in globalisation with its third wave growing, then affected by the GFC
. Since the GFC the paced as slowed – 60% (2012) to 57% (2021)
. Slow trade = slower growth = slowbalisation
What is slowbalisation
. the slowing pace of global economic integration
What are the 6 main reasons for long term Slowbalisation
• The cost of moving goods has stopped falling
• Multinational firms have found that global sprawl burns money and that local rivals outcompete them
• Activity is shifting towards services, which are harder to sell across borders
• Chinese manufacturing has become more self-reliant (invested in capital stock), so needs to import fewer parts
• Trade is suffering as firms use up the inventories they had stocked in anticipation of higher tariffs
• firms’ long-term investment plans, as they begin to lower their exposure to countries and industries that carry high geopolitical risk or face unstable rules
—> signs that an adjustment is beginning, Chinese investment into Europe and America fell by 73% in 2018
—> The global value of cross-border investment by multinational companies sank by about 20% in 2018
What are the 2 disadvantages of the slowbalisation trend
1. Emerging economies, who were closing the gap between them and developed economies, now will struggle to prosper due to a decline in trade
Problems created by globalisation won’t be really solved:
• Automation means there will be no renaissance of blue-collar jobs in the West
• Firms will hire unskilled workers in the cheapest places in each region.
• Climate change, migration and tax-dodging will be even harder to solve without global co-operation.
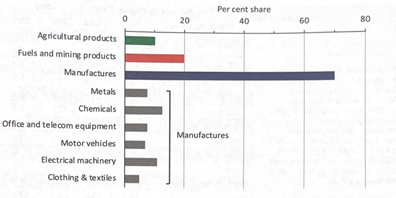
Describe the pattern of global trade with goods vs services
Physical goods ~79% (goods are easier to trade)
• Agriculture ~9%
• Mining and fuels ~15%
• Manufactured goods ~55%
Services ~21%
• Transport and travel ~50%
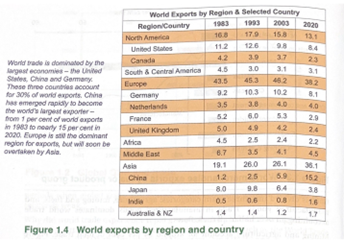
Describe what types of countries thrive in trade
. Countries that dominate world trade are the largest economies:
• US (largest importer)
• China (largest exporter)
• Germany
Describe the benefits of individuals engaging in trade in terms of exports and imports
. individuals (households and firms) engage in trade which is advantageous:
—> Exports: domestic producers gain from higher prices and greater production
—> imports: domestic consumers benefit from lower prices and greater consumption
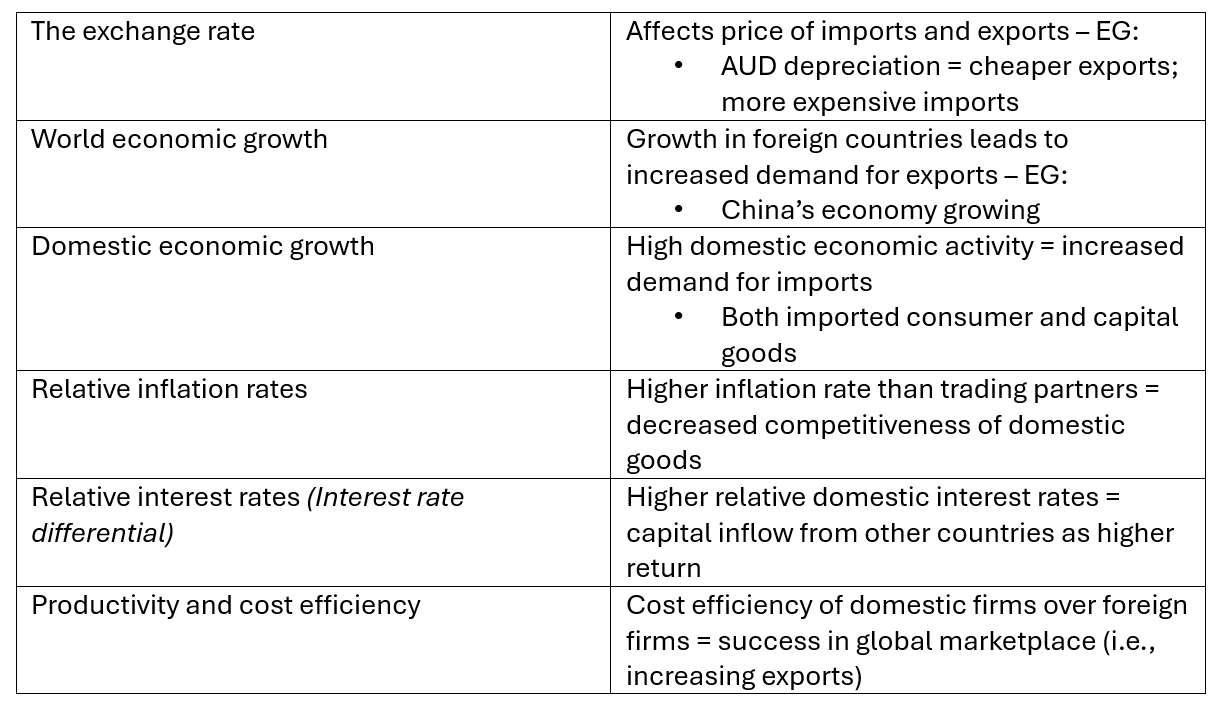
Describe the 6 factors that affect economic transactions between economies